
PracHub
QuestionsLearningGuidesInterview Prep

Meta Data Scientist Interview Guide 2026

This guide covers the Meta Data Scientist (Analytics) interview process with a product-analytics emphasis, detailing interview stages, the......

Topics: Meta, Data Scientist, interview guide, interview preparation, Meta interview

Author: PracHub

Published: 3/15/2026

Related Interview Guides

  • Intuit Data Scientist Interview Guide 2026
  • Snapchat Data Scientist Interview Guide 2026
  • Thumbtack Data Scientist Interview Guide 2026
  • Two Sigma Data Scientist Interview Guide 2026
HomeKnowledge HubInterview GuidesMeta
Interview Guide
Meta logo

Meta Data Scientist Interview Guide 2026

This guide covers the Meta Data Scientist (Analytics) interview process with a product-analytics emphasis, detailing interview stages, the......

6 min readUpdated Jul 1, 2026617+ practice questions
617+
Practice Questions
3
Rounds
6
Categories
6 min
Read
Contents
TL;DRSample QuestionsAbout the Interview ProcessWhat to expectThe interview processRecruiter screenTechnical screenFinal loop (onsite)What they testAnalytics & Experimentation (the largest category)Data Manipulation (SQL / Python)Statistics & MathBehavioral & LeadershipMachine Learning (secondary)How to prepare and stand outStrong vs weak answers at a glancePractice with real questionsHow to Use This Page as a Prep PlanVideo WalkthroughFAQHow many interview rounds does the Meta Data Scientist loop have?Is the Meta Data Scientist role about machine learning or product analytics?How much SQL do I need for the Meta Data Scientist interview?How important is the behavioral round for a data science role?How should I answer a "why did this metric drop?" question?How long should I prepare for the Meta Data Scientist interview?Key takeaways
Practice Questions
617+ Meta questions
Meta Data Scientist Interview Guide 2026

TL;DR

Meta's Data Scientist, Analytics interview is more product-analytics heavy than the title suggests. You are not walking into a pure modeling loop. This guide breaks down the stages, the question mix, exactly what each round tests, and how to prepare so you spend your prep where it actually moves the needle. Based on recent candidate reports, the process typically runs in three stages:

Interview Rounds
HR ScreenOnsiteTechnical Screen
Key Topics
Data Manipulation (SQL/Python)Statistics & MathAnalytics & ExperimentationBehavioral & LeadershipMachine Learning
Practice Bank

617+ questions

Estimated Timeline

2–4 weeks

Browse all Meta questions

Sample Questions

617+ in practice bank
Statistics & Math
1

Fake Accounts [AE]

MediumStatistics & MathPremium
View full question
2

Analyze User Comment Distribution and Sampling Effects

MediumStatistics & Math

You are analyzing daily comment counts per user. The individual user-level distribution is right-skewed: many users make zero or few comments, while a small number make many comments.

Constraints & Assumptions

  • Treat the outcome as a nonnegative count.
  • Discuss both the original per-user distribution and the sampling distribution of group averages.
  • Use the Central Limit Theorem carefully: it applies to averages, not to individual counts becoming normal.
  • Assume random groups of equal size unless stated otherwise.

Clarifying Questions to Ask

  • Are zero-comment users included?
  • What is the time window: daily, weekly, or monthly comments?
  • Are users sampled independently, or are there clusters such as groups or markets?
  • Is the goal descriptive analysis, experiment planning, or anomaly detection?

Part 1 - Sketch the User Distribution

Sketch or describe the distribution of individual users' daily comment counts when it is right-skewed. Mark the mean, median, and 95th percentile.

What This Part Should Cover

  • Mass near zero, long right tail, and nonnegative count support.
  • Typical ordering median < mean < p95.
  • Why the mean is pulled right by heavy users.

Part 2 - Analyze Group Averages

Now repeatedly take many random user groups of equal size n and compute each group's average daily comments. Describe the distribution of these group averages.

What This Part Should Cover

  • Sampling distribution of the sample mean.
  • Mean remains equal to the population mean under random sampling.
  • Variance shrinks roughly by 1/n, and standard error shrinks by 1/sqrt(n).
  • Distribution becomes more normal as n grows if CLT conditions are reasonable.

Part 3 - Compare Summary Statistics

How do the mean, median, and 95th percentile of the sampling distribution compare with those of the original per-user distribution?

What This Part Should Cover

  • Mean of sample means stays near the population mean.
  • Median of sample means approaches the mean as the sampling distribution becomes symmetric.
  • 95th percentile of sample means is much closer to the mean than the original user-level p95.
  • Limitations when data are extremely heavy-tailed or users are not independent.

What a Strong Answer Covers

A strong answer distinguishes individual count distributions from sampling distributions, orders summary statistics correctly for right skew, and uses the CLT to explain why group averages are less variable and more symmetric.

Follow-up Questions

  • What if user comments follow a power-law distribution with extreme outliers?
  • How would excluding zero-comment users change the summary?
  • How would cluster sampling affect the variance of group averages?
View full question
Data Manipulation (SQL/Python)
3

Calculate Response Rate and Compare User Survey Ratings

MediumData Manipulation (SQL/Python)Coding

USERS

user_id | signup_date

10 | 2024-03-20

11 | 2024-04-01

12 | 2024-04-05

​

SURVEYS

survey_id | user_id | sent_at

1 | 10 | 2024-04-01

2 | 11 | 2024-04-02

3 | 12 | 2024-04-05

​

SURVEY_RESPONSES

survey_id | user_id | responded_at | rating

1 | 10 | 2024-04-01 10:02 | 4

3 | 12 | 2024-04-05 12:15 | 5

Scenario

Using Meta’s notification-survey data, write SQL to (a) compute the survey response rate and (b) test whether new users have a higher average survey rating than existing users.

Question

Write a query that returns overall response_rate = #responses / #surveys. State and handle your join choice when surveys lack a response. Write a query that compares mean rating between new users (<30 days since signup) and existing users, controlling aggregation level appropriately.

Hints

Think join type, denominator, NULL handling, aggregation grain, and division-by-zero safeguards.

View full question
4

Analyze Conversation Engagement and Reaction Usage Effectively

MediumData Manipulation (SQL/Python)Coding

messages

+-----------+--------+----------+--------------+---------------------+ | messageid | sender | receiver | has_reaction | timestamp | +-----------+--------+----------+--------------+---------------------+ | 1 | 101 | 202 | 0 | 2023-08-01 10:01:00 | | 2 | 202 | 101 | 1 | 2023-08-01 10:02:10 | | 3 | 303 | 404 | 0 | 2023-08-05 14:11:33 | | 4 | 404 | 303 | 1 | 2023-08-05 14:11:55 | | 5 | 101 | 303 | 0 | 2023-08-07 08:45:12 | +-----------+--------+----------+--------------+---------------------+

Scenario

Messaging platform wants to understand conversation engagement and reaction usage over the last week.

Question

Write SQL to count unique conversations (unordered sender-receiver pairs) that started in the past 7 days. 2. Calculate the percentage of those conversations that contain at least one message with has_reaction = 1. 3. Compute the average number of days from the first message in a conversation to the first reacted message. 4. Suggest a query-friendly metric and analysis to test whether conversations with reactions are more active than those without.

Hints

Define a conversation as all messages between the same two users, regardless of direction. Use MIN(timestamp) and DATEDIFF for timing.

View full question
Machine Learning
5

Develop a Restaurant-Recommendation Engine with Logistic Regression

MediumMachine Learning

You are designing a restaurant recommendation engine for a social app. You need to define the business goal, choose features, justify a modeling approach, and evaluate a logistic-regression model.

Constraints & Assumptions

  • Treat this as a first-version recommender design, not a full deep-learning ranking system.
  • Define the prediction target and label window before choosing features.
  • Avoid leakage from post-impression actions.
  • Include engagement metrics, model metrics, and product guardrails.

Clarifying Questions to Ask

  • What user action should the recommender optimize: click, save, directions, reservation, order, or repeat visit?
  • Where will recommendations appear, and how many restaurants are shown?
  • What data is available on users, restaurants, social graph, location, and context?
  • Is interpretability important for product or business stakeholders?

Part 1 - Define Goal and Metrics

What business goal and engagement metrics would you track for restaurant recommendations?

What This Part Should Cover

  • Goal such as helping users discover relevant restaurants and increasing local engagement or downstream actions.
  • Metrics such as CTR, saves, directions, reservations, orders, repeat usage, retention, hides, and complaints.
  • Guardrails for diversity, quality, fairness, privacy, and over-personalization.

Part 2 - Choose Features

Which behavioral, demographic, social, context, and item features would you include, and why?

What This Part Should Cover

  • User preferences, past restaurant interactions, cuisine affinity, location context, time, price, distance, popularity, restaurant quality, freshness, and social signals.
  • Cold-start features for new users and restaurants.
  • Leakage and privacy checks.

Part 3 - Choose Logistic Regression

Why might logistic regression be appropriate?

What This Part Should Cover

  • Binary outcome modeling, probability scoring, interpretability, speed, calibration, and strong baseline behavior.
  • Feature engineering needed for nonlinearities and interactions.
  • Limitations compared with more expressive ranking models.

Part 4 - Evaluate the Model

How would you evaluate whether the logistic-regression model is accurate and useful?

What This Part Should Cover

  • Offline metrics such as AUC, PR-AUC, log loss, calibration, precision, recall, accuracy, and lift at top K.
  • Online metrics from A/B tests and guardrails.
  • Segment analysis, cold-start evaluation, and selection-bias concerns.

Part 5 - Define Classification Metrics

Define precision, recall, and accuracy, provide their formulas, and state which metric or metrics you would prioritize for this use case.

What This Part Should Cover

  • Correct formulas and interpretation.
  • Why ranking, precision at K, calibration, or downstream conversion may matter more than raw accuracy.
  • Trade-off between showing fewer high-confidence recommendations and discovering broader user interests.

What a Strong Answer Covers

A strong answer frames the recommendation task clearly, uses features available at ranking time, justifies logistic regression as a baseline, evaluates both offline and online impact, and chooses metrics that match a top-K recommendation product.

Follow-up Questions

  • How would you handle restaurants with no historical interactions?
  • What if the model has high accuracy but low click lift online?
  • How would you prevent the model from recommending only popular restaurants?
View full question
6

Determine Features for Effective Hashtag Recommendations

MediumMachine Learning

Hashtag Recommendation System Design

You are designing a hashtag recommendation system for a social-media platform. Given a user composing post content at a specific time, the system should rank and recommend the top-k hashtags.

Constraints & Assumptions

  • Separate candidate generation from ranking.
  • Include user, content, social, temporal, popularity, and safety signals.
  • Address cold start for new users, new posts, and new hashtags.
  • Define how model weights or parameters are learned and validated.

Clarifying Questions to Ask

  • What is the primary objective: hashtag adoption, post engagement, discovery, creator satisfaction, or safety?
  • What content modalities are available: text, image, video, audio, or metadata?
  • Are recommendations shown during composition, after posting, or both?
  • What safety, spam, abuse, or policy constraints apply to hashtags?

Part 1 - Signals and Features

What signals would you collect to recommend hashtags for a given user, content, and time?

What This Part Should Cover

  • Include content similarity, text embeddings, image/video labels, user history, social graph, location, language, time, trending topics, hashtag popularity, engagement, and safety signals.
  • Distinguish candidate-generation features from ranking features.
  • Include freshness and decay for trends.
  • Avoid leakage from future engagement.

Part 2 - Cold Start

How would you handle users or hashtags with unavailable or weak features?

What This Part Should Cover

  • Use content-based retrieval, global or local trends, onboarding interests, similar users, and contextual defaults.
  • For new hashtags, use text semantics, early engagement, creator quality, and safety checks.
  • Explore new items with guardrails.
  • Fall back gracefully when personalization is weak.

Part 3 - Scoring and Learning

How would you combine features into a ranked list and learn weights?

What This Part Should Cover

  • Use a scoring function, learning-to-rank model, logistic model, gradient-boosted trees, neural ranker, or hybrid approach.
  • Train on outcomes such as acceptance, post engagement, downstream discovery, or long-term value.
  • Include negative sampling, calibration, diversity, deduplication, and business rules.
  • Validate offline and online with appropriate metrics.

Follow-up Questions

  • How would you prevent recommending spammy or harmful hashtags?
  • How would you measure recommendation quality if users ignore all suggestions?
  • What if a trending hashtag is popular but irrelevant to the user's post?
View full question
Analytics & Experimentation
7

Identify User Interest in Group Video Calls Using Data

HardAnalytics & Experimentation

You are designing and analyzing a new group video-calling feature for a large social or messaging app. Currently, you mainly have historical one-to-one video call data.

Constraints & Assumptions

  • The feature should create incremental real-time communication, not only shift users from one-to-one calls or messages.
  • Assume access to one-to-one call history, group chat metadata, invite behavior, device/network quality, retention, and experiment infrastructure.
  • Network effects matter: one user's treatment can affect other users in the same social cluster.
  • Participant limits and success metrics should account for product value, call quality, safety, and cost.

Clarifying Questions to Ask

  • Is the product already strong in one-to-one video calls, group chats, or both?
  • Are group audio calls available today?
  • What use cases matter most: family calls, work coordination, creator/community calls, or casual friend groups?
  • Are there hard constraints on participant count, device performance, or bandwidth?

Part 1 - Clarify the Business Goal

What is the business goal of the group video-calling feature?

What This Part Should Cover

  • Primary objective such as meaningful real-time communication, retention, reactivation, or competitive parity.
  • Secondary objectives and guardrails, including quality, reliability, abuse, and infrastructure cost.
  • A clear definition of incremental value.

Part 2 - Identify Interested Users

How would you identify users most interested in group video calls using one-to-one call history, and what additional data would improve the analysis?

What This Part Should Cover

  • Proxies such as frequent callers, repeated calls within group-chat clusters, sequential calls to several contacts, missed coordination, and dense social graphs.
  • Additional data from group chats, surveys, beta signups, device capability, network quality, and current substitutes.
  • Segmentation and scoring that distinguish likely adopters from users who would use any new calling surface.

Part 3 - Decide on Participant Limits

Should the product impose a participant limit, and how would you determine the optimal cap?

What This Part Should Cover

  • Demand distribution by intended group size, call success by size, quality degradation, device constraints, abuse risk, and cost.
  • Staged experiments or rollouts with different caps, if feasible.
  • A rule that covers valuable use cases while protecting reliability and user experience.

Part 4 - Measure Launch Success

Which success metrics would you track after launch, and how would you measure cannibalization versus incremental engagement?

What This Part Should Cover

  • Incremental active group callers, successful group-call sessions, call minutes, repeat use, retention, and invite/join funnel.
  • Cannibalization of one-to-one calls, messaging, and existing group surfaces.
  • Guardrails for dropped calls, join failures, latency, crashes, complaints, and cost.

What a Strong Answer Covers

A strong answer ties business goals, user targeting, participant caps, metric hierarchy, and experiment design together while accounting for network effects and cannibalization.

Follow-up Questions

  • How would you randomize an A/B test for a group feature?
  • If group calls increase total minutes but reduce message activity, how would you decide whether that is good?
  • Which user segment would you invite to a beta first?
View full question
8

Evaluating a 15 % reduction in post‑card height

MediumAnalytics & Experimentation

Evaluating a 15 Percent Reduction in Post-card Height

You own the feed UX for a social app. Designers propose shrinking each post card's height by 15 percent to show more content per scroll, aiming to increase session depth and ad load. After launch, U.S. revenue rises while Thailand's revenue falls.

Design the experiment, choose metrics, and diagnose the divergent geo outcome.

Constraints & Assumptions

  • Keep ranking constant unless the test explicitly changes ranking.
  • Instrument viewport exposure and ad viewability carefully.
  • Measure user experience and revenue together.
  • Diagnose geographic differences before broad rollout.

Clarifying Questions to Ask

  • Which post types, devices, and screen sizes are affected?
  • Does reducing height change creative cropping, text truncation, or ad rendering?
  • Did ad insertion, auction, or ranking change at the same time?
  • Are network conditions, content mix, and ad demand different by country?

Part 1 - Experiment and Metrics

How would you design the experiment and what metrics would you track?

What This Part Should Cover

  • Use user-level randomized A/B testing with treatment reducing card height by 15 percent.
  • Track visible posts per viewport, scroll speed, session depth, dwell time, engagement, hides, reports, ad impressions, ad viewability, CTR, revenue, latency, and retention.
  • Segment by screen size, device, network, country, content type, and user tenure.
  • Include guardrails for readability and accessibility.

Part 2 - Divergent Geo Outcome

After launch, U.S. revenue is up but Thailand is down. What would you do next?

What This Part Should Cover

  • Compare content mix, ad demand, CPM, fill rate, viewability, bandwidth, device mix, localization, and user behavior by geography.
  • Check whether more impressions lowered ad quality or auction prices in Thailand.
  • Examine latency and rendering issues on lower-end devices or slower networks.
  • Consider geo-specific rollout, rollback, or design adjustments.

Follow-up Questions

  • What if engagement rises but retention falls?
  • How would you measure whether content became harder to read?
  • How would you isolate ad-load effects from UX effects?
View full question
Behavioral & Leadership
9

Explore Behavioral Growth and Adaptability in Data Science.

MediumBehavioral & Leadership

Behavioral Deep-Dive: Growth, Agility, Cross-Team Support, and Inclusion

You are in a behavioral and leadership round for a Data Scientist role. The interviewer is assessing growth mindset, adaptability under ambiguity, cross-functional collaboration, and inclusion.

Prepare STAR or STAR-L answers for the following prompts:

  1. Describe a project where you failed or made a mistake. What did you learn, and how did you grow afterward?
  2. Tell me about a time you had to adapt quickly to an ambiguous situation or an extremely tight deadline. What actions did you take?
  3. How have you built trust and relationships with engineering or other teams, especially when there was conflict or differing ideas?
  4. Give an example of how you helped a new or under-represented teammate feel included and supported.

Constraints & Assumptions

  • Use specific examples rather than abstract values.
  • Quantify impact where possible.
  • Own mistakes directly and describe system-level improvements.
  • For inclusion, focus on concrete behaviors and outcomes rather than performative language.

Clarifying Questions to Ask

  • Would you like me to use one extended story or separate examples for each prompt?
  • Should I focus on product analytics, machine learning, experimentation, or cross-functional work?
  • Is it helpful to include what I would do differently now?

What a Strong Answer Covers

  • Clear STAR-L structure with context, task, personal actions, result, and learning.
  • Failure answer that shows accountability, root-cause analysis, corrective action, and changed future behavior.
  • Adaptability answer that shows prioritization, risk management, fast communication, and decision-making under uncertainty.
  • Cross-team trust answer that shows empathy, shared goals, evidence, and conflict resolution.
  • Inclusion answer that shows sponsorship, onboarding support, meeting norms, psychological safety, and measurable improvement for the teammate or team.

Follow-up Questions

  • What did you learn that changed your future process?
  • How did you communicate uncertainty?
  • How did you know trust improved?
  • What would you do differently if you had more time?
View full question
10

Describe Overcoming a Major Challenge in Your Career

MediumBehavioral & Leadership

This is a behavioral deep-dive for a new-grad data scientist role. The interviewer may ask several prompts that test ownership, learning, inclusion, collaboration, feedback, and ability to respond under pressure.

Constraints & Assumptions

  • Use real experiences from internships, research, coursework, projects, clubs, or early-career work.
  • Answer with a concise STAR structure: Situation, Task, Action, Result.
  • Emphasize your specific contribution, decisions, trade-offs, and measurable impact where possible.
  • Avoid generic claims; give concrete context and reflection.

Clarifying Questions to Ask

  • Would you like one detailed example or quick answers across several prompts?
  • Should I focus on a technical project, a team conflict, or a leadership example?
  • How much detail should I provide on the data, tools, and metrics?

Part 1 - Respond Under Pressure

Describe a situation where you had to react very quickly.

What This Part Should Cover

  • A clear time-sensitive problem, the constraint, the decision you made, and how you avoided panic or guesswork.
  • Your specific actions and how you communicated with others.
  • The result and what you learned about operating under pressure.

Part 2 - Learn From Others

Tell us about a skill you learned by observing someone else.

What This Part Should Cover

  • The person or situation you observed, the skill you noticed, and why it mattered.
  • How you practiced or adapted the skill.
  • Evidence that the skill changed your later behavior or results.

Part 3 - Overcome a Major Challenge

Talk about your biggest challenge and how you overcame it.

What This Part Should Cover

  • A meaningful obstacle with stakes, not a minor inconvenience.
  • Your ownership, analysis, trade-offs, help-seeking, and persistence.
  • A measurable or specific outcome and a reflection that shows maturity.

Part 4 - Initiate Change and Include Others

Give an example of a change you initiated and a time you made others feel included.

What This Part Should Cover

  • Why the change or inclusion issue mattered.
  • How you got buy-in without overstepping.
  • How you measured or observed the improvement.

Part 5 - Collaborate and Use Feedback

Describe how you collaborated with stakeholders or your manager, and share an instance when you gave or received impactful feedback.

What This Part Should Cover

  • Stakeholder goals, misalignment, communication choices, and how you reached a decision.
  • Specific feedback, how it changed your behavior, and the resulting impact.
  • Balance between humility and ownership.

What a Strong Answer Covers

A strong answer gives concrete stories, uses STAR without sounding scripted, quantifies impact when possible, and shows self-awareness, collaboration, inclusion, and learning.

Follow-up Questions

  • What would you do differently now?
  • How did you know your action worked?
  • How did your manager or teammate react?
View full question
Coding & Algorithms
11

Optimize Travel Costs and Generate Rotational Symmetric Numbers

MediumCoding & AlgorithmsCoding
Scenario

You are building a travel-search engine that must

  1. show customers the cheapest round-trip they can book if departure and return prices vary by day, and
  2. generate all k-digit numbers that still look the same after a 180° rotation for fraud-detection image checks.
Question

Given two arrays, dep[i] = outbound ticket price on day i and ret[j] = return ticket price on day j, design an algorithm that returns the minimum possible total cost for any valid round-trip (depart before return). Analyze time and space complexity and discuss possible optimizations or alternative solutions. Given an integer k, generate all k-digit numbers that remain identical when rotated 180°. Provide an algorithm, analyze its complexity, and explain how your code handles corner cases.

Hints

Cheapest flight: pre-compute suffix minima or use two-pointer scan. Strobogrammatic: recurse from outer to inner, pairing digits {0,0},{1,1},{6,9},{8,8},{9,6}.

View full question
12

Compute binary-tree diameter via return-only DFS

MediumCoding & AlgorithmsCoding

Given the root of a binary tree, compute its diameter defined as the number of edges on the longest path between any two nodes. Implement a DFS that returns a tuple to its caller: (height_of_subtree, best_diameter_in_subtree). Combine children’s return values at each node to update the best diameter without using any external list, array, or global variable. Requirements: O(n) time, O(h) auxiliary space where h is the tree height. Edge cases: empty tree (diameter = 0), single node (diameter = 0), completely skewed tree. Then answer: (1) Why does accumulating traversal state in a list during DFS inflate space from O(h) to O(n), and under what input shapes does it hurt most? (2) Provide an iterative postorder version using an explicit stack that still achieves O(h) auxiliary space. (3) State and justify the time and space complexities for both versions.

View full question

Ready to practice?

Browse 617+ Meta Data Scientist questions — filter by round, category, and difficulty.

View All Questions

About the Interview Process

What to expect

Meta's Data Scientist, Analytics interview is more product-analytics heavy than the title suggests. You are not walking into a pure modeling loop. This guide breaks down the stages, the question mix, exactly what each round tests, and how to prepare so you spend your prep where it actually moves the needle.

Meta Data Scientist Interview Guide 2026 interview prep framework Data Interview Prep Framework Use the flow below to turn the article into a concrete practice plan. Question metric and grain Data shape joins, filters, nulls Analysis SQL, stats, cases Explain business meaning After each practice rep, write down what broke, then repeat the lane that exposed the gap.

Based on recent candidate reports, the process typically runs in three stages:

  1. A short recruiter screen.
  2. A technical screen that mixes SQL with a product or metrics case.
  3. A final loop with separate interviews for analytical reasoning, statistical execution, and behavioral or leadership topics.

The full loop often spans four to five interviews, with the exact mix depending on team and level. That structure lines up with the question distribution below: across the reported questions on PracHub, the largest bucket is Analytics & Experimentation, followed by Data Manipulation (SQL/Python) and Statistics & Math.
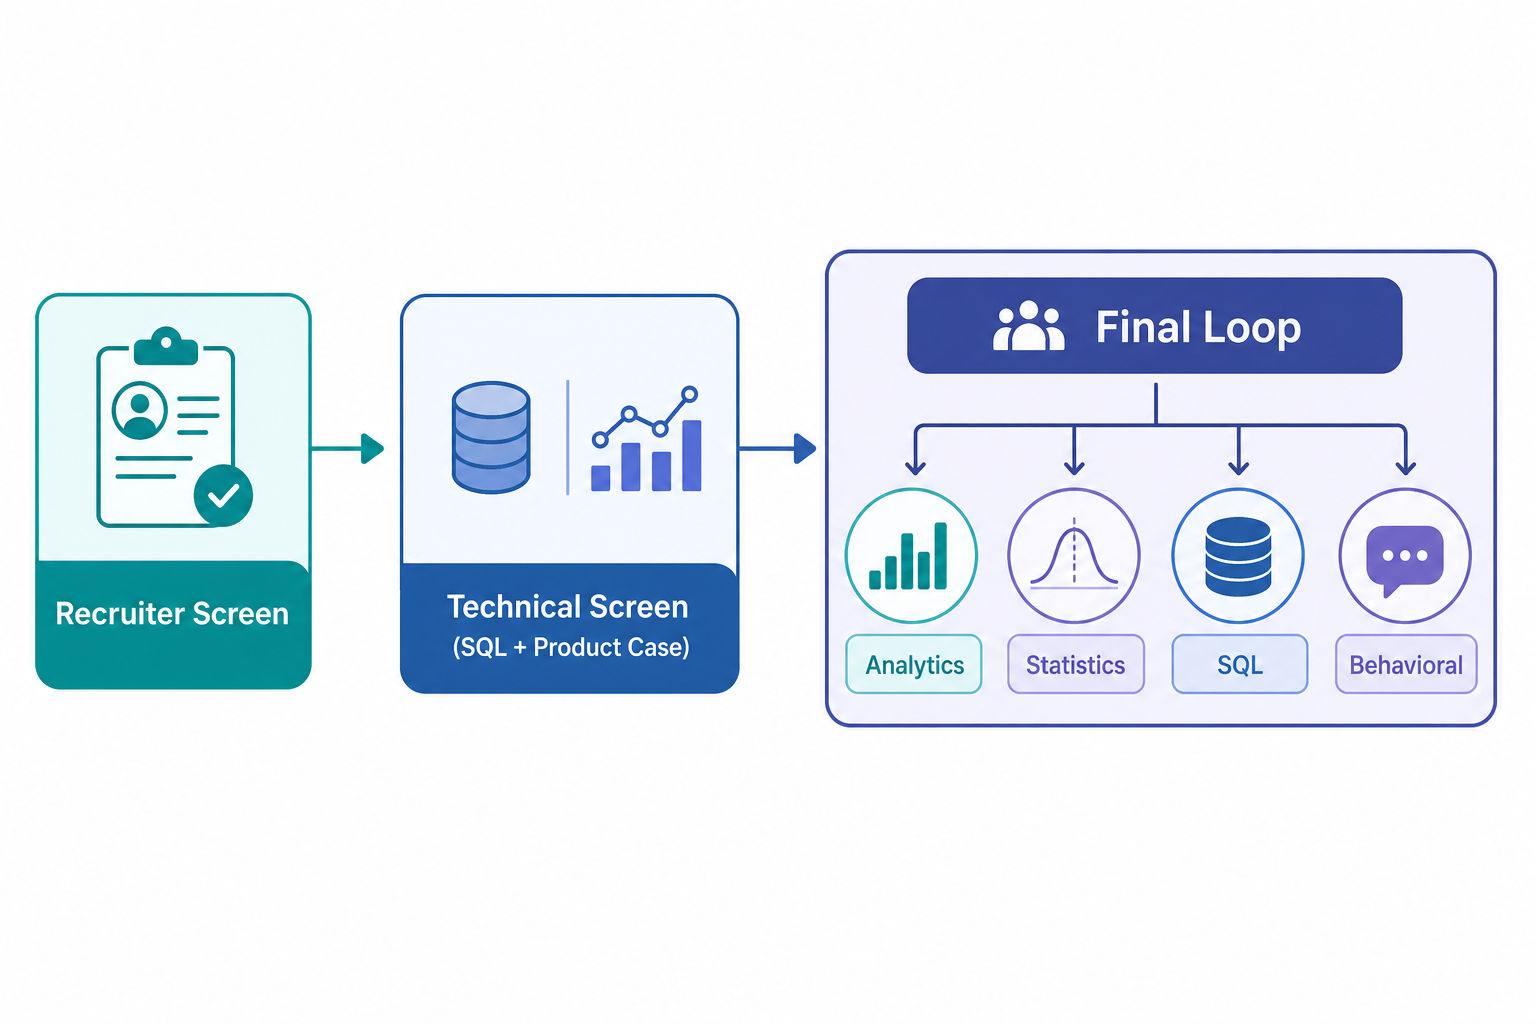
Flowchart of the Meta Data Scientist interview loop from recruiter screen to final loop

What feels distinctive at Meta is how often interviewers want you to make sound product judgments with incomplete information. You might be asked how to measure a feature launch, why engagement dropped, which metric should lead a dashboard, or how to design an experiment when clean randomization is hard. The loop keeps returning to one question: can you translate messy product problems into measurable decisions, then explain the tradeoffs clearly to product managers and engineers?

The category counts reinforce this. Behavioral & Leadership carries real weight (more than you'd expect for a technical role) because Meta wants people who can influence without hiding behind analysis. Machine Learning appears but is not the center of gravity. Coding & Algorithms is barely present, so preparing as if this were a software-engineering interview will send you in the wrong direction. If your background is more SWE-flavored, the Meta software engineer guide covers that loop instead.

The interview process

The round names below describe a typical loop. The exact sequence varies by team and level, so treat them as a guide rather than a fixed script.

Recruiter screen

A conversation with your recruiter, usually 20–30 minutes. You'll cover your background, team interests, location constraints, and why Meta. It's light technically, but recruiters often probe whether your experience genuinely reads as product analytics, experimentation, or decision support rather than offline research. Expect mostly Behavioral & Leadership topics plus some high-level Analytics & Experimentation discussion.

Technical screen

Roughly 45 minutes, and more targeted than many candidates expect. Reports describe a split between SQL and a product-analytics case, sometimes with conversational A/B testing woven in. You're evaluated on query fluency, metric choice, structured reasoning, and how quickly you move from a vague product prompt to a clean analytical plan. Main categories: Data Manipulation (SQL/Python), Analytics & Experimentation, and some Statistics & Math.

Final loop (onsite)

Often run virtually, this is the round that decides most outcomes. Reports commonly describe three or four interviews: separate sessions for analytical reasoning, statistical execution, and behavioral or leadership, plus sometimes an added SQL-focused interview depending on team and level. These sessions are less about memorized formulas and more about whether you can reason through product ambiguity, defend assumptions, and communicate like a partner to product and engineering. Main categories: Analytics & Experimentation, Statistics & Math, Behavioral & Leadership, plus enough Data Manipulation to confirm you can execute.

The table below maps each round to what's tested and how to prepare for it.

RoundLength (typical)Primary focusHighest-leverage prep
Recruiter screen20–30 minFit, background, motivationA crisp "why Meta / why analytics" story; 2–3 impact examples
Technical screen~45 minSQL + product caseLive SQL fluency; a metric-definition framework
Analytical reasoning~45 minProduct sense, metricsPractice cases on real Meta surfaces
Statistical execution~45 minExperiment design, inferenceA/B testing depth, reasoning aloud through tradeoffs
Behavioral / leadership~45 minInfluence, conflict, impactSTAR stories where your analysis changed a decision

What they test

At its core, Meta is checking whether you can think like a product owner who happens to have data access. Four areas carry most of the weight.
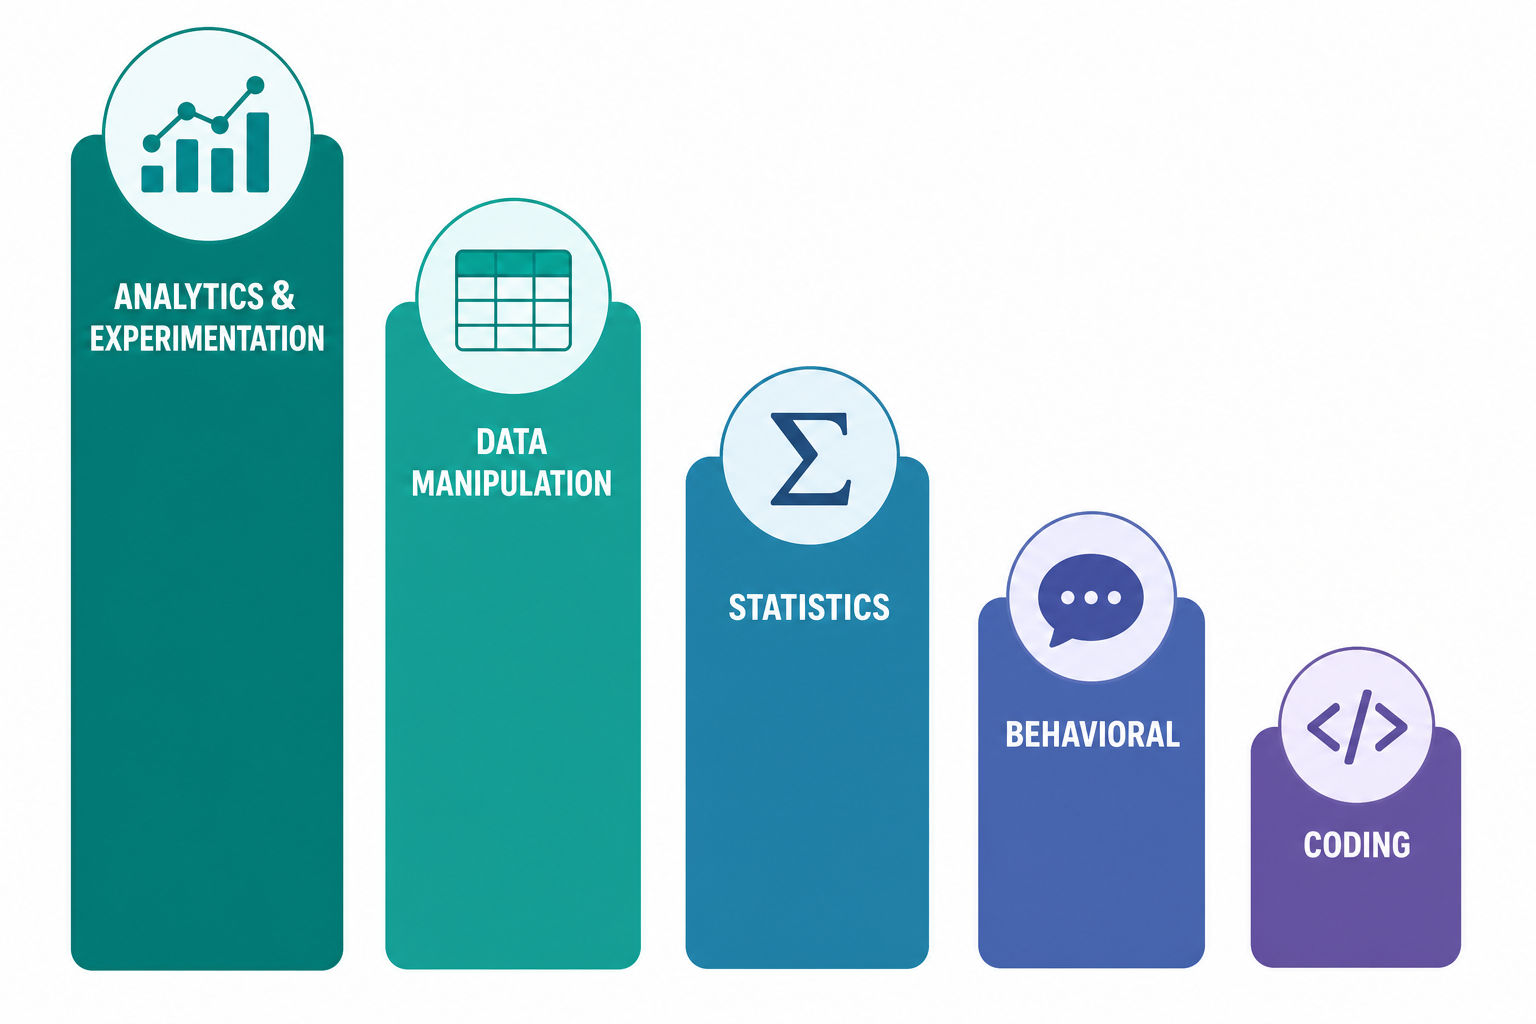
Diagram of the four skill areas weighted in a Meta data scientist interview

Analytics & Experimentation (the largest category)

Expect questions on north-star and guardrail metrics, launch evaluation, diagnosing metric drops, funnel tradeoffs, retention versus engagement, and experiment design under real-world constraints. A typical prompt is not "what is the formula for X" but something like "Instagram comments are down 8% this week. What would you look at first, and how would you know if it matters?" Interviewers want a framework that moves from metric definition to segmentation to hypothesis generation to a next action.

When two metrics move in opposite directions, naming the tradeoff explicitly is what separates strong answers from average ones. PracHub's walkthrough on what to do when one metric goes up and another goes down is a good drill for this exact pattern.

Data Manipulation (SQL / Python)

Expect joins, aggregations, conditional logic, CTEs, window functions, time-based analysis, and event-level reasoning. The SQL is rarely algorithmically tricky; it's business-data tricky. You need to read a table setup, infer the grain correctly, avoid double counting, and explain your logic while writing. Python can appear, but SQL matters more for this role. Writing a correct query isn't enough at Meta if you can't say what question it answers.

Window functions show up constantly in event-level analysis. If ROW_NUMBER, LAG, and running totals aren't second nature, work through the SQL window functions guide and the broader SQL vs Python in data science interviews breakdown before your screen.

Statistics & Math

This is where Meta checks that your product instincts rest on real quantitative judgment. Be comfortable with A/B testing fundamentals, p-values, confidence intervals, power and sample-size logic, bias and variance, selection effects, metric sensitivity, and probability questions that test intuition over textbook recitation. In the statistical-execution round, candidates are often asked to reason aloud through why a test result might mislead, what happens when assumptions break, or how to interpret noisy movement in a key metric.

Two failure modes come up a lot in reports: selection bias that quietly distorts a result, and p-hacking that manufactures significance. Knowing how to spot both is worth more than memorizing formulas. PracHub's primers on selection bias and the A/B testing experimentation interview cover the reasoning interviewers want to hear. For a sense of how question frequency breaks down across the field, see what tech interview statistics get asked most.

Behavioral & Leadership

This is a substantive part of the loop, not a culture screen tacked on at the end. Meta tends to probe how you handle disagreement with PMs or engineers, how you prioritize when multiple teams want your time, how you influence roadmaps without formal authority, and what decisions you've actually changed with your work.

Use a tight STAR structure and lead with the decision your work drove. For instance:

Example answer (STAR): Situation: A launch was about to roll out to all users based on a positive top-line metric. Task: I was asked to confirm the launch was net-positive before the wider rollout. Action: I segmented the result and found the lift was concentrated in one cohort while a smaller, high-value cohort showed worse retention. I brought the segmented view to the PM and proposed a staged rollout with a guardrail. Result: We changed the rollout criteria, protected the at-risk cohort, and still shipped to the segments that benefited.

That framing lands far better than "I built a dashboard and waited for people to notice." For more on the STAR pattern across companies, see the 20 common Meta behavioral questions.
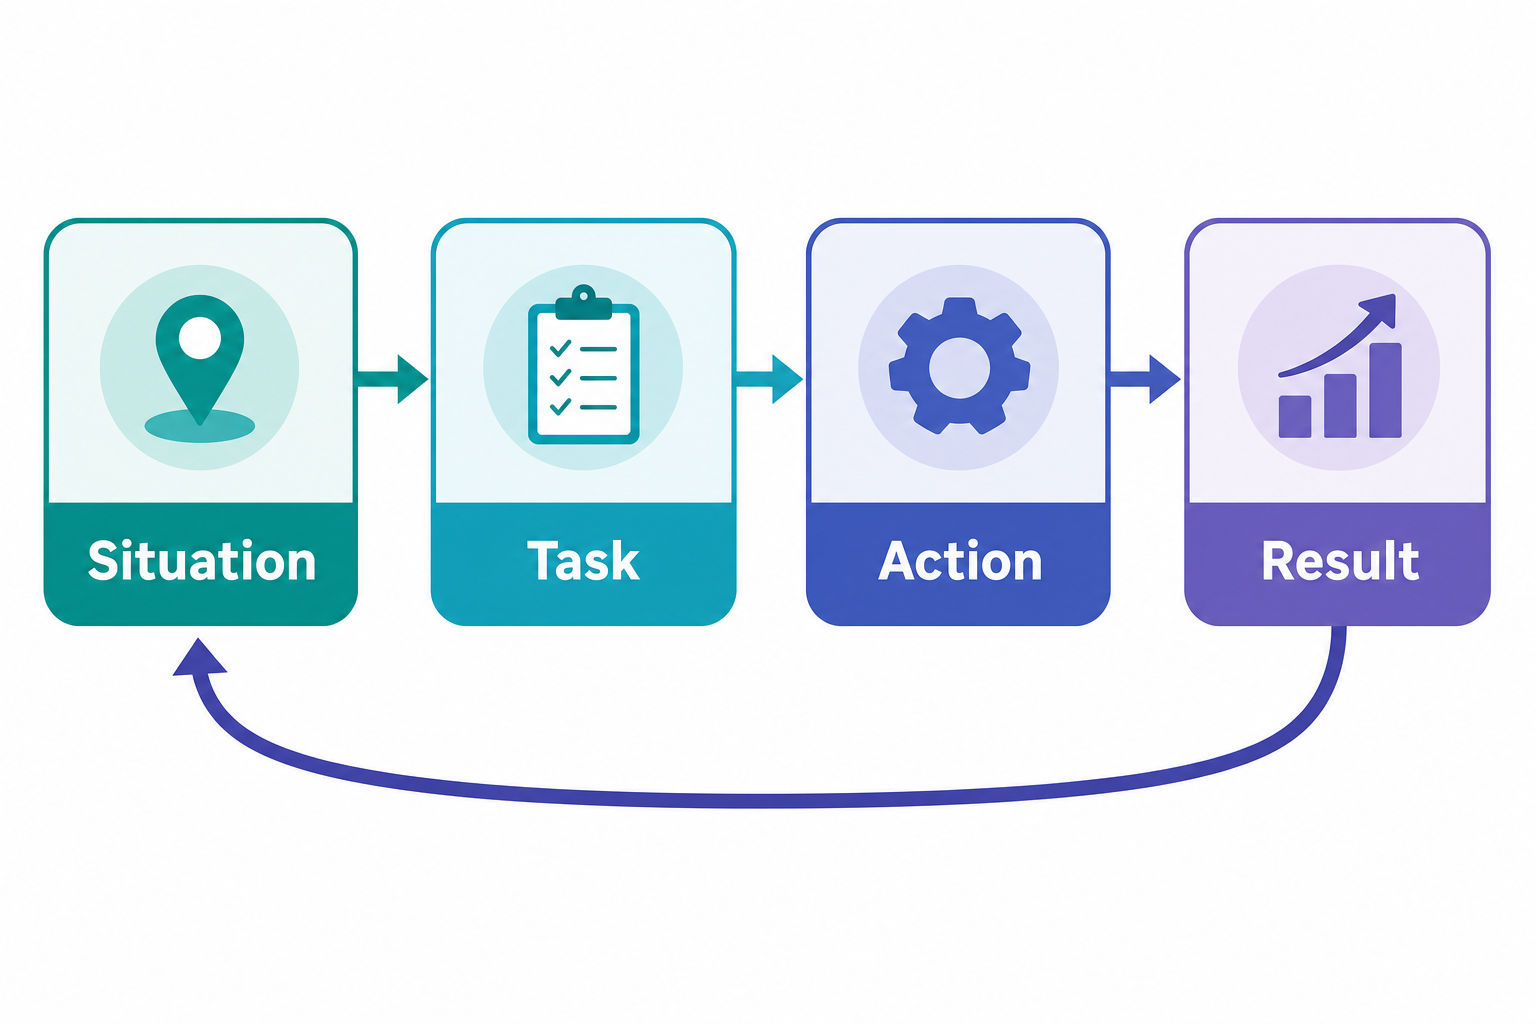
Diagram of the STAR method as a four-step loop for behavioral answers

Machine Learning (secondary)

ML usually appears in a practical analytics context unless the team is explicitly ML-heavy: model evaluation, precision and recall, feature tradeoffs, offline versus online metrics, experimentation around ranking or recommendation changes, and how to measure a model's impact on user behavior. For most Meta data-science roles, this sits behind experimentation and product reasoning. Coding & Algorithms is the smallest category. Don't ignore it, but don't grind hard graph problems either; basic scripting fluency is what's expected.

How to prepare and stand out

  • Practice product cases on real Meta surfaces. Pick Instagram, Facebook, WhatsApp, Reels, Ads, Groups, or Meta Verified, then define one primary metric, two guardrails, the likely segments, and one experiment.
  • Narrate grain first in SQL. Say what each row represents before you write anything. Interviewers care a lot about whether you avoid silent counting mistakes.
  • Treat every metric question as a tradeoff question. If you recommend engagement, mention quality. If you recommend growth, mention spam or integrity. Meta products are full of metric tension, and strong answers reflect that.
  • Show depth on experiments. Talk about implementation risk, contamination, novelty effects, and why short-term lifts can hurt long-term retention. That reads much closer to real Meta decision-making than reciting generic A/B testing definitions.
  • Bring impact stories where your analysis changed a product decision. "I built a dashboard" is weak. "I showed the launch hurt creator retention in one segment, so we changed the rollout criteria" is the kind of story that lands.
  • Be concise in behavioral rounds. Give context fast, name the conflict, explain your decision, and close with a measurable outcome. Direct communication is rewarded.
  • Lean on cross-functional examples. If you've worked with engineers or PMs under deadline pressure, use those stories. Reports consistently point to leadership and cross-functional influence as a real part of the loop, not a formality.
  • Keep ML answers product-facing. Explain how you'd evaluate whether a ranking or recommendation change improved user experience, not just whether offline AUC went up.

Strong vs weak answers at a glance

DimensionWeaker answerStronger answer
Metric drop"I'd check the data""I'd confirm it's real, segment by surface and cohort, then form a ranked hypothesis list"
SQLJumps straight to writingStates the table grain, then writes, then explains what the query answers
Experiment"Run an A/B test"Names the unit of randomization, guardrails, novelty/contamination risk, and the decision rule
Behavioral"I built a dashboard""My analysis changed the rollout decision; here's the measurable outcome"
Metric choicePicks one metricPicks a primary metric and names the guardrail it could harm

Practice with real questions

The fastest way to calibrate is to work through real reported questions for this exact role. Browse Meta interview questions, filter to data scientist questions, or compare loops against the Google Data Scientist guide and other interview guides. For broad practice across categories, the full question bank is the place to drill.

How to Use This Page as a Prep Plan

Do not treat this as passive reading. Convert the ideas in this page into a short weekly loop: learn one idea, practice it under interview conditions, then write down what changed. That is the fastest way to turn advice into visible interview behavior.

Prep areaWhat you need to provePractice artifact
Metric framingDefine the unit, window, and denominator.One clear metric contract.
SQL executionUse readable CTEs and test row counts.A query with checks after each join.
StatisticsConnect methods to decision risk.Assumptions, confidence, and caveats.
CommunicationTurn findings into a recommendation.One concise business interpretation.

For Meta Data Scientist Interview Guide 2026, the strongest candidates usually do three things well: they make their assumptions explicit, they use concrete examples instead of vague claims, and they review mistakes quickly enough that the next practice rep is better than the last one.

Video Walkthrough

This verified YouTube video gives a second pass on the same preparation area. Use it after reading the guide, then come back and turn the advice into a practice artifact.

FAQ

How many interview rounds does the Meta Data Scientist loop have?

Most candidates report three stages: a recruiter screen, a technical screen, and a final loop. The final loop itself usually contains three or four separate interviews (analytical reasoning, statistical execution, behavioral/leadership, and sometimes an added SQL session). The exact count varies by team and level.

Is the Meta Data Scientist role about machine learning or product analytics?

For the Data Scientist, Analytics track it is primarily product analytics and experimentation. Machine learning appears mostly in a practical, decision-focused way (model evaluation, online vs offline metrics) and is not the center of the loop unless the team is explicitly ML-heavy.

How much SQL do I need for the Meta Data Scientist interview?

Enough to handle joins, aggregations, conditional logic, CTEs, and window functions fluently while explaining your reasoning. The SQL is business-data tricky rather than algorithmically tricky, so the bar is correct grain, no double counting, and clear narration, not exotic syntax.

How important is the behavioral round for a data science role?

More important than candidates expect. Behavioral and cross-functional influence carry real weight because Meta wants people who can change decisions and align stakeholders, not just produce analysis. Prepare STAR stories where your work directly changed a product decision.

How should I answer a "why did this metric drop?" question?

Start by confirming the drop is real (instrumentation, seasonality, reporting window), then segment by surface, platform, and cohort, generate a ranked list of hypotheses, and propose a concrete next action. Interviewers grade the structure and the tradeoff awareness more than a single "right" answer.

How long should I prepare for the Meta Data Scientist interview?

It depends on your starting point, but most candidates benefit from a few focused weeks: product-case reps on real Meta surfaces, live SQL practice, and a polished set of behavioral stories. Spreading practice across the four core areas beats grinding any single one.

Key takeaways

  • Prepare for product analytics and experimentation first, statistics second, and SQL execution as table stakes, not for an algorithms grind.
  • Strong answers translate ambiguous product problems into measurable decisions and name the tradeoffs out loud.
  • Behavioral and cross-functional influence carry real weight; have impact stories ready where your work changed a decision.

Frequently Asked Questions

Pretty hard, but not impossible if you prepare the right way. The bar feels high because Meta looks for clear thinking, strong stats basics, solid product sense, and the ability to explain tradeoffs fast. It is not just a coding screen dressed up as data science. You need to reason through experiments, metrics, and messy business questions. What makes it tough is the pace and the expectation that your answers sound practical, not academic. If you have worked on product analytics before, it feels much more manageable.

The process usually starts with a recruiter chat, then a phone or video screen. After that, the main loop often includes SQL, statistics or experimentation, product sense, and behavioral or past-project discussions. Some candidates also get analytical case questions tied to product metrics and decision-making. The exact mix can vary by team, especially between product-focused and more technical data science roles. In my experience, the interviews are less about fancy theory and more about whether you can solve realistic product problems in a structured way.

For most people, four to eight weeks is a good range if you already use SQL, statistics, and product analytics at work. If you are rusty, give yourself closer to two or three months. I would spend the first part tightening SQL and experiment basics, then shift into mock interviews and timed practice. The biggest jump comes from saying answers out loud, not just reviewing notes. Meta interviews reward speed and structure, so preparation should feel active. Passive studying helps, but interview-style repetition helps a lot more.

The biggest ones are SQL, experiment design, hypothesis testing, metrics, product sense, and communication. You should be comfortable defining success metrics, spotting metric flaws, thinking about causality, and explaining how you would make a decision with imperfect data. Expect questions about A/B tests, bias, segmentation, tradeoffs, and why a metric moved. Basic probability and statistics matter more than obscure math. Past project storytelling matters too. They want to hear how you framed a problem, chose an approach, handled ambiguity, and influenced a product or business decision.

The biggest mistakes are giving vague answers, jumping into analysis without clarifying the goal, and treating product questions like textbook stats questions. A lot of people also overcomplicate SQL or forget edge cases. Another common problem is naming metrics without explaining why they matter or what could distort them. In behavioral rounds, weak candidates sound passive and cannot explain their personal impact. I also saw people rush through assumptions instead of stating them clearly. At Meta, structured thinking and clean communication can save an average answer, while rambling can sink a good one.

MetaData Scientistinterview guideinterview preparationMeta interview
Editorial prep
Meta Data Scientist Interview Prep
Concept walkthroughs, worked examples, and the real questions.

Related Interview Guides

Intuit

Intuit Data Scientist Interview Guide 2026

This guide covers the rounds and question themes in Intuit data scientist interviews, detailing skills and concepts such as metric and grain......

5 min readData Scientist
Snapchat

Snapchat Data Scientist Interview Guide 2026

This guide covers the Snapchat Data Scientist interview process for 2026, detailing stages (recruiter screen, technical phone screen, virtual final......

6 min readData Scientist
Thumbtack

Thumbtack Data Scientist Interview Guide 2026

This interview guide covers Thumbtack Data Scientist interview topics including SQL, statistics, product and marketplace thinking, experimentation......

5 min readData Scientist
Two Sigma

Two Sigma Data Scientist Interview Guide 2026

This guide covers the Two Sigma 2026 Data Scientist interview process, detailing coding assessments, SQL fundamentals, statistics, applied modeling......

5 min readData Scientist
PracHub

Master your tech interviews with 8,500+ real questions from top companies.

Product

  • Questions
  • Learning Tracks
  • Interview Guides
  • Resources
  • Premium
  • For Universities

Browse

  • By Company
  • By Role
  • By Category
  • Topic Hubs
  • SQL Questions
  • AI Coding Questions
  • Compare Platforms
  • Discord Community

Support

  • support@prachub.com
  • (916) 541-4762

Legal

  • Privacy Policy
  • Terms of Service
  • About Us

© 2026 PracHub. All rights reserved.