DoorDash Experimentation, Diagnostic Questions & Marketplace Metrics
Asked of: Product Manager
Last updated
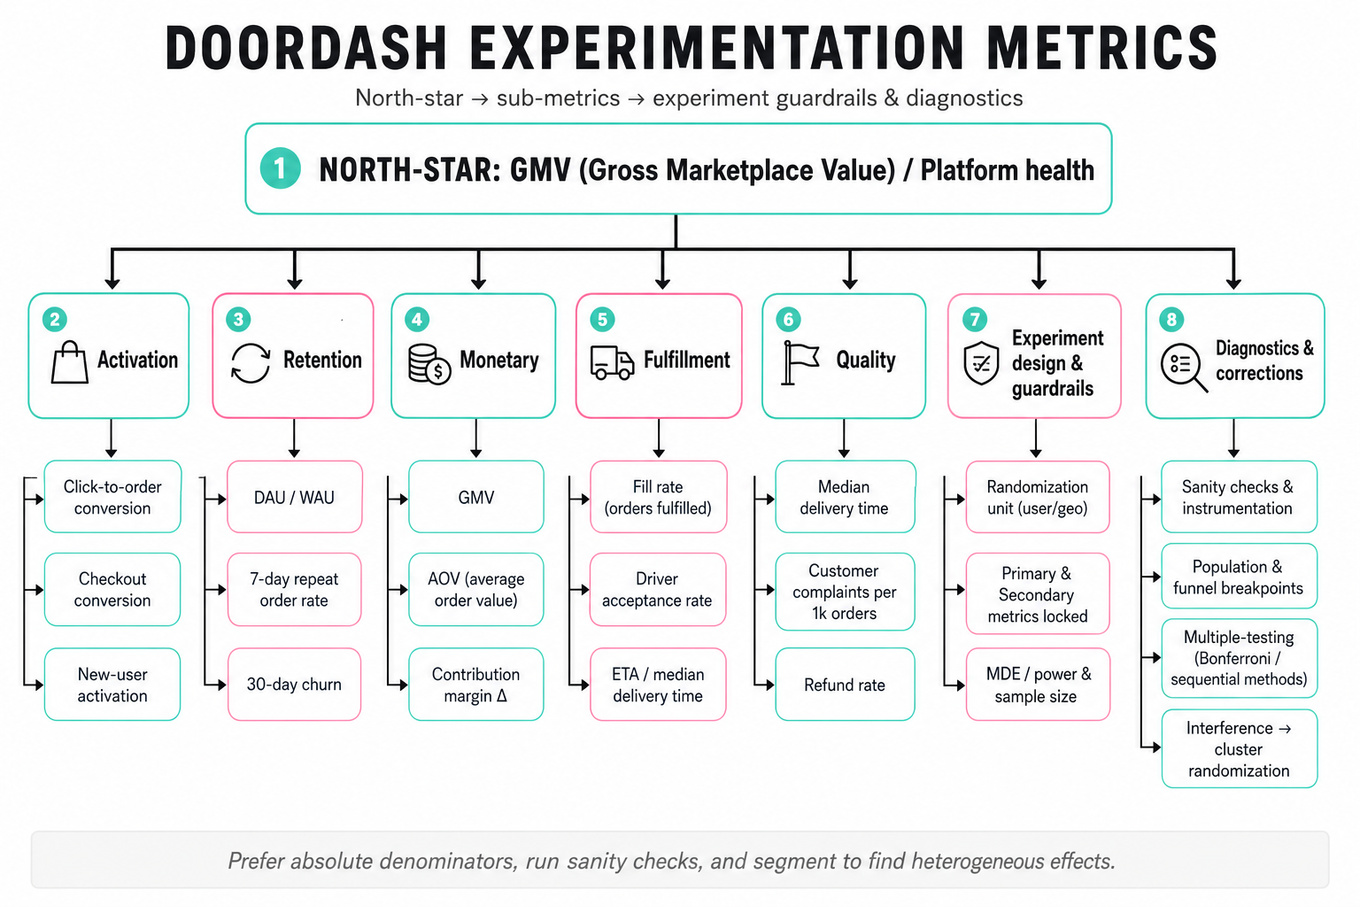
What's being tested
Interviewers probe your ability to reason about experimentation in a two-sided marketplace: defining robust metrics, diagnosing unexpected metric moves, and making pragmatic product decisions that balance short-term signals with cross-side impacts. DoorDash cares because experiments can improve consumer conversion, merchant health, and driver reliability simultaneously—PMs must choose which metric wins, craft guardrails, and decide rollout/rollback using business judgment.
Core knowledge
-
A/B test design basics: randomization unit, treatment window, and sample size; define Primary and Secondary metrics before running and lock analysis plan to avoid p-hacking.
-
Minimum Detectable Effect (MDE) and power: sample size approx. ; inflating MDE reduces cost but risks missing meaningful changes.
-
Metric taxonomy: use hierarchy—
Activation(first-order conversion),Retention(DAU, repeat orders),Monetary(GMV,AOV),Fulfillment(fill rate, acceptance rate), andQuality(delivery time, customer complaints). -
Marketplace levers and cross-side coupling: changes to drivers (pay or routing) affect
fill rateandETA; changes to UI affect consumer conversion and merchant order volume—always model both sides. -
Ratio vs absolute metrics: prefer absolute denominators when possible (orders difference) because ratios can hide base-rate shifts; show both per-user and absolute impact for business context.
-
Sanity checks & instrumentation: verify treatment assignment, event counts, and time-series continuity; confirm no skew in device, geography, or time-of-day assignment.
-
Heterogeneous treatment effects: segment by supply density, zip code, time-window, or customer LTV; small overall lift can hide large regional harms.
-
Multiple testing & sequential analysis: apply corrections (
Bonferroni) or sequential methods (alpha spending, O’Brien–Fleming) when running many metrics or interim checks. -
Interference and network effects: recognize violation of SUTVA in marketplaces; consider cluster/geo randomization when treatments affect local supply-demand balance.
-
Diagnostics checklist for metric shift: 1) data validity, 2) instrumentation drift, 3) population change, 4) funnel breakpoints, 5) cross-side metrics, 6) external events.
-
Business decision criteria: quantify impact in dollars (e.g., ΔGMV, Δcontribution margin), consider lead/lag effects, and apply rollout rules (ramp thresholds, stop-loss).
-
Guardrails and launch plan: pre-specify rollback thresholds on safety-critical metrics (e.g., >3% increase in late deliveries) and phased rollout with monitoring dashboards and on-call escalation.
Worked example — "Orders decreased after homepage recommender change — diagnose and decide whether to rollback"
Frame by clarifying: ask the unit of randomization, treatment percent, experiment duration, and primary metric definition (orders per active user vs. total orders). Then outline three pillars: 1) validate data (treatment assignment, event counts), 2) segment funnel (impressions → clicks → conversions) to localize drop, 3) cross-side checks (merchant cancellations, driver ETAs, regional supply). A strong PM would run a quick sanity dashboard: impression volume unchanged? CTR down? If exposure shifted to low-converting users, that's targeting error; if CTR down but conversion rate after click unchanged, the recommender ranked less relevant items. Tradeoff to flag: short-term orders vs. improved long-term relevance—do we rollback immediately or pause and iterate? Recommend immediate partial rollback if absolute orders drop > business stop-loss or regional hotspots show extreme declines; otherwise hold and run a retrain/variant. Close with next steps: collect qualitative signals (merchant ops, support tickets), run targeted follow-up experiments (different ranking weights), and recommend guardrail thresholds for future recommender launches.
A second angle — "A driver-incentive experiment increases on-time delivery but raises per-order cost"
Apply same concept but different constraints: first quantify tradeoffs in margin terms (Δon-time % → estimated Δcustomer retention → LTV uplift) versus incremental cost per order; compute breakeven LTV increase required for net-positive ROI. Diagnostics focus on supply-side segmentation (which regions/drivers responded) and temporal effects (does incentive cause long-term behavioral change or only temporary spikes?). Important pivot: consider shifting from blanket incentives to targeted micro-incentives where ROI is positive, or alter incentive structure (per-acceptance vs. per-completion) to reduce gaming. The framing changes from consumer funnel to supplier economics, but the experimental rigor—pre-specified metrics, segmentation, guardrails, and rollout rules—remains identical.
Common pitfalls
Pitfall: Confusing statistical significance with business significance.
Many candidates celebrate a low p-value without converting percentage lift into absolute orders or dollars; always report both relative and absolute impact and margin implications.
Pitfall: Treating marketplace as independent sides.
A tempting answer isolates consumer metrics; better answers model supply-demand coupling and show how a consumer uplift could degrade merchant or driver experience, eroding long-term value.
Pitfall: Skipping instrumentation verification.
Rushing to interpret results without confirming event integrity or randomization balance can lead to costly wrong decisions; include a quick instrumentation sanity check in every diagnosis.
Connections
This area commonly pivots to causal inference (DS methods for heterogeneous effects), recommender evaluation (offline metrics vs. online impact), and operations/driver-dispatch tradeoffs—expect follow-ups that ask for deeper modeling or operational controls.
Further reading
- [Online Controlled Experiments at Large Scale — Kohavi et al.] — practical lessons from large-scale A/B testing at
Microsoft/Amazon, useful guardrails and pitfalls.
Related concepts
- DoorDash Three-Sided Marketplace Segmentation and Diagnostics
- DoorDash Three-Sided Marketplace Segmentation
- DoorDash Growth Loops, Monetization, and Unit Economics
- DoorDash Monetization, Unit Economics, and Trade-offs
- DoorDash Marketplace Segmentation, Growth Loops, and Monetization
- Marketplace Metric FrameworksAnalytics & Experimentation