Feed And News Feed Analytics
Asked of: Data Scientist
Last updated
What's being tested
Meta feed analytics tests whether a Data Scientist can reason about ranking changes, content mixes, ads, and engagement with both statistical rigor and product judgment. Interviewers probe whether you can define metrics like CTR, retention, sessions_per_user, negative_feedback_rate, and “socialness,” then separate causal impact from selection bias in a personalized feed. You are expected to design experiments, diagnose metric movements, evaluate recommender quality, and write analysis-ready SQL logic without drifting into data pipeline or serving-infrastructure design. Meta cares because small ranking or inventory changes can affect billions of impressions, user well-being, creator distribution, and ad revenue simultaneously.
Core knowledge
-
Feed ranking is a multi-objective recommendation problem: candidate posts are scored by predicted engagement, relationship strength, freshness, integrity risk, and value proxies. A DS should focus on metric definitions, offline/online evaluation, calibration, segment effects, and whether ranking changes improve long-term user outcomes.
-
Connected vs. unconnected content requires careful causal framing. Friend posts are not randomly assigned; users with more friends, different activity levels, or different interests see different inventory. A naïve comparison of reactions per impression between friend and unconnected posts confounds content type with user, session, position, and availability.
-
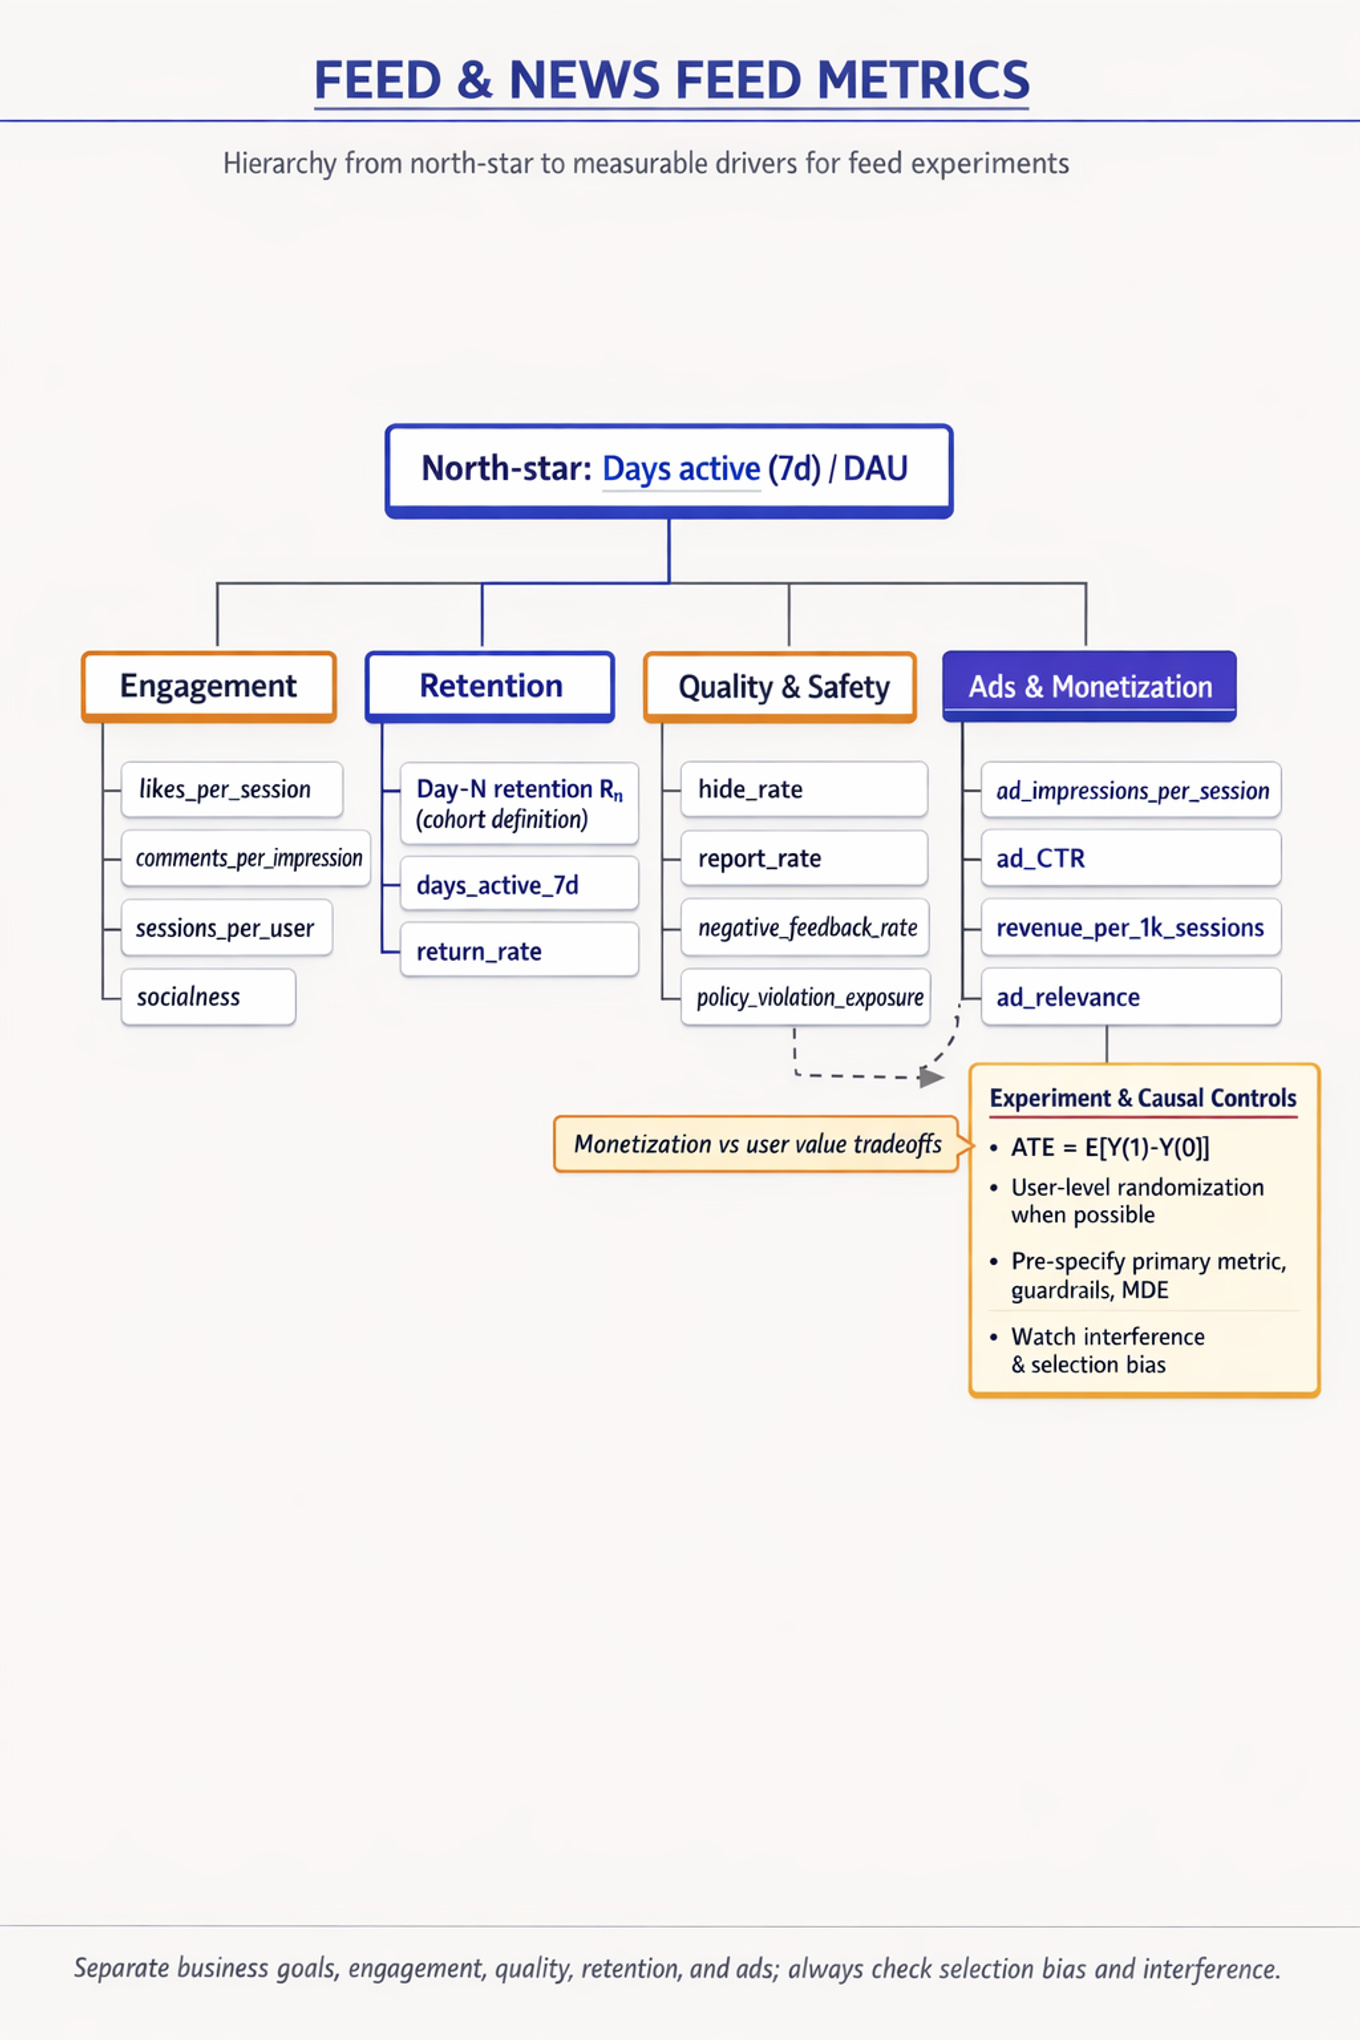
Randomized experiments are the default for feed changes. Define treatment at the user level when possible, estimate , and pre-specify primary metrics, guardrails, minimum detectable effect, ramp plan, and launch criteria. For feed, watch interference: one user’s treatment can affect friends’ posting, comments, or notifications.
-
Metric hierarchy should separate business goals, user value, and health guardrails. Examples: primary
DAUordays_active_7d; engagementlikes_per_session,comments_per_impression; qualityhide_rate,report_rate; adsad_impressions_per_session,ad_CTR,revenue_per_1k_sessions; integritypolicy_violation_exposure. -
Retention metrics must define cohort, exposure, and denominator precisely. Day-N retention is often Avoid conditioning on post-treatment behavior, such as “users who clicked,” unless the estimand is explicitly clicker retention.
-
Ad frequency analysis usually operates at session or user-day level. Useful measures include
ads_per_session,ad_impressions / feed_impressions,ad_load,unique_ads_seen, and frequency caps by advertiser or campaign. Always segment by tenure, country, device, session length, and feed position because averages hide saturation. -
Position bias matters for feed analytics. Items near the top receive more attention independent of quality. For observational analyses, control for
position_bin, session depth, user fixed effects, or use methods like inverse propensity weighting when valid propensities are available: -
User fixed effects help compare outcomes within the same user across conditions or content types. In regression form: where absorbs stable user preferences. This reduces, but does not eliminate, bias from time-varying confounders and ranking selection.
-
CUPED and covariate adjustment improve experiment sensitivity. Use pre-period activity, historical engagement, or baseline retention as covariates when they are unaffected by treatment. The adjusted outcome is often reducing variance without changing the estimand under proper randomization.
-
Heterogeneous treatment effects are central in personalized feed. A change that improves average
time_spentmay hurt new users, low-friend-count users, teens, or users in low-inventory markets. Always inspect segments by tenure, friend graph size, creator-following behavior, country, platform, and baseline engagement. -
Recommender evaluation combines offline and online evidence. Offline metrics like
AUC,log_loss,NDCG@K, and calibration curves test prediction quality, but online metrics determine product impact. A model with betterAUCcan harm feed if it over-optimizes clickbait, narrows diversity, or shifts inventory toward low-value content. -
SQL analytics should preserve the unit of analysis. For feed questions, decide whether rows represent impressions, posts, sessions, users, or user-days before joining. Use
COUNT(DISTINCT ...),ROW_NUMBER(),DATE_TRUNC, window functions, and left joins carefully to avoid double-counting clicks, reactions, or users.
Worked example
For Design experiment for unconnected content in feed, a strong candidate would first clarify the product change: are we increasing the share of unconnected posts, changing their ranker score, or introducing a new candidate source? They would also ask whether the goal is short-term engagement, long-term retention, discovery, creator growth, or a “socialness” constraint that protects friend content. The answer should be organized around four pillars: metric definition, experiment design, bias/interference risks, and decision criteria.
A good framing is: “I would randomize eligible users into control and treatment, where treatment receives a higher unconnected-content quota or score multiplier, then measure user-level outcomes over at least one full weekly cycle.” Primary metrics might include days_active_7d, sessions_per_user, and meaningful engagement such as comments or saves; guardrails should include hide_rate, report_rate, friend-content impressions, and downstream friend interactions. The candidate should explicitly define “socialness,” for example the share of impressions or interactions involving friends, close ties, groups, or reciprocal conversations, rather than treating all reactions as equal.
One tradeoff to flag is that unconnected content may increase immediate CTR but reduce friend interaction or long-term belonging, so a launch should not rely only on impression-level engagement. The candidate should mention possible spillovers: if users engage less with friends’ posts, those friends may receive fewer comments and become less active. They should close by saying that, with more time, they would analyze heterogeneous effects by friend graph size, new-user status, country, and baseline feed satisfaction, plus run a longer holdout to test retention and ecosystem effects.
A second angle
For Compute feed ad frequency and retention in SQL, the same concept shifts from causal experiment design to measurement precision. The key is not just writing aggregations, but selecting the correct analytical unit: session-level ad frequency, impression-level CTR, and user-cohort-level retention answer different questions. A strong candidate would compute ad impressions per session, join impressions to clicks without duplicating rows, bin feed positions to estimate how CTR changes with depth, and then connect exposure cohorts to later activity. The causal concern remains: users who see more ads may simply have longer sessions, so retention comparisons should adjust for baseline activity or use experiment assignment if available. The best answer combines clean SQL logic with a caveat about interpreting frequency-retention correlations.
Common pitfalls
Pitfall: Treating observational engagement differences as proof of content quality.
A tempting answer is “friend posts outperform unconnected posts because they have higher reaction rates.” That ignores selection: friend posts may appear higher in the feed, be shown to users with stronger intent, or have different notification effects. A stronger answer says the comparison is descriptive unless randomized, matched, or adjusted with credible controls such as user fixed effects, position bins, and pre-period activity.
Pitfall: Optimizing one metric without a feed-level metric hierarchy.
Candidates often over-index on CTR, likes, or time_spent because those are easy to measure. Meta-style feed decisions require tradeoffs: short-term engagement, retention, meaningful social interactions, ads value, creator distribution, and integrity guardrails can move in different directions. State a primary metric, name guardrails, and explain what metric movements would block launch.
Pitfall: Staying too abstract when SQL or metric definitions are required.
Saying “I would measure retention and engagement” is not enough. Define the denominator, time window, attribution rule, and grain: for example, “7-day retention among users exposed on day 0, measured as any feed session on day 7, aggregated at user level.” Interviewers reward candidates who turn ambiguous product language into computable metrics.
Connections
Interviewers may pivot from feed analytics into experimentation design, causal inference, ranking evaluation, ads measurement, or SQL cohort analysis. They may also ask about recommender metrics such as NDCG@K, calibration, diversity, novelty, and long-term holdouts if the discussion moves toward feed ranking or hashtag recommendations.
Further reading
-
Trustworthy Online Controlled Experiments — Kohavi, Tang, Xu — Practical treatment of experiment design, guardrails, variance reduction, and online metric interpretation.
-
Causal Inference: The Mixtape — Scott Cunningham — Clear explanations of fixed effects, difference-in-differences, matching, and causal identification.
-
Recommender Systems Handbook — Ricci, Rokach, Shapira — Broad reference for ranking metrics, candidate generation concepts, and recommender evaluation tradeoffs.
Practice questions
- Count unconnected posts and reactionsMeta · Data Scientist · Technical Screen · medium
- Compute unconnected 60s posts and reactions averagesMeta · Data Scientist · Technical Screen · medium
- Design a hashtag recommender for News FeedMeta · Data Scientist · Technical Screen · hard
- Design experiment for unconnected content in feedMeta · Data Scientist · Technical Screen · hard
- Compute feed ad frequency and retention in SQLMeta · Data Scientist · Onsite · medium
- Design a feed ads A/B test with guardrailsMeta · Data Scientist · Onsite · hard
- Prove friends outperform unconnected; design metrics, observational analysis, and rollout experimentMeta · Data Scientist · Technical Screen · hard