Integrity, Fraud, Bot, And Harmful Content Measurement
Asked of: Data Scientist
Last updated
What's being tested
Interviewers are probing whether you can measure adversarial, low-base-rate, policy-defined harm under imperfect labels and shifting attacker behavior. The core skill is not merely naming precision/recall; it is choosing metrics, sampling designs, and evaluation methods that remain valid when fraudsters adapt, classifiers suppress exposure, and human labels are noisy. Meta cares because integrity decisions affect user safety, content distribution, ads trust, regulatory reporting, and product growth. A strong Data Scientist can translate “is this system reducing harm?” into a measurable estimand, identify bias in the available data, and design monitoring that distinguishes real improvement from measurement artifact.
Core knowledge
-
Define the estimand before the metric. For harmful content, prevalence is often more decision-relevant than count:
Counting removals can increase when enforcement improves, even if underlying harm decreases. -
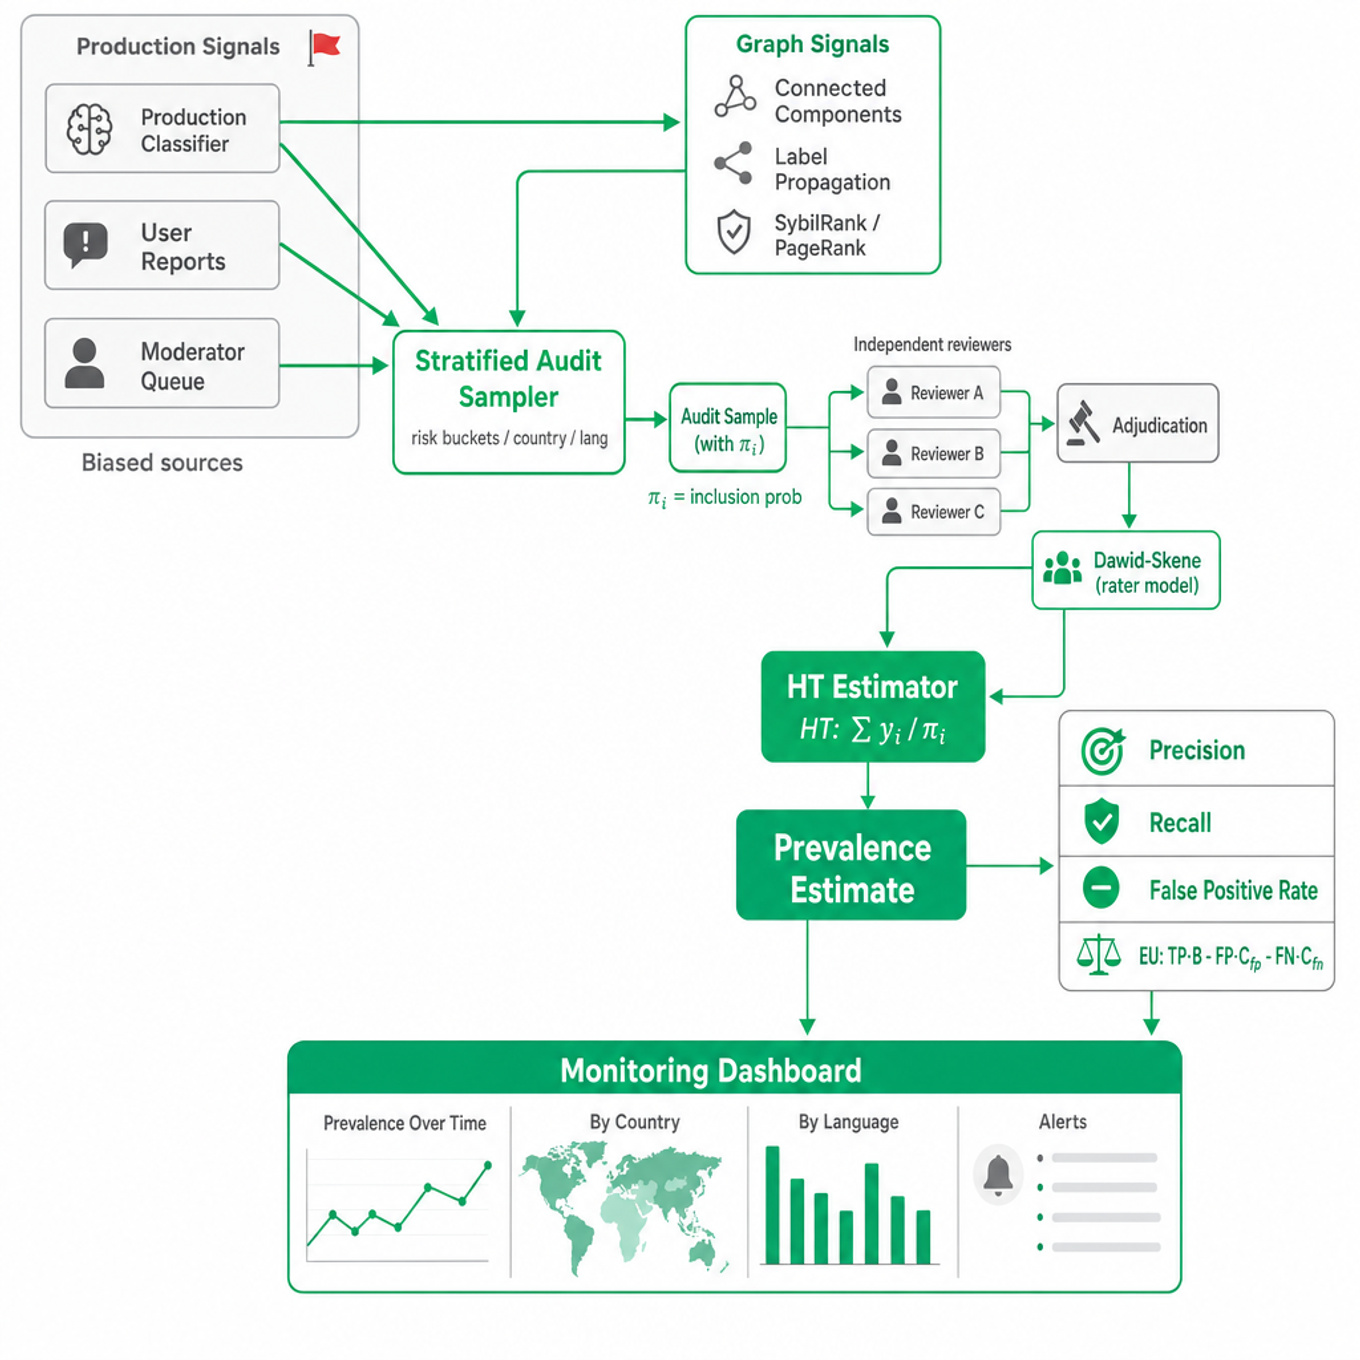
Separate production metrics from ground-truth metrics. Classifier positives, user reports, and moderator queues are biased samples. Use an independently sampled audit set, often stratified by country, language, surface, and risk score, to estimate true violation rates with confidence intervals.
-
Low-base-rate problems make accuracy useless. If only 0.1% of accounts are bots, a classifier that predicts “not bot” has 99.9% accuracy. Discuss precision, recall, false positive rate, prevalence-weighted cost, and expected utility:
-
Human labels are noisy and policy-dependent. Use multiple reviewers, adjudication, calibration gold sets, and agreement metrics such as Cohen’s or Krippendorff’s . For scalable aggregation, Dawid-Skene-style latent truth models can estimate reviewer reliability and infer true labels.
-
Sampling design matters more than sample size alone. Simple random samples are inefficient for rare harms. Stratified sampling by model score or risk bucket plus Horvitz-Thompson weighting gives unbiased estimates:
where is the inclusion probability. -
Graph signals are central for fraud and bot detection. Real approaches include connected components, label propagation, PageRank-style reputation, SybilRank/SybilGuard-inspired trust propagation, community detection, and bipartite graph anomaly detection. Tradeoff: graph methods catch coordinated abuse but can punish legitimate dense communities.
-
Behavioral features complement content features. Bot/fraud models often use account age, session entropy, friend-request velocity, IP/device reuse, posting cadence, click timing, payment history, and graph neighborhood features. Be careful: features like language, geography, or device type can create fairness and market-specific false positives.
-
Near-duplicate and coordinated content detection use hashing and embeddings. SimHash, MinHash, locality-sensitive hashing, perceptual hashes, and vector approximate nearest neighbor search can identify reposted spam or manipulated media. Exact hashes are precise but brittle; embeddings improve recall but increase false positives.
-
Streaming integrity systems need approximate counting. HyperLogLog estimates distinct users/devices at large scale; Count-Min Sketch tracks high-frequency URLs, domains, or accounts; Bloom filters support membership checks. These are useful when events reach billions per day and exact joins are too slow or expensive.
-
Evaluation must account for enforcement feedback loops. Once a classifier downranks or removes content, observed reports and views fall, so naive “reports decreased” may reflect reduced exposure rather than lower creation. Maintain holdouts, delayed-action samples, or shadow evaluation to measure counterfactual harm.
-
A/B tests have interference and ethical constraints. Integrity experiments can spill over through social graphs: treating one user changes what friends see. Use cluster randomization, geo/time splits, or network-aware analysis when interference is material, and avoid knowingly exposing users to severe harm just for measurement.
-
Adversaries adapt, so monitor drift and abuse displacement. Track feature drift, score distribution shifts, precision by segment, attacker migration to new surfaces, and appeal overturn rates. A model that looks good on last month’s labels may fail after attackers change behavior or policy definitions evolve.
Worked example
Measure the prevalence of fake accounts on Facebook
A strong opening would clarify the target: “Do we mean fake accounts created, fake accounts active this month, or fake accounts that generated user-facing impressions?” Then declare an estimand, such as monthly active-account prevalence: the fraction of monthly active accounts that violate the fake-account policy. The answer should be organized around four pillars: defining policy and population, building an unbiased labeled sample, estimating prevalence with uncertainty, and operationalizing monitoring over time. For labeling, propose stratified random sampling across account-risk buckets, geographies, account ages, and activity levels, with human review plus automated evidence, then weight results back to the full population using inclusion probabilities. For measurement, distinguish observed enforcement rate from true prevalence: removals divided by MAU is not prevalence because it misses undetected fake accounts and is affected by enforcement capacity. A specific tradeoff to flag is whether to sample uniformly from all active accounts or oversample suspicious accounts; uniform sampling is simple but inefficient for rare fraud, while stratified sampling improves precision but requires correct weighting. You would also mention confidence intervals and segment cuts, because a global average can hide severe market-specific issues. Close by saying that with more time you would add a longitudinal component to separate new fake-account creation from survival of existing fake accounts, and a holdout/shadow-review process to detect model drift.
A second angle
Evaluate whether a harmful-content classifier reduced violating views
The same measurement principles apply, but the unit shifts from accounts to content impressions, and the causal question becomes central. The naive answer, “violating views decreased after launch,” is insufficient because seasonality, concurrent policy changes, or traffic shifts could explain the drop. A stronger framing uses an experiment or quasi-experiment: user/content-level randomization if safe, clustered randomization to reduce network spillovers, or a geo/time difference-in-differences design if randomization is infeasible. The primary metric should be violating-view prevalence, estimated from an independently labeled impression sample, not just model takedowns. The main constraint is ethical: the control group should not be exposed to clearly severe content, so candidates should discuss guardrails, minimum-enforcement baselines, and shadow scoring rather than a pure no-treatment holdout.
Common pitfalls
Analytical mistake: optimizing for removals instead of harm reduction. A tempting answer is “success means we removed more violating content.” That can reward over-enforcement or simply reflect more content being created; a better answer separates creation, detection, action rate, exposure, false positives, and downstream user harm.
Communication mistake: jumping into model features before defining the metric. Saying “I’d train a bot classifier using IP, device, and graph features” may sound technical but misses the measurement question. Interviewers want to hear the problem framed first: population, policy definition, unit of analysis, ground truth source, metric, bias, and uncertainty.
Depth mistake: ignoring adversarial behavior and feedback loops. Fraud and abuse systems are not static classification problems. Attackers adapt to thresholds, enforcement reduces observable signals, and user reports are endogenous to ranking; a strong answer proposes ongoing monitoring, holdouts or audits, drift checks, and segment-level review.
Connections
Expect pivots into experimentation under interference, causal inference with biased observational data, rare-event classification, ranking tradeoffs, and fairness in enforcement. Interviewers may also connect this topic to marketplace trust, ads fraud, recommendation integrity, or privacy-preserving measurement when sensitive user or reviewer data is involved.
Further reading
- Facebook Community Standards Enforcement Report — useful for understanding real-world integrity metrics such as prevalence, proactive detection rate, and appealed content restored.
- Saito and Rehmsmeier, “The Precision-Recall Plot Is More Informative than the ROC Plot When Evaluating Binary Classifiers on Imbalanced Datasets” — directly relevant for rare-event abuse detection.
- Dawid and Skene, “Maximum Likelihood Estimation of Observer Error-Rates Using the EM Algorithm” — foundational method for aggregating noisy human labels.
Related concepts
- Integrity, Fraud, And Content Moderation Measurement
- Integrity, Harm, And Fraud Measurement
- Trust, Safety, Fraud, And Content Moderation Measurement
- Platform Integrity: Fake Accounts, Bots, Fraud, And Harmful ContentAnalytics & Experimentation
- Fake Account, Bot, And Fraud MeasurementAnalytics & Experimentation
- Harmful Content Moderation Measurement