I Pinned Our Autoscaler for a Month to See What Would Break. Nothing Did.
Quick Overview
This resource explains when autoscaling helps, when it quietly wastes money, and how to decide whether a Kubernetes HPA is actually protecting your system or just reacting to noise. It breaks down why CPU-based autoscaling can be misleading, especially when spikes come from garbage collection, deploys, cron jobs, warmups, or batch work rather than real customer demand. The guide shows how to audit autoscaler behavior with Prometheus, compare scale-out events against traffic, calculate fixed replica counts from p95 concurrency, and decide when predictable workloads can use pinned capacity or scheduled floors instead of reactive scaling. It is useful for software engineers, backend engineers, SREs, infrastructure engineers, and system design interview candidates who want to reason clearly about cloud costs, capacity planning, Kubernetes scaling, operational risk, and production tradeoffs.
The bill fell 38%, and most of what we'd been "scaling for" turned out to be cron jobs and deploys, not customers.

Our autoscaler spent last quarter defending us from a threat that never showed up
Our autoscaler spent roughly [$XX,XXX] last quarter protecting us from a spike that never arrived. I only noticed because someone in finance asked a question I couldn't answer: what does that line item actually do?
I'll put it bluntly. Autoscaling is a tax you pay for not knowing your own load. We'd been paying it in full, every single night.
Nobody questions the autoscaler, because it's "best practice"
Our monthly compute bill sat at [$XX,XXX]. The cluster scaled out [~N] times a day, every day, like clockwork. Nobody looked at it. Why would they? The autoscaler is the thing you're supposed to have. It's in every reference architecture, every production-ready checklist. It carries the moral weight of a seatbelt.
So it goes invisible. It never pages anyone. It never shows up in a retro. It quietly adds nodes and quietly adds cost, and the cost gets filed under "cloud," which gets filed under "unavoidable."
Look, the money is only half of it. The other half is sanity. An autoscaler you can't explain is a system running your infrastructure that nobody on the team actually understands. That's a liability whether or not it's expensive.
"Elastic means efficient" is the default advice. It was wrong for us.
The advice is "scale on CPU." Every tutorial says it. The HPA (Kubernetes' horizontal pod autoscaler) docs practically hand it to you. Set a target utilisation, walk away, feel modern.
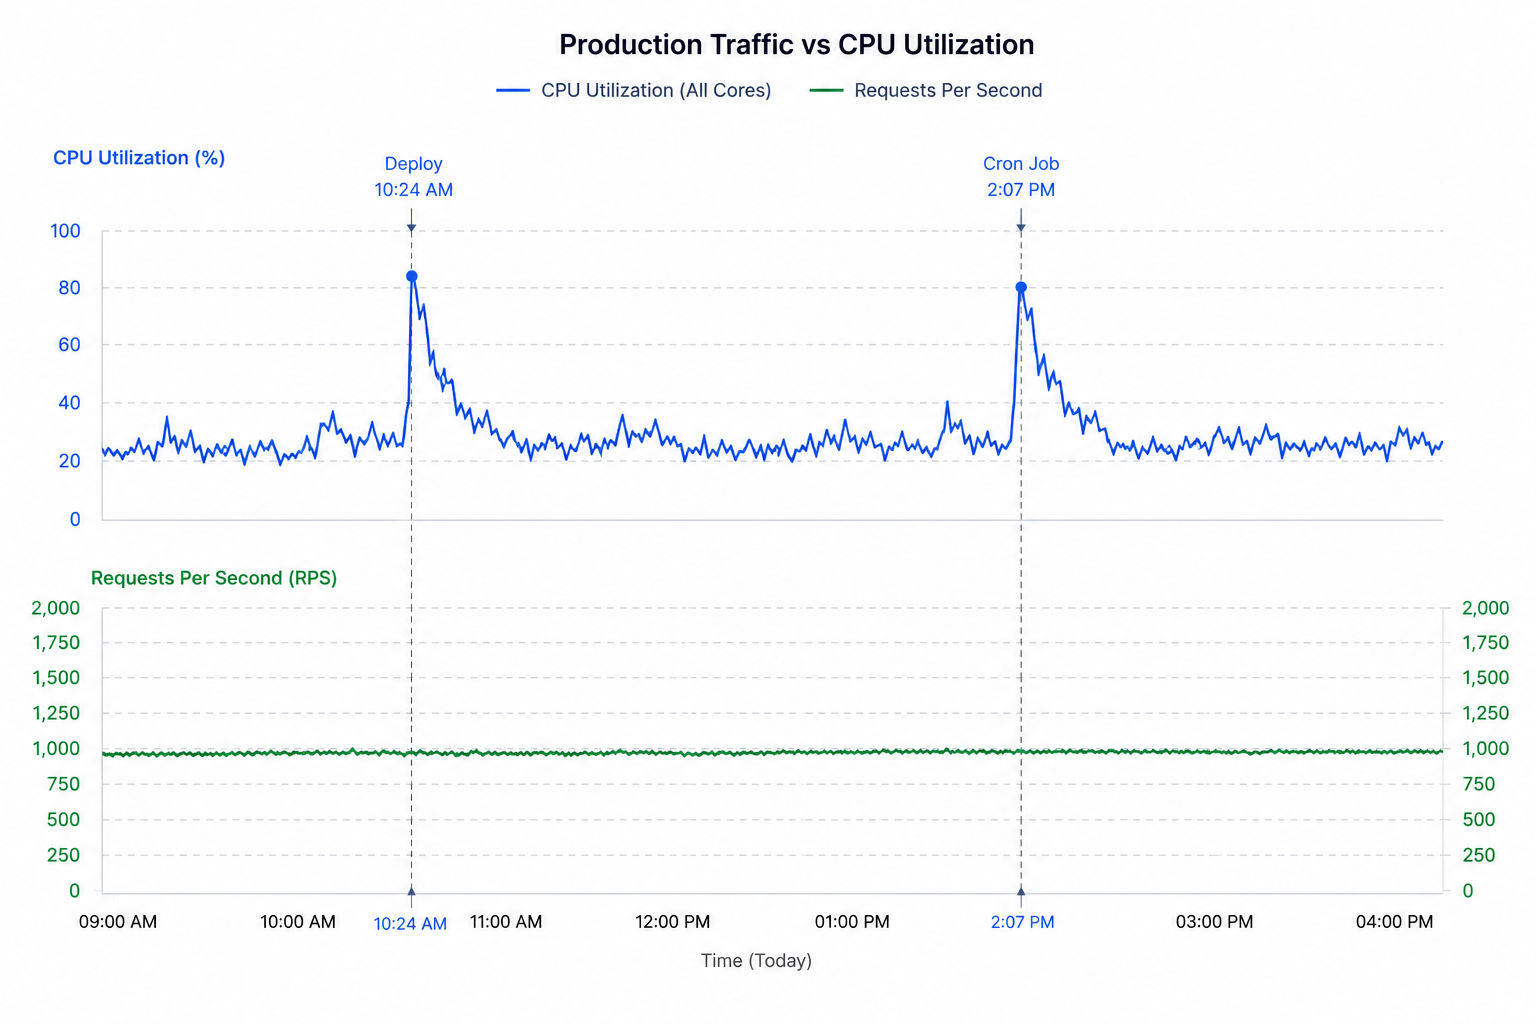
The assumption underneath is that CPU tracks demand. It doesn't. CPU climbs when a garbage collector runs. It climbs when a nightly batch job kicks off. It climbs for thirty seconds every time you deploy and the runtime warms up. None of those are customers.
A CPU spike is not a customer spike. It's usually us: our deploys, our cron jobs, our own noise.
We were scaling on a signal that had almost nothing to do with the thing we cared about. The autoscaler was reacting fast and expensively to our own noise, like a loyal servant who never asked why.
Three weeks of watching a line that refused to move
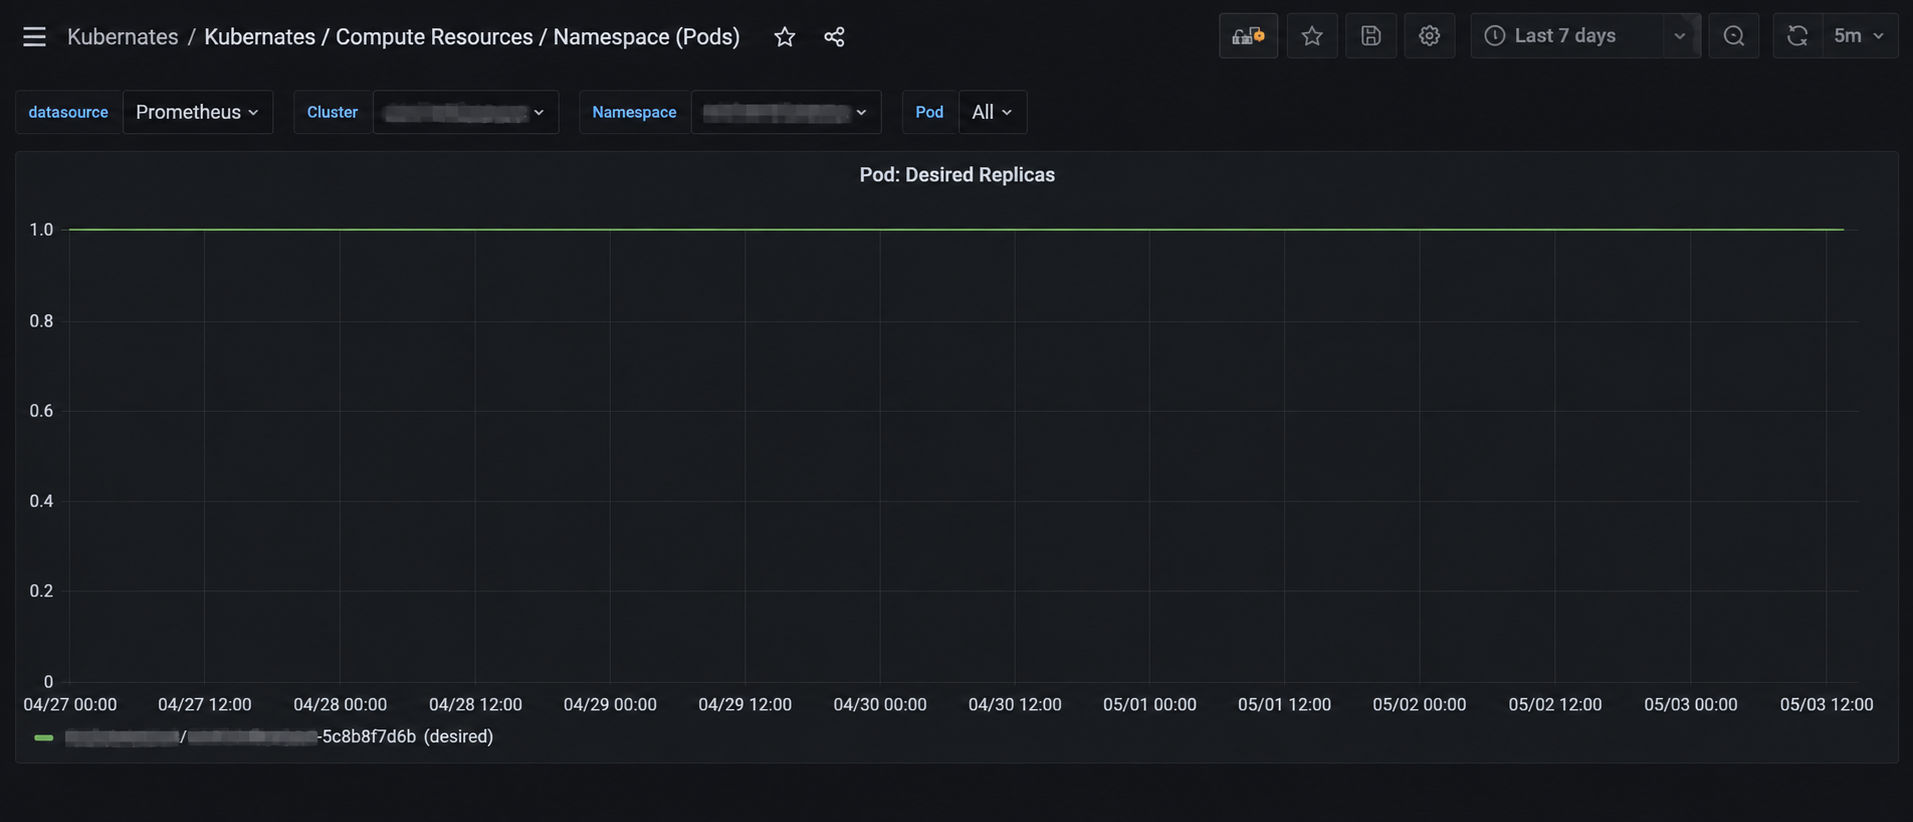
Week one, I was scared. I'll admit that. I capped the deployment at a fixed replica count and sat with the dashboard open like it was a heart monitor. I over-provisioned on purpose, gave it far more headroom than the math said, because I didn't trust the math yet. That's the honest starting point. I hedged.
Week two, the fear got boring. The instance-count line went flat and stayed flat. The thing I'd been paying an autoscaler to do, move that line up and down with traffic, turned out to be a line that barely needed to move. Traffic was diurnal. Predictable. Same shape every weekday. We'd been buying elasticity for a workload that wasn't elastic.
Week three is the part that matters, because week three is where I nearly broke it. Marketing ran a push. Real traffic, the kind that used to trigger a dozen scale-outs. And here's my own bad call: I sized the headroom off the wrong tier. I did the capacity math for the API pods and completely forgot the worker pool that drains the queue. The push landed, the queue backed up, and for a while we were closer to the edge than I'd ever have allowed with the autoscaler on.
It held. Barely. Not because I was clever, but because I'd over-hedged in week one and the slack absorbed my mistake.
The autoscaler wasn't protecting us from traffic. It was protecting us from my failure to do the capacity math.
That's the real lesson, and I want to be clear about it. Turning the autoscaler off didn't make the work vanish. It moved the work back onto a human, and the first time that human (me) got sloppy, it showed. The near-miss wasn't an argument for switching it back on. It was an argument for owning the number instead of outsourcing it to a heuristic that was watching the wrong signal anyway.
The line that lied, and the query that proved it
While I was cleaning up my own mistake, I finally looked at the config that had been making the decisions all along.
metrics:
- type: Resource
resource:
name: cpu
target:
type: Utilization
averageUtilization: 60 # <-- this is the line that lied
Sixty percent CPU. Sounds reasonable. Says nothing about demand.
The fix wasn't a cleverer autoscaler. It was a number we could defend:
spec:
replicas: 12 # p95 concurrency + 20% headroom. a decision, not a guess.
Then I went looking for proof the scale-ups had been noise. This is the query that ended the argument:
how many times did we actually scale out last month?
count_over_time(
(kube_hpa_status_desired_replicas
kube_hpa_status_current_replicas)[30d:1m]
)
then overlay deploy + cron timestamps on the same graph.
That's PromQL (Prometheus' query language). I put the scale-out events on one axis and our deploy and cron timestamps on the other. They lined up almost perfectly. Request rate over the same window stayed flat while all of it was firing. The autoscaler had been reacting to us, not to our users.
The capacity math turned out to be dull. That dullness was the whole victory. Take p95 concurrency over a representative week and add twenty percent. If your p95 concurrency is 10 requests in flight, 12 replicas gives you a floor with 20% headroom. That's it. If your traffic is diurnal you can even schedule two floors, a day number and a night number, and never touch a reactive scaler at all.
Four questions before you trust any autoscaler
Before you let an autoscaler stay in your stack, make it answer four questions.
- What signal actually fires it? Is that signal tied to user demand, or just to your own machinery: GC, deploys, batch jobs? If it's the latter, you're scaling on noise.
- How often did it fire last month? Not "could have" fired. Actually fired. Pull the number. If you can't pull it, that's the finding
- What did each firing cost? Node-hours, yes, but also cold starts, thrash, and the overhead of a system nobody on the team can reason about.
- What breaks if it never fires again? If the honest answer is "nothing, our load is predictable and we keep headroom," you're not running it for reliability. You're running it out of habit.
Habit is an expensive reason to keep a distributed system in your critical path.
38% off the bill, and a job that belongs to a human again
The compute bill dropped 38%. That's the headline, and it's real.
Now the honest cost sheet, because there's always one. Capacity planning is a human job again. Somebody has to look at the p95, somebody has to update the floor when the product changes shape, and that somebody is on the hook when they forget the worker pool, like I did. We took one weekend page during a later spike that the old autoscaler would have swallowed silently: [~X minutes] of slightly elevated latency that self-corrected, no errors, no data loss. The runbooks changed too. "Is it scaling?" became "is the floor still right?", a better question, but one a human now owns.
Visible work has a name and an owner. Invisible work just has a bill.
I'd make the trade again. But it was a trade, not a free win.
Do this only if you can draw your own traffic graph from memory
Don't turn off your autoscaler because a blog post told you to. Match the scrutiny to the blast radius.
Pin your capacity only if three things are true:
- Predictable load. Diurnal, seasonal, something you could sketch from memory.
- Headroom math done. For every tier, including the one you'll be tempted to forget.
- A human owns a monthly review. Your traffic will drift and your floor will rot, so someone has to keep looking.
If your load is spiky, event-driven, genuinely unpredictable, keep the autoscaler. That's exactly what it's for. Pinning capacity there just moves the risk onto a pager.
And no happy ending. Our bill is already creeping back up. Every new team ships a new service with the tutorial-default autoscaler bolted on, scaling on CPU, reacting to its own deploys. The tax reinstates itself one service at a time. Turning it off once isn't a fix. Staying honest about your load is a practice, and practices decay the moment nobody owns them.
If you're preparing for a system design interview, or just trying to survive your next production outage, followPracHubfor more engineering deep dives.
Related Articles
Design WhatsApp: the presence and receipt problems most candidates ignore
Design WhatsApp-style chat with WebSockets, offline inboxes, Kafka partitions, presence TTLs, receipts, and reliable delivery.
One Line of Code Halved Our Storage. Another Stopped Us Re-Encoding Two-Hour Films.
Learn how to scale video transcoding with segment-level retries, CMAF packaging, CDN caching, and VOD system design tradeoffs.
Why Your Ride-Sharing Database Fails at 250,000 Writes a Second
Design nearest-driver matching with geohash, Redis GEO, H3, hot/cold paths, atomic ride claims, and surge pricing for interviews.
"Just Make It Idempotent" Is Half an Answer in a System Design Interview
Learn idempotency for system design interviews: payment retries, duplicate requests, database constraints, outbox patterns, and exactly-once myths.
Comments (0)