A/B Testing Design And Analysis
Asked of: Data Scientist
Last updated
What's being tested
Interviewers are probing whether you can design a valid product experiment, choose metrics that reflect user and business value, and interpret results under real-world constraints like logging bugs, network effects, novelty, and multiple launches. Meta cares because most product decisions are made from large-scale experiments where small percentage changes can affect millions of users and billions of impressions. The goal is not to recite p-values; it is to show you can reason from a product hypothesis to an experiment design, diagnose threats to validity, and make a launch recommendation with appropriate caveats.
Core knowledge
-
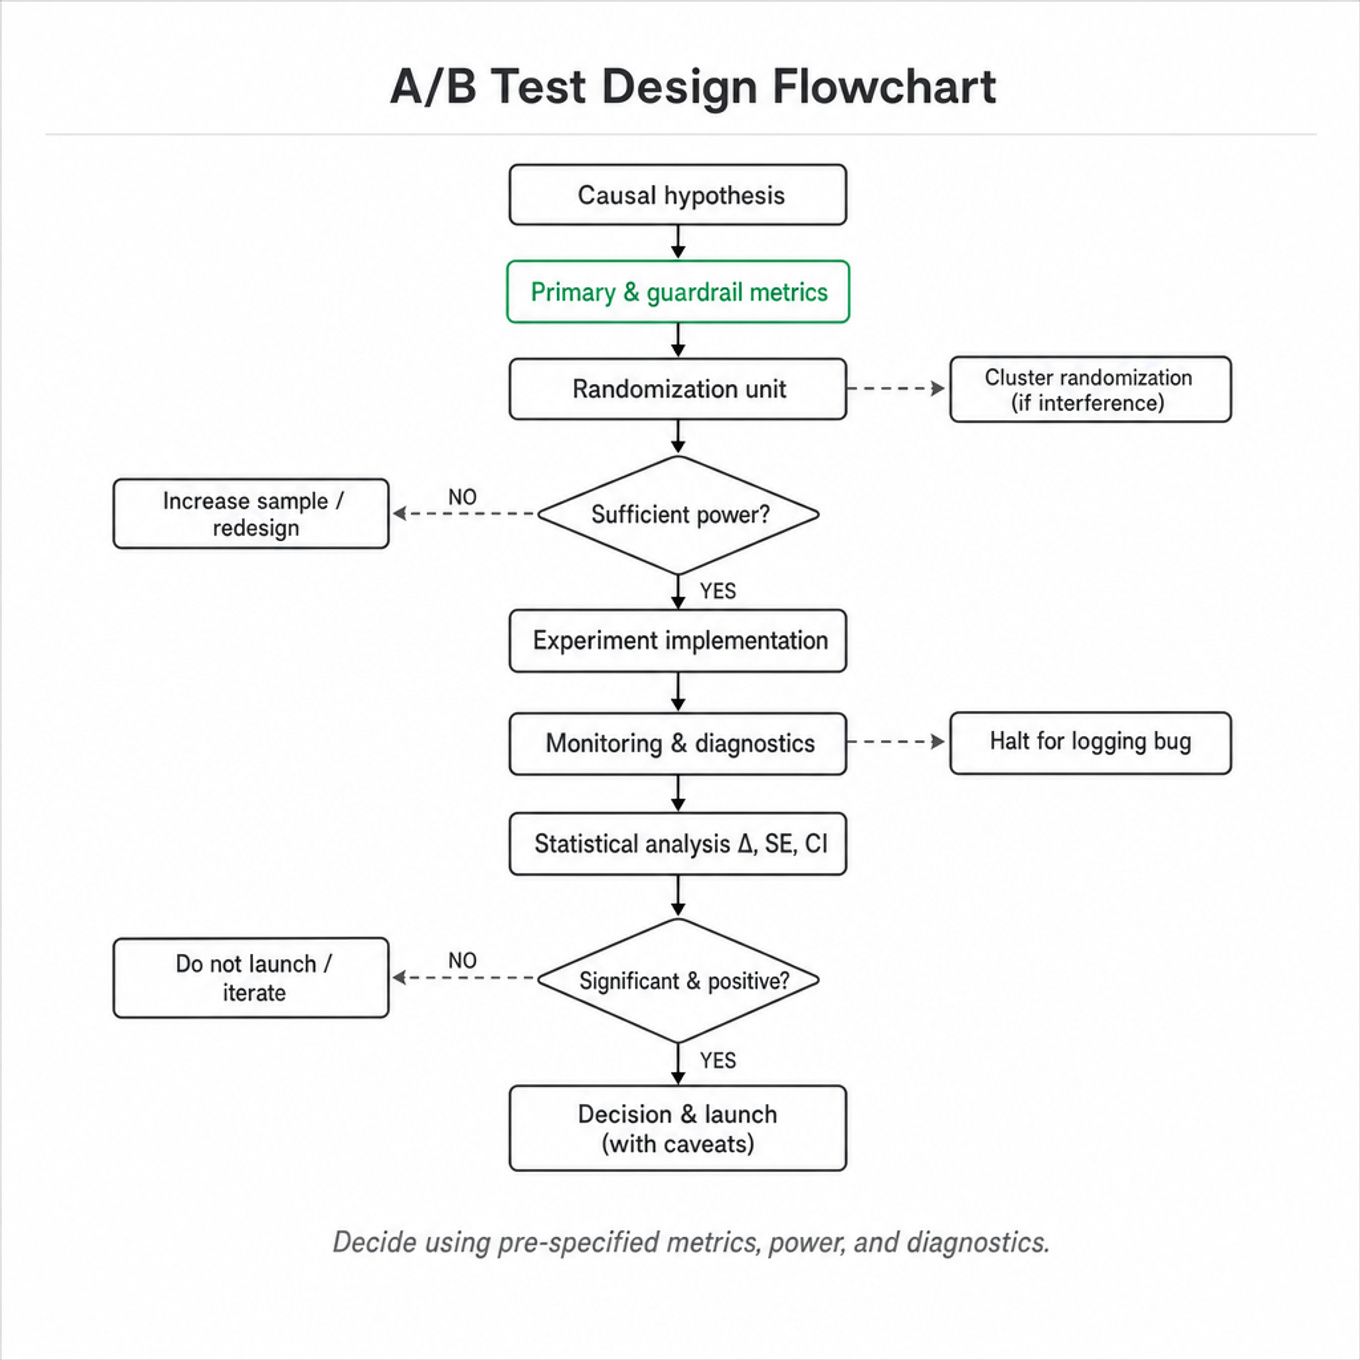
Start with a causal hypothesis: “Changing X will affect Y for population Z through mechanism M.” Translate that into a primary metric, guardrail metrics, target population, experiment unit, and decision rule before looking at results. Weak designs often fail because the metric does not match the hypothesized mechanism.
-
Choose the randomization unit to avoid contamination. For feed ranking, randomize by user; for ads auctions, consider advertiser, user, or market depending on interference; for messaging or social graph features, cluster randomization may be needed because one treated user can affect untreated friends.
-
Define metrics precisely: numerator, denominator, inclusion rules, time window, and aggregation level. “CTR” could mean clicks / impressions, average user-level CTR, or clickers / viewers; these answer different questions and have different variance properties.
-
Common Meta-style metric families include engagement metrics such as DAU, sessions, time spent, reactions, comments, shares, Reels plays; ecosystem metrics such as friend interactions or creator posts; business metrics such as revenue, ad impressions, conversions; and guardrails such as hides, reports, unfollows, crashes, latency, and retention.
-
For a two-sample difference in means, estimate treatment effect as , with standard error A 95% confidence interval is approximately when sample sizes are large.
-
Power and sample size depend on the minimum detectable effect. For equal-sized groups and continuous outcomes, a rough formula is Smaller effects require quadratically larger samples; detecting a 0.1% lift may need 100x the traffic of a 1% lift.
-
Use user-level analysis for user-randomized tests, even when the metric is event-based. Treating impressions as independent observations creates artificially tiny p-values because impressions from the same user are correlated. Aggregate to user-day or user-experiment-period, then compare users.
-
Ratio metrics need care. For metrics like clicks / impressions or revenue / active user, either analyze user-level ratios, use delta method standard errors, or bootstrap users. Do not naively divide aggregate treatment clicks by aggregate treatment impressions and run an impression-level test.
-
Watch for sample ratio mismatch. If a 50/50 experiment has 52/48 allocation, test assignment counts using a chi-square test: SRM can indicate broken randomization, eligibility bugs, logging loss, or treatment affecting whether users appear in the dataset.
-
Sequential monitoring changes false positive rates. If teams peek every day and launch at the first , the true Type I error can be much higher than 5%. Use pre-specified checkpoints, alpha spending, group sequential methods, or always-valid confidence sequences when continuous monitoring is required.
-
Variance reduction matters at Meta scale because many effects are small. CUPED uses a pre-experiment covariate to adjust outcomes: It improves power when pre-period behavior strongly predicts post-period outcomes.
-
Interpret significance with practical impact. A statistically significant +0.02% time-spent lift may not justify added latency, negative comments, or long-term content quality risk. Conversely, an insignificant result with a wide confidence interval may be inconclusive rather than evidence of no effect.
Worked example
For “Design an A/B test for a new Reels ranking model”, a strong candidate would first clarify the product goal: is the model intended to increase short-term engagement, improve creator distribution, reduce low-quality content, or drive long-term retention? They would also ask who is eligible, whether the ranking change affects only Reels surfaces or downstream Feed recommendations, and whether there are network effects between viewers and creators. The answer should be organized around five pillars: hypothesis and metrics, unit of randomization, experiment population and duration, statistical analysis plan, and launch decision criteria. For metrics, they might propose Reels watch time per user as the primary metric, with guardrails like hides, reports, negative feedback, session length inflation, app crashes, latency, creator concentration, and next-week retention. The unit would likely be user-level randomization for viewers, but they should flag that creators’ content distribution can be affected by treated viewers, creating marketplace interference. A specific tradeoff is whether to optimize for total watch time or quality-adjusted watch time; maximizing raw watch time could reward clickbait or low-satisfaction content. They should also mention ramping from 1% to 5% to 50% to catch logging, latency, or ecosystem issues before full exposure. The close should be decision-oriented: launch if the primary metric improves with no meaningful guardrail regressions and confidence intervals exclude unacceptable downside; otherwise iterate or run a longer retention-focused test. If they had more time, they could add heterogeneous treatment analysis by new vs. mature users, heavy vs. light Reels consumers, and creator segments.
A second angle
For “Analyze an A/B test where engagement increased but retention decreased”, the same experimentation principles apply, but the emphasis shifts from design to interpretation and tradeoff management. A strong answer would avoid saying “engagement won, so launch” and instead ask whether the engagement metric is cannibalizing healthier behavior or causing fatigue. They would examine time windows: same-day sessions may rise while 7-day or 28-day retention falls, suggesting a novelty or overconsumption effect. They would segment users to see whether the retention drop is concentrated among new users, low-intent users, or users exposed to high-frequency notifications. The launch recommendation would depend on the product objective and confidence intervals, but a Meta-caliber response should explicitly value long-term user health over a narrow short-term lift.
Common pitfalls
An analytical mistake is treating every row in an event log as an independent observation. For example, running a t-test over billions of impressions in a user-randomized experiment will almost always produce “significant” results because it ignores within-user correlation. A better answer aggregates outcomes at the randomization unit or uses clustered standard errors / bootstrap by user.
A communication mistake is jumping straight into formulas without defining the product objective. Saying “I’ll run a two-sided t-test with ” before naming the hypothesis, population, primary metric, and guardrails sounds mechanical. Interviewers want to see that you can make a decision for a product team, not just execute a statistical test.
A depth mistake is ignoring interference and ecosystem effects. In social products, treating one user may change what their friends, creators, advertisers, or groups experience. A stronger answer flags possible violations of SUTVA and proposes cluster randomization, marketplace-level experiments, holdout groups, or careful interpretation when clean isolation is impossible.
Connections
Expect pivots into causal inference, especially difference-in-differences, synthetic controls, or instrumental variables when randomized experiments are infeasible. Interviewers may also connect this topic to metric design, product sense, logging/data quality, sequential testing, heterogeneous treatment effects, or experimentation platform design.
Further reading
- Trustworthy Online Controlled Experiments by Kohavi, Tang, and Xu — Practical, industry-focused treatment of experiment design, metrics, SRM, ramping, and interpretation.
- Controlled experiments on the web: survey and practical guide, Kohavi et al. — Seminal paper on online experimentation pitfalls and best practices.
- CUPED: Controlled-experiment Using Pre-Experiment Data — Microsoft paper introducing a widely used variance reduction method for large-scale experiments.