A/B Testing
Asked of: Data Scientist
Last updated
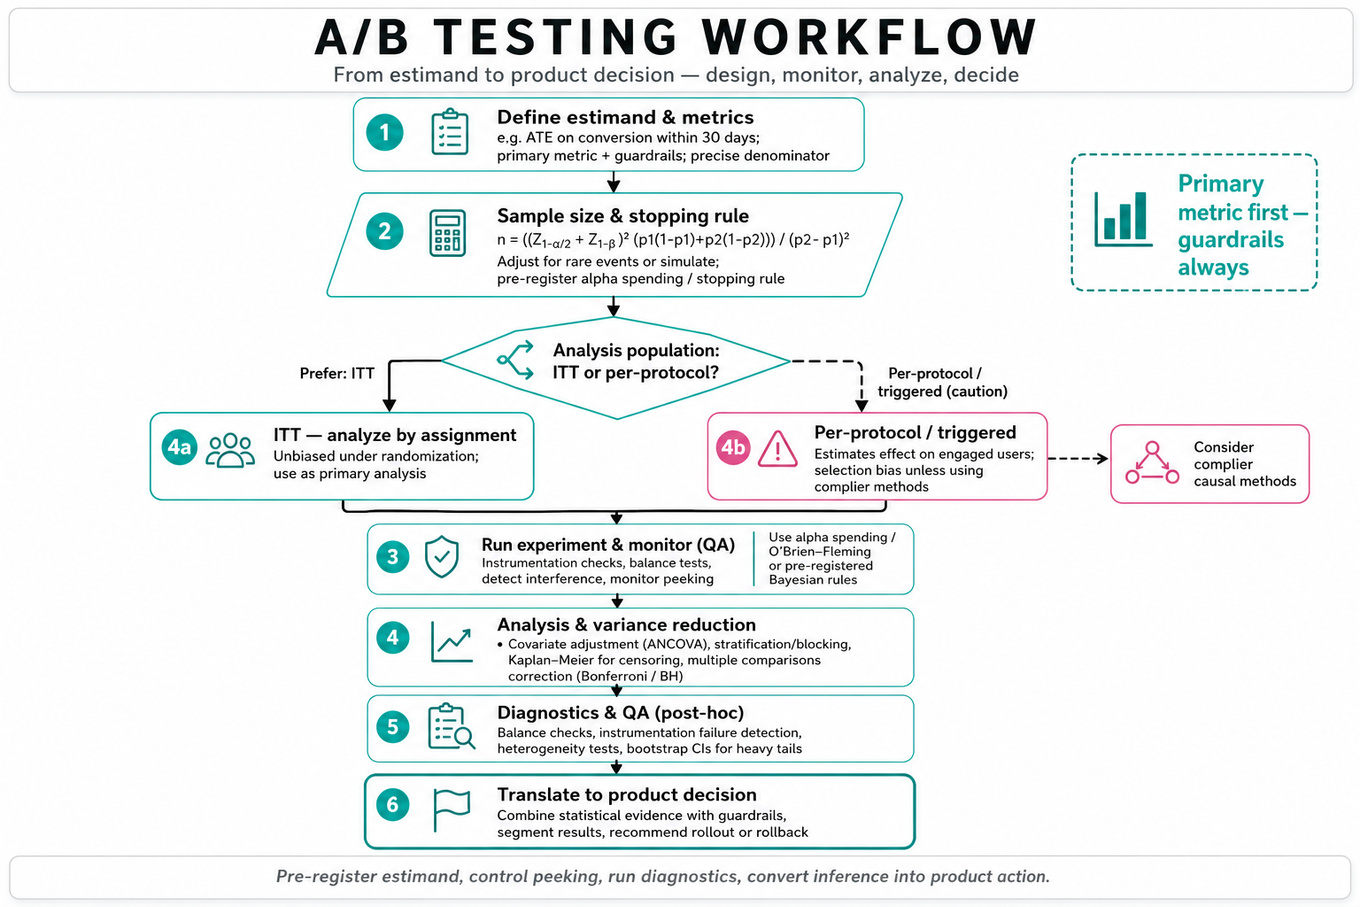
What's being tested
Candidates must demonstrate end-to-end A/B testing proficiency: defining causal estimands, choosing the right analysis population, sizing and powering an experiment, detecting and correcting bias, and translating statistical results into product decisions. Interviewers probe whether you can specify clear metrics (including guardrails), reason about intent-to-treat (ITT) vs per‑protocol / triggered analyses, and detect practical threats like instrumentation failures, interference, or heterogeneous treatment effects. OpenAI expects Data Scientists to drive reliable, decision-grade inference from product experiments, not to design infrastructure.
Core knowledge
-
Estimand clarity: State the causal quantity (e.g., average treatment effect on conversion within 30 days under random assignment). Distinguish ATE from conditional or complier-specific effects.
-
ITT vs per-protocol: ITT measures effect of assignment (unbiased under randomization); per‑protocol / triggered measures effect on those who actually engage with treatment (biased by selection unless using complier causal methods).
-
Sample size / power: For two proportions, use
where (Z) from Gaussian quantiles. For rare events or heavy tails, inflate variance or simulate. -
Observation window & censoring: Choose an outcome horizon that captures downstream behavior (e.g., 30–90 days for subscriptions). Be explicit about censoring and show how survival analysis or Kaplan–Meier can handle staggered entry.
-
Metric design: Define primary metric, guardrail metrics, and precise denominators (unique users, first exposure). For revenue use truncated mean or median if heavy-tailed, or use bootstrap CIs.
-
Sequential testing / peeking: Stopping on peeks inflates type-I error; use alpha spending / O’Brien–Fleming or sequential methods like GSPRT or Bayesian decision rules. Pre-register the stopping rule.
-
Variance reduction: Use stratification, blocking, or covariate adjustment (ANCOVA) to reduce variance; include pre-treatment covariates only. Covariate adjustment preserves unbiasedness under randomization.
-
Multiple comparisons: Correct for familywise error with Bonferroni or control FDR with Benjamini–Hochberg when testing many metrics or segments.
-
Diagnostics & QA: Run
randomization checks(covariate balance),exposure-ratechecks, and instrumentation tests (eventing, deduplication). Break these into SQL checks againstSnowflakeorBigQuerytables. -
Interference & SUTVA violations: Test for spillovers (e.g., invite flows) and consider cluster-randomization or network-aware estimators if SUTVA fails.
-
Heterogeneous effects & segmentation: Pre-specify or limit post-hoc subgroup analysis; use interaction terms or uplift modeling, and be careful of low power in small cohorts.
-
Business decision framing: Translate statistical lift into expected incremental value (e.g., incremental LTV = lift in conversion × cohort lifetime value) and account for rollout cost and adoption risk.
Tip: Simulate realistic funnels when unsure—simulate assignment, participation, and censoring to estimate power under complex triggering and delay.
Worked example — Design and analyze a free-trial A/B test
First 30 seconds: clarify the product, who is randomized (all visits vs eligible users), the free-trial length, primary business goal (short-term conversions vs long-term retention), and any eligibility filters. Outline the plan in three pillars: (1) define estimand and population (ITT on users assigned to offer, 30‑day paid-conversion as primary), (2) power and sample-size with realistic baseline conversion and expected lift, and (3) diagnostics and rollout decision metric (incremental retained revenue with guardrails on churn and engagement). Explicit tradeoff: a longer trial captures retention but delays decision and increases churn noise; balance with interim checks using pre-specified sequential rule. Specify analysis: compute conversion rates per arm, use pooled standard error to form z-test, and report incremental LTV by multiplying conversion lift by average revenue per converted user; bootstrap revenue CIs if skewed. Close by listing operational checks (randomization balance, exposure-tracking, no cross-user leakage) and say: "if I had more time, I'd simulate the funnel including delayed conversions and run subgroup power analyses for key cohorts."
A second angle — Analyze A/B Test Results for Subscription Conversion Rates
This prompt focuses on post-hoc analysis when the experiment is complete. Start by validating instrumentation and randomization, then compute paid-conversion lift and its CI, but go beyond: estimate retained value by computing cohort retention curves (e.g., 7/30/90 day retention) and expected incremental revenue using discounted cash flows. Flag churn: if conversion increases but short-term retention drops, compute net present value of the lift. Use survival analysis for time-to-conversion and time-to-churn to avoid censoring bias. Also present decision criteria: positive statistically significant lift on primary metric plus nonnegative impact on guardrails and positive expected ROI justify ramp; otherwise iterate on product or segment rollout.
Common pitfalls
Pitfall: Reporting per-protocol conversion rates as if they were causal — selecting on users who accepted the trial conflates treatment effect with self-selection. Always present ITT first and justify complier analyses with causal methods.
Pitfall: Peeking and unadjusted interim stopping — claiming significance after multiple looks without an alpha spending plan inflates false positives. Pre-specify stopping or use sequential methods.
Pitfall: Ignoring delayed effects and censoring — analyzing only early converters can miss downstream churn or late conversions; pick an appropriate observation window and use survival techniques to handle staggered entries.
Connections
Interviewers may pivot to uplift modeling (estimating heterogeneous treatment effects), causal inference (instrumental variables or complier average causal effect), or metric instrumentation/monitoring (alerting on metric drift). Familiarity with Bayesian experimentation and sequential decision frameworks is also a logical next step.
Further reading
- Evan Miller — A/B Testing: The Most Powerful Way to Turn Clicks Into Customers — practical guide to statistics and pitfalls in A/B testing.
Featured in interview prep guides
Practice questions
- Design experiments for marketplace product changesDoorDash · Data Scientist · Onsite · hard
- Evaluate a new ranking modelDoorDash · Data Scientist · Onsite · hard
- Design a free-month experimentOpenAI · Data Scientist · Technical Screen · hard
- Assess Adding Bicycle DashersDoorDash · Data Scientist · Technical Screen · medium
- Evaluate Fresh Content and Video ExperimentsPinterest · Data Scientist · Technical Screen · medium
- Design experiment for bike delivery featureDoorDash · Data Scientist · Technical Screen · medium
- Design and assess a video-pin increase experimentPinterest · Data Scientist · Technical Screen · medium
- Design and analyze a switchback experimentDoorDash · Data Scientist · Technical Screen · hard
- Decide if ad load is optimizedPinterest · Data Scientist · Onsite · hard
- Design and analyze a free-trial A/B testOpenAI · Data Scientist · Technical Screen · hard
- Experiment on increasing order notificationsDoorDash · Data Scientist · Onsite · hard
- Design rigorous A/B test and causal analysisPinterest · Data Scientist · Onsite · hard
Related concepts
- A/B TestingAnalytics & Experimentation
- A/B Testing And Experiment DesignAnalytics & Experimentation
- A/B Testing And Experiment DesignAnalytics & Experimentation
- A/B Testing, Power, And Experiment DesignAnalytics & Experimentation
- A/B Testing And Experiment DesignAnalytics & Experimentation
- A/B Testing And Causal ExperimentationAnalytics & Experimentation