A/B Testing, Power, And Experiment Design
Asked of: Data Scientist
Last updated
What's being tested
LinkedIn is probing whether you can turn a product change into a defensible causal measurement plan, not just compute a p-value after the fact. Strong Data Scientist answers define the estimand, choose primary and guardrail metrics, reason about power, handle segmentation and interference, and explain what to do when results disagree across cohorts. This matters because LinkedIn experiments often affect marketplaces, recommendations, notifications, and social behavior where short-term engagement, long-term member trust, and ecosystem health can move in different directions. Interviewers are looking for statistical rigor plus product judgment: can you design an experiment that answers the business question without overclaiming?
Core knowledge
-
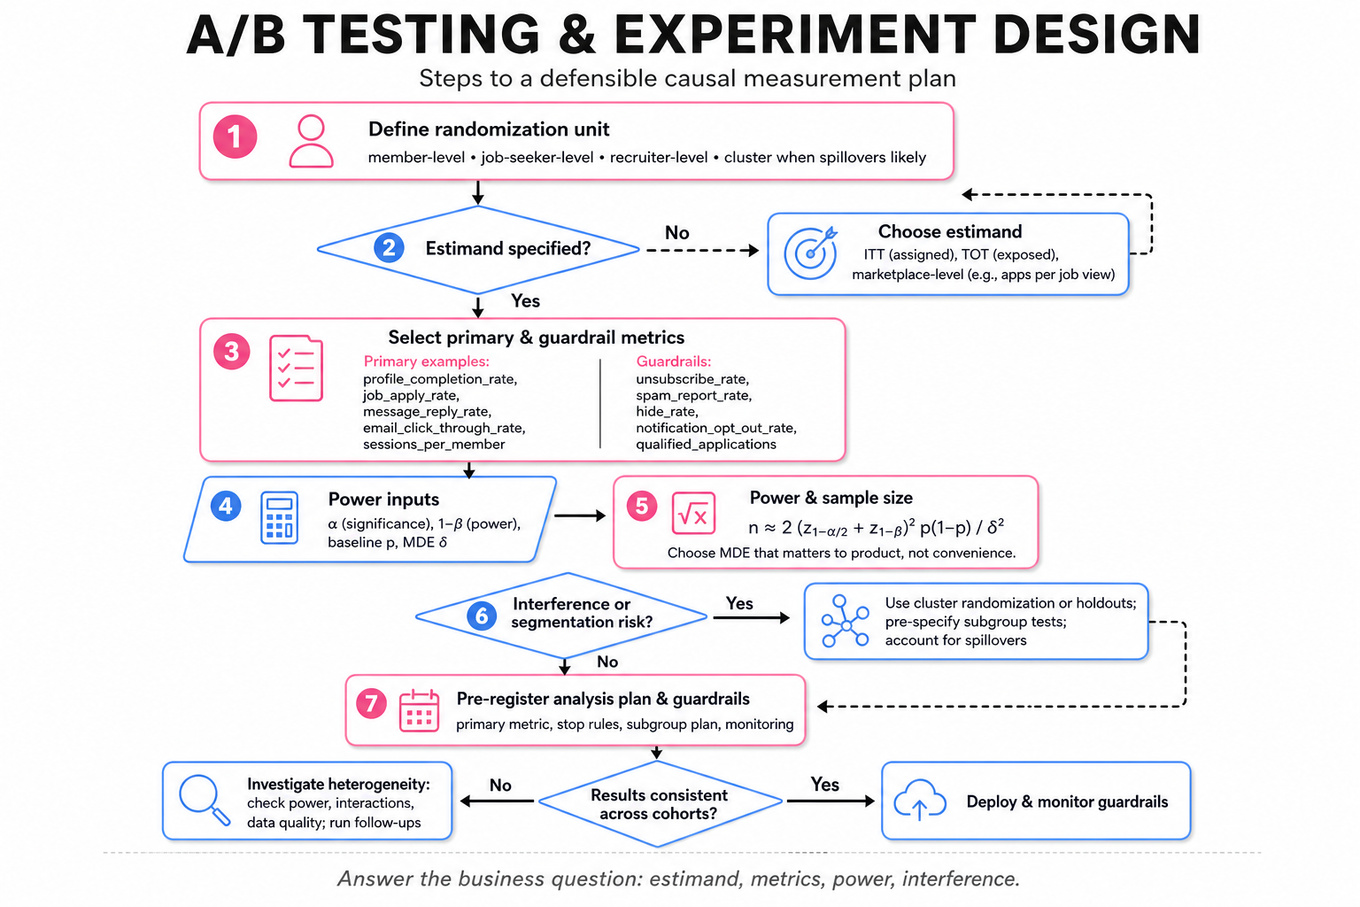
A/B testing estimates a causal effect by randomizing units into treatment and control. Define the unit first: member-level randomization for profile nudges, job-seeker-level randomization for job recommendations, recruiter-level randomization for hiring tools, or cluster randomization when network spillovers are likely.
-
Estimand clarity prevents ambiguous conclusions. State whether you want the intent-to-treat effect on all assigned users, the treatment-on-treated effect among exposed users, or a marketplace-level effect such as applications per job view. For most product experiments,
ITT = E[Y | assigned treatment] - E[Y | assigned control]is the safest default. -
Primary metrics should map directly to the product objective and be chosen before launch. Examples:
profile_completion_rate,job_apply_rate,message_reply_rate,email_click_through_rate, orsessions_per_member. Pair them with guardrail metrics likeunsubscribe_rate,spam_report_rate,hide_rate,notification_opt_out_rate, or downstream quality such asqualified_applications. -
Power analysis links detectable effect, sample size, variance, and significance. For a two-sample test on proportions with equal allocation, a useful approximation is:
where is baseline rate, is the minimum detectable effect, is false positive rate, and is power. -
Minimum detectable effect should be product-relevant, not just statistically convenient. If
profile_completion_rateis 40%, a 0.05 percentage-point lift may be detectable at LinkedIn scale but operationally meaningless; a 1–2 percentage-point lift may justify launch depending on downstream value. -
Variance reduction improves sensitivity without increasing traffic. CUPED uses a pre-experiment covariate to adjust outcome :
This is useful for stable member behaviors like historical engagement, prior apply rate, or previous message response rate. -
Sequential testing is risky if you repeatedly peek and stop when p-value < 0.05. Use pre-planned methods such as alpha spending, group sequential tests, or always-valid confidence intervals. Otherwise, “checking every day” inflates false positives and produces fragile launch decisions.
-
Multiple testing matters when examining many segments, metrics, or variants. If you test by city, industry, seniority, and device, some significant results will occur by chance. Use Bonferroni correction, Benjamini-Hochberg false discovery rate, or declare subgroup analyses exploratory unless pre-registered.
-
Heterogeneous treatment effects are common on LinkedIn. A job recommendation update may help active job seekers but hurt passive candidates; an online indicator may increase replies for close connections but feel invasive for weak ties. Report both aggregate effect and key pre-specified segment effects with confidence intervals.
-
Simpson’s paradox appears when aggregate and segment-level results conflict due to composition differences. If treatment has more high-activity members or more large cities, aggregate metrics can reverse. Diagnose by checking randomization balance, stratifying by baseline covariates, and estimating weighted or regression-adjusted effects.
-
Interference and network effects violate standard A/B assumptions. Messaging, feed ranking, and job marketplaces can have spillovers: one member’s treatment changes another member’s experience. Consider cluster randomization, geo-level tests, switchback designs, or marketplace-side guardrails when interactions are material.
-
Experiment validity checks come before interpreting impact. Verify sample ratio mismatch, exposure logging consistency, pre-treatment covariate balance, missing outcome rates, and novelty effects. A statistically significant lift is not credible if assignment proportions are off or exposure only happened for a biased subset.
Worked example
For Design Experiments for Email Campaign & Messaging Update, a strong candidate starts by clarifying whether the email campaign and messaging update are independent product surfaces or could interact through member attention. In the first 30 seconds, they would ask: “What is the primary business goal: more conversations, more replies, more sessions, or downstream job outcomes? Are we optimizing member engagement, recruiter success, or both? Can the same member receive both treatments?” Then they would propose a factorial design if both changes can run simultaneously: control, email only, messaging only, and email plus messaging.
The answer skeleton should have four pillars: metric definition, randomization and exposure, power and duration, and interpretation. For metrics, they might choose message_reply_rate or qualified_conversation_starts as primary, with guardrails like unsubscribe_rate, spam_report_rate, and notification_disable_rate. For design, they would randomize at member level if spillovers are limited, but consider cluster or sender-level randomization if messaging behavior creates peer effects. For power, they would estimate baseline conversion, minimum detectable effect, expected eligible traffic, and whether interaction effects require a larger sample than main effects.
A specific tradeoff to flag: a factorial design is efficient for detecting main effects, but detecting the email-by-messaging interaction may require substantially more sample, so the team should decide whether interaction is a must-have decision criterion. They should also mention sequential monitoring: daily dashboards are fine for data quality and guardrails, but launch decisions should follow a pre-specified stopping rule. A strong close would be: “If I had more time, I’d add heterogeneity analysis by member activity, connection strength, and prior email engagement, but I’d label those as exploratory unless we powered them in advance.”
A second angle
For Resolve Conflicting A/B Test Results in Cities, the same principles apply, but the center of gravity shifts from initial design to causal diagnosis. The candidate should not simply average city-level lifts or pick the largest city result; they should ask whether the estimand is the national member-level effect, the average city effect, or the effect for a launch market. Conflicts across cities may reflect heterogeneous treatment effects, seasonality, sample imbalance, different baseline usage, or marketplace density. A strong answer would compare stratified estimates, check covariate balance within cities, compute a pooled regression with city fixed effects, and explain whether the decision should be global launch, targeted launch, or follow-up experiment. The key difference is that segmentation is no longer just a readout; it directly affects the causal interpretation and product rollout decision.
Common pitfalls
Pitfall: Treating statistical significance as the launch criterion.
A tempting answer is: “If p < 0.05, ship; otherwise don’t.” That misses effect size, metric hierarchy, guardrails, power, and business value. A better answer says launch requires a practically meaningful lift on the primary metric, no unacceptable harm to guardrails, and credible experimental validity.
Pitfall: Ignoring the randomization unit.
Many candidates say “randomly split users 50/50” without considering spillovers. For recommendations, messaging, and online indicators, one treated member can affect another member’s outcomes. Interviewers expect you to call out interference risk and propose member-level, sender-level, cluster-level, or marketplace-level randomization depending on the product surface.
Pitfall: Over-indexing on formulas without product framing.
Power equations are useful, but a Data Scientist must also justify the baseline, MDE, eligible population, ramp plan, and decision rule. Saying “we need larger sample size for smaller effects” is not enough; stronger answers quantify the tradeoff and connect it to DAU, conversion rate, experiment duration, and launch cost.
Connections
Interviewers may pivot from this topic into causal inference, especially matching, difference-in-differences, or instrumental variables when randomization is unavailable. They may also move into metric design, recommender evaluation, marketplace health, or diagnosing experiment anomalies such as sample ratio mismatch and segment-level reversals.
Further reading
-
Trustworthy Online Controlled Experiments by Kohavi, Tang, and Xu — Practical reference for experiment design, pitfalls, metrics, and interpretation at internet scale.
-
Controlled experiments on the web: survey and practical guide by Kohavi, Henne, and Sommerfield — Classic paper on online experimentation failure modes, power, and organizational practices.
-
Experimentation Works by Stefan Thomke — Useful for understanding how rigorous experimentation connects to product decision-making and organizational learning.
Featured in interview prep guides
Practice questions
- Decide best email variant using stratified A/B analysisLinkedIn · Data Scientist · Technical Screen · medium
- Improve Profile Completion RateLinkedIn · Data Scientist · Onsite · medium
- Evaluate 'Job You May Be Interested In' RecommenderLinkedIn · Data Scientist · Onsite · hard
- Resolve Conflicting A/B Test Results in CitiesLinkedIn · Data Scientist · Technical Screen · medium
- Design Experiments for Email Campaign & Messaging UpdateLinkedIn · Data Scientist · Onsite · hard
- Predict Impact of 'Online Indicator' FeatureLinkedIn · Data Scientist · Onsite · medium
- Evaluate an email test with confoundingLinkedIn · Data Scientist · Technical Screen · medium
Related concepts
- A/B Testing And Experiment DesignAnalytics & Experimentation
- A/B Testing And Experiment DesignAnalytics & Experimentation
- A/B Testing And Experiment DesignAnalytics & Experimentation
- A/B TestingAnalytics & Experimentation
- A/B Testing And Causal ExperimentationAnalytics & Experimentation
- A/B TestingAnalytics & Experimentation