Pinterest Data Scientist Interview Prep Guide
Everything Pinterest actually asks Data Scientist candidates — concept walkthroughs, worked examples, and the real interview questions, drawn from candidate reports. Free to read.
Last updated
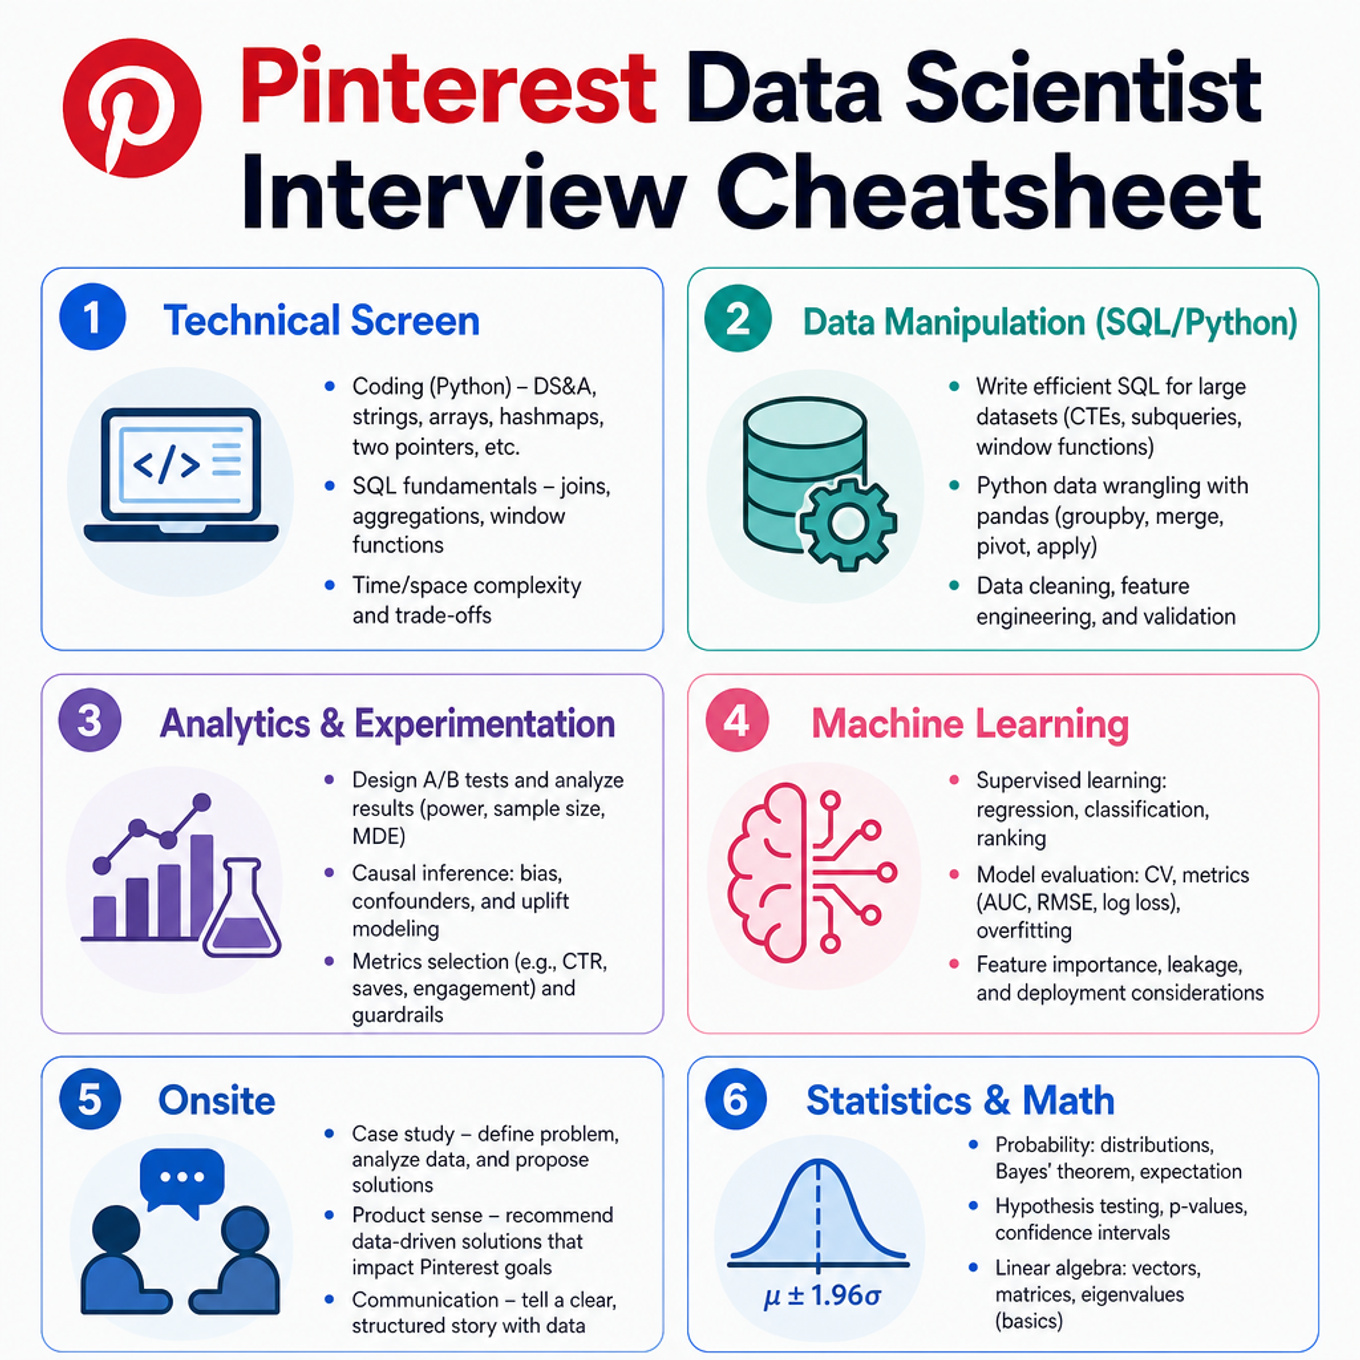
Technical Screen
Data Manipulation (SQL/Python)
-
SQL Analytical Querying — covered in depth under Onsite below.
-
Pandas Data Wrangling — covered in depth under Onsite below.
Analytics & Experimentation
-
A/B Testing — covered in depth under Onsite below.
-
Causal Inference And Quasi-Experiments — covered in depth under Onsite below.
-
CTR And Engagement Metrics — covered in depth under Onsite below.
Machine Learning
-
Recommender Systems And Feed Ranking — covered in depth under Onsite below.
-
Machine Learning Project Lifecycle — covered in depth under Onsite below.
Onsite
Data Manipulation (SQL/Python)
What's being tested
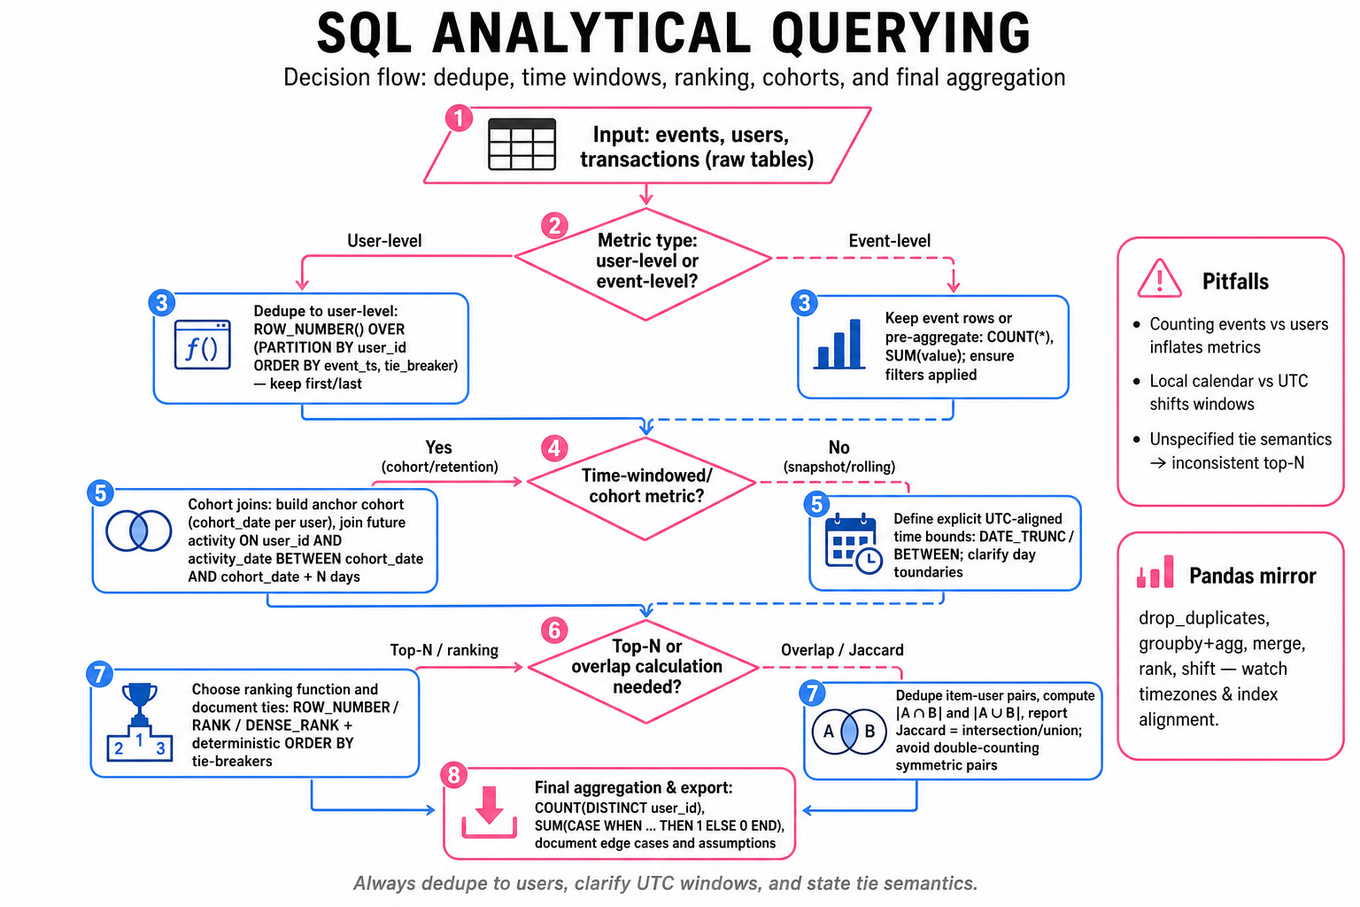
Analytical querying for product data: turning raw event, user, and transaction tables into retention, revenue, ranking, overlap, and cohort metrics. Interviewers are probing whether you can write correct SQL/pandas under ambiguity: dedupe events, define time windows, handle ties, and explain metric edge cases.
Patterns & templates
-
Window functions like
ROW_NUMBER() OVER (PARTITION BY user_id ORDER BY event_ts)dedupe or select first/last events; always add deterministic tie-breakers. -
Cohort joins for retention: build an anchor cohort, join future activity on
user_id, constrain dates withBETWEEN, then aggregate by cohort day. -
Conditional aggregation with
SUM(CASE WHEN ... THEN 1 ELSE 0 END)orCOUNT(DISTINCT CASE WHEN ... THEN user_id END)for segmented metrics. -
Top-N ranking uses
RANK,DENSE_RANK, orROW_NUMBER; choose based on tie behavior and state the business implication. -
Set overlap / Jaccard: dedupe item-user pairs, self-join by entity, compute ; avoid double-counting symmetric pairs.
-
pandasgroupby pipelines mirrorSQL:drop_duplicates,groupby,agg,merge,rank,shift; watch index alignment and timezone-aware timestamps. -
Binary search over ordered logs is
O(log n)probes when records are date-sorted; inSQL, compose bounded queries instead of scanning all dates.
Common pitfalls
Pitfall: Counting events instead of users will inflate retention, active-user, and conversion metrics when users generate multiple rows.
Pitfall: Using local calendar dates without clarifying
UTCboundaries can shift next-day retention and revenue windows.
Pitfall: Forgetting tie semantics in top-category queries leads to inconsistent results; explicitly choose
RANK,DENSE_RANK, orROW_NUMBER.
Practice these
The practice cards below cover the canonical variants — solve all of them and time yourself.
Practice questions
What's being tested
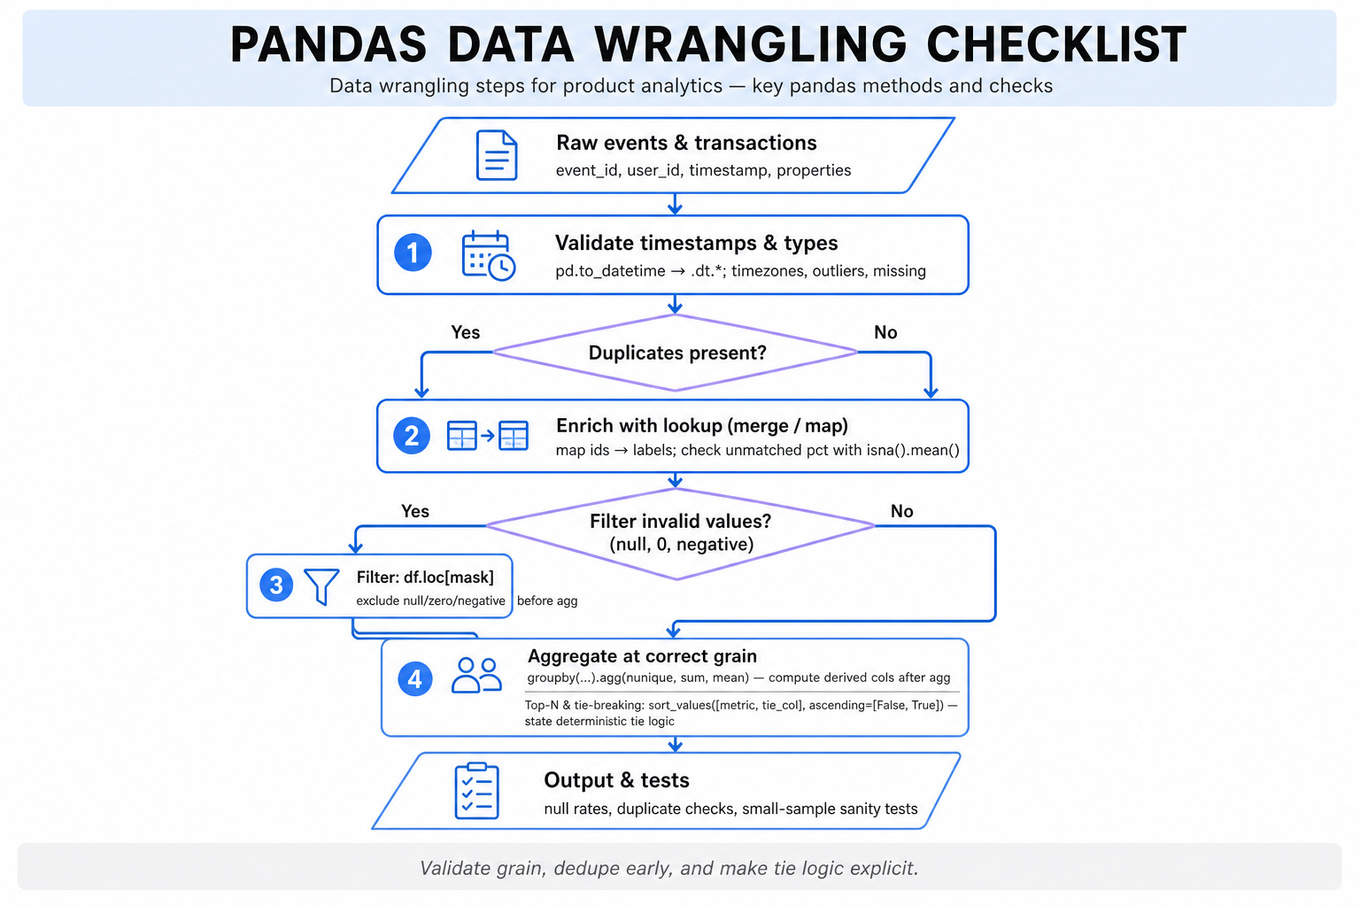
These exercises test pandas data wrangling for product analytics: cleaning event/transaction data, deduplicating records, joining lookup tables, and producing grouped metrics. Interviewers are probing whether you can translate ambiguous metric logic into reliable pandas code that handles nulls, ties, timestamps, and category mappings without overengineering.
Patterns & templates
-
Filter-then-aggregate — use
df.loc[mask]beforegroupby; exclude null, zero, or negative values before computingmean,sum, or rates. -
Lookup enrichment — join IDs to readable labels with
merge,map, or dictionary lookup; validate unmatched IDs withisna().mean(). -
Deduplication before metrics — use
drop_duplicates(subset=[...])orsort_values(...).drop_duplicates(..., keep='last'); wrong grain creates inflated counts. -
Grouped summaries —
groupby(...).agg(...)with named aggregations; computenunique,mean,sum, and derived columns after aggregation. -
Top-N and tie-breaking — prefer
sort_values([metric, tie_col], ascending=[False, True]).head(n); state deterministic tie logic explicitly. -
Nested data flattening — use
explodefor lists,pd.json_normalizefor dicts, andapply(lambda x: ...)only when vectorization is awkward. -
Time-window metrics — convert with
pd.to_datetime, use.dt.date,Timedelta, and self-joins or shifted dates for next-day retention.
Common pitfalls
Pitfall: Computing averages at the wrong grain, such as averaging user-level averages instead of event-level time unless the prompt explicitly asks for equal user weighting.
Pitfall: Forgetting to deduplicate shopping or pin events before
count, which silently turns repeated logs into fake engagement.
Pitfall: Using row-wise
applyeverywhere; it may pass small examples but signals weak pandas fluency whengroupby,merge,explode, or vectorized masks are cleaner.
Practice these
The practice cards below cover the canonical variants — solve all of them and time yourself.
Practice questions
Analytics & Experimentation
What's being tested
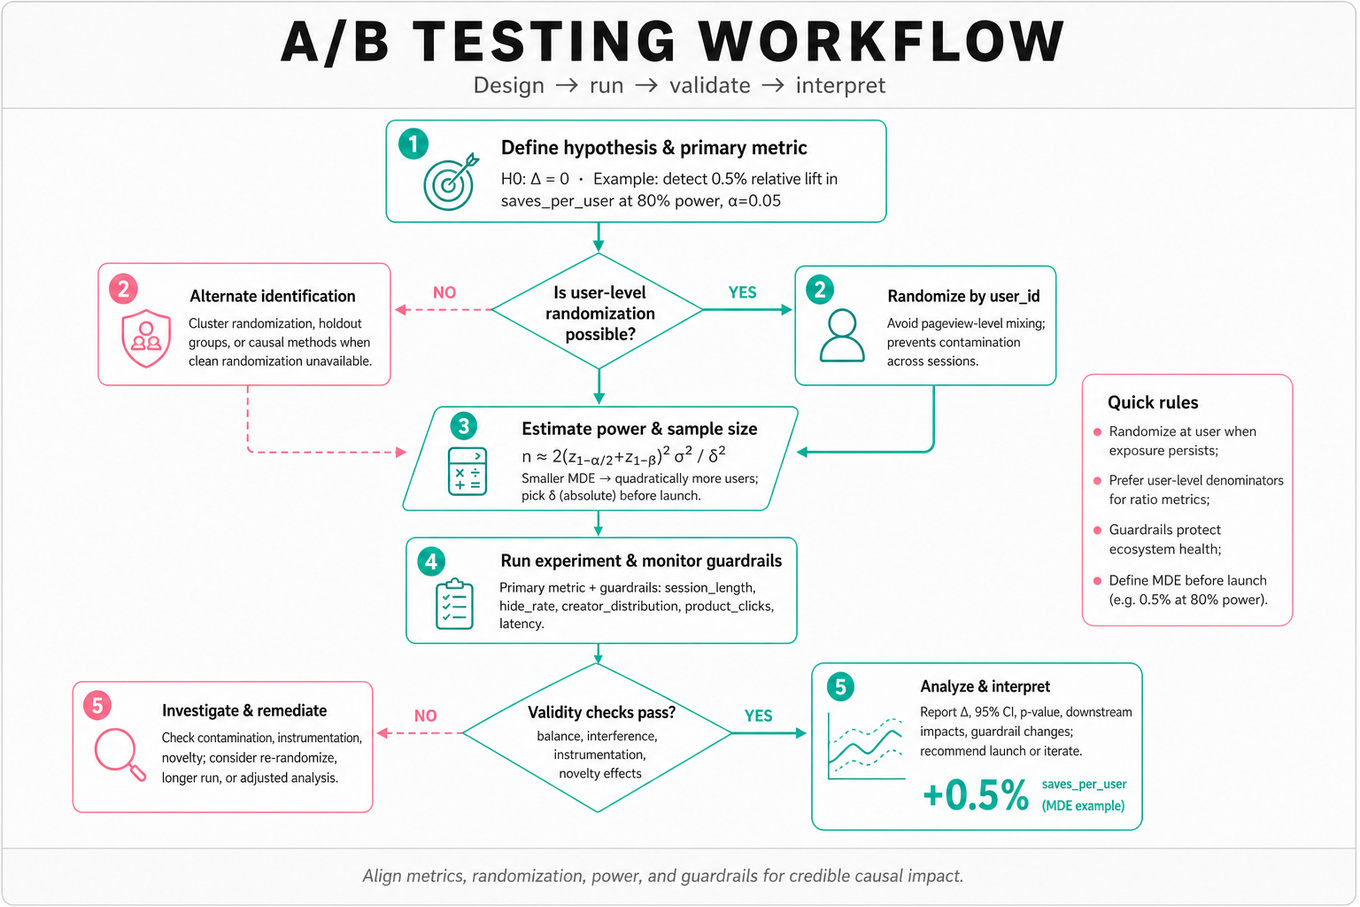
Interviewers are probing whether you can design, diagnose, and interpret online experiments for ranking, feed, video, shopping, and homepage surfaces where user behavior is noisy and product decisions are high-stakes. For Pinterest, a Data Scientist must connect statistical rigor to user value: a feed-ranking change may increase CTR while hurting long-term saves, creator diversity, or shopping intent. You are expected to define metrics, choose the right randomization unit, estimate power, detect experiment validity issues, and explain causal impact clearly. You may also be asked what to do when clean randomization is unavailable, which tests your ability to reason about causal identification rather than just run a t-test.
Core knowledge
-
Randomized controlled trials estimate causal effects by making treatment independent of potential outcomes: . For Pinterest surfaces, randomize at the
user_idlevel when exposure persists across sessions; pageview-level randomization can create contamination if users see mixed feed experiences. -
Primary metrics should map to the product hypothesis. For a feed-ranking algorithm, candidates might use
engaged_sessions_per_user,saves_per_user,closeups_per_user, orrepins_per_user; for video pins,video_starts,watch_time, completion rate, and downstream saves may matter more than raw impressions. -
Guardrail metrics protect against local wins that harm the ecosystem. Common Pinterest-style guardrails include
session_length,hide_rate,report_rate,creator_distribution,search_return_rate,notification_unsub_rate, latency-sensitive engagement, and shopping funnel health such asproduct_clicksorcheckout_intent. -
Hypothesis framing should be explicit: null versus alternative or . Define the minimal detectable effect before launch, e.g., “detect a 0.5% relative lift in saves per user at 80% power and .”
-
Power and sample size depend on variance, baseline rate, significance level, and MDE. For a mean metric, approximate per-arm sample size is where is the absolute MDE. Smaller MDEs require quadratically more users.
-
Ratio metrics like
CTR = clicks / impressionsrequire care because numerator and denominator are both affected by ranking. Prefer user-level aggregation, delta method, bootstrap, or cluster-robust standard errors rather than treating every impression as independent. -
CUPED can reduce variance by adjusting for pre-experiment behavior: , where is a pre-period covariate and . It works well for stable user-level metrics like historical saves or prior engagement.
-
Sample ratio mismatch is a validity red flag: if traffic is intended 50/50 but observed assignment is 49/51 with large , run a chi-square test. Causes may include targeting filters, logging gaps, eligibility rules, or assignment bugs; do not interpret treatment effects until the mismatch is explained.
-
Multiple testing inflates false positives when slicing by many metrics or segments. Pre-register one primary metric, treat secondary metrics as diagnostic, and use methods such as Bonferroni correction, Benjamini-Hochberg FDR, or hierarchical decision rules when many comparisons drive launch decisions.
-
Heterogeneous treatment effects matter for Pinterest because new users, power users, creators, shoppers, and video-heavy users may respond differently. Segment analysis should be hypothesis-driven; avoid “segment fishing” unless clearly labeled exploratory and validated in a follow-up experiment.
-
Novelty and learning effects can distort short-term results. A new shopping module may initially attract curiosity clicks but not durable purchase intent; a ranking change may need days for users and models to adapt. Consider ramp duration, burn-in windows, and cohort-based readouts.
-
Non-randomized causal methods require identification assumptions. Without a control group, use difference-in-differences, synthetic control, interrupted time series, propensity score weighting, or matched controls, but clearly state assumptions like parallel trends, no concurrent shocks, and stable treatment exposure.
Worked example
For “Evaluate New Feed-Ranking Algorithm with A/B Testing”, a strong candidate would start by clarifying the product goal: is the new ranker optimizing engagement, long-term retention, content relevance, shopping intent, or creator ecosystem quality? They would ask about eligible users, exposure surface, rollout constraints, and whether the model changes only ranking or also candidate generation. The answer can be organized around four pillars: experiment design, metric framework, statistical plan, and diagnostics.
For design, randomize at the user_id level to avoid within-user contamination and keep treatment sticky across sessions. For metrics, choose one primary metric such as saves_per_user or engaged_sessions_per_user, plus guardrails like hide_rate, report_rate, session_length, and content diversity. For the statistical plan, define the MDE, estimate sample size using historical variance, and specify the inference method, likely user-level difference in means with CUPED if pre-period engagement is predictive. For diagnostics, check sample ratio mismatch, event logging sanity, exposure rates, pre-period balance, and whether treatment actually changed ranking outputs such as average rank position or content mix.
One tradeoff to flag is that CTR may improve if the ranker promotes clickbait-like pins, while saves or long-term return behavior may worsen; therefore, launch criteria should not rely on a single shallow engagement metric. A polished close would be: “If I had more time, I’d inspect heterogeneous effects for new versus retained users and run a longer holdout or follow-up to measure durability.”
A second angle
For “Recover causal effect without a control group”, the same experimentation mindset applies, but the central issue shifts from randomization to identification. Instead of saying “just compare before and after,” a strong candidate would ask whether there is a plausible untreated comparison: unaffected geographies, ineligible users, similar surfaces, or historical time periods. If no direct control exists, they might propose interrupted time series with seasonality controls, synthetic control built from comparable cohorts, or difference-in-differences if a credible comparison group can be found. The answer should emphasize assumptions and validation: pre-trend checks, placebo intervention dates, negative-control metrics, and sensitivity to concurrent launches. The conclusion should be probabilistic rather than overconfident, because observational estimates are usually less defensible than a clean randomized test.
Common pitfalls
Pitfall: Treating impressions as independent observations.
A tempting but wrong answer is to run a two-proportion z-test on all pin impressions and declare significance from millions of rows. The better approach is to aggregate to the randomization unit, usually user_id, because repeated impressions from the same user are correlated and the treatment is assigned at the user level.
Pitfall: Optimizing for the metric that moved instead of the metric that matters.
Candidates often say “CTR increased, so launch,” without asking whether the change harmed saves, long-term retention, shopping conversion quality, or negative feedback. A stronger answer separates the primary decision metric, secondary diagnostics, and guardrails, then explains how conflicting movements would be adjudicated.
Pitfall: Hand-waving causal inference when no control exists.
For no-control scenarios, “use regression” is not enough. Interviewers want to hear the identification assumption, why it might be plausible, how you would test it with pre-trends or placebo checks, and what uncertainty remains after the analysis.
Connections
This topic often pivots into metric design, causal inference, ranking evaluation, product analytics, and sequential testing. Be ready to discuss how offline recommender metrics like NDCG, calibration, or relevance labels relate imperfectly to online A/B outcomes, and how to diagnose metric movements by cohort, funnel stage, and content type.
Further reading
-
Trustworthy Online Controlled Experiments — Kohavi, Tang, and Xu — Practical reference for experiment design, diagnostics, variance reduction, and organizational decision-making.
-
Causal Inference: The Mixtape — Scott Cunningham — Clear treatment of difference-in-differences, synthetic control, matching, and observational causal assumptions.
-
Controlled Experiments on the Web: Survey and Practical Guide — Kohavi et al. — Seminal paper on web experimentation pitfalls including SRM, metrics, and online testing practice.
Practice questions

What's being tested
Causal inference and quasi-experimental reasoning test whether you can estimate “what would have happened otherwise” when Pinterest cannot run a clean randomized experiment, or when an A/B test has complications. Interviewers are probing whether you can separate correlation from causation, define a credible counterfactual, choose metrics like CTR, saves, repins, session_length, or long_clicks, and explain assumptions clearly. Pinterest cares because feed ranking, home surface changes, and video-pin launches can affect user engagement, creator distribution, and long-term retention in ways that are hard to evaluate from raw metric movement alone. A strong Data Scientist answer combines statistical identification, experiment hygiene, metric interpretation, and product-aware diagnostics.
Core knowledge
-
Randomized controlled trials are the gold standard because treatment assignment is independent of potential outcomes: . For feed or homepage changes, define the unit of randomization carefully: user-level randomization avoids cross-session contamination, while item-level randomization can create interference.
-
Average treatment effect is usually framed as , but in product experiments you often estimate an intent-to-treat effect: impact of assignment, not necessarily exposure. This matters when only some users assigned to a new video-pin module actually see it.
-
Difference-in-differences estimates causal impact using pre/post changes between treated and comparison groups:
Its key assumption is parallel trends: absent treatment, groups would have moved similarly. -
Synthetic control builds a weighted combination of untreated groups to match the treated unit’s pre-period trajectory. It is useful when one surface, geography, cohort, or platform receives a homepage change. It needs enough pre-period data and a donor pool not affected by spillovers.
-
Interrupted time series can be used when there is no control group, modeling a level or slope break at launch time. It is weaker than
DiDbecause it assumes no simultaneous shocks, seasonality shifts, logging changes, marketing campaigns, or ranking updates affected the same metrics. -
Propensity score methods estimate treatment probability from observed covariates, then use matching, stratification, or inverse probability weighting. They help with observational exposure, but only adjust for observed confounders; unmeasured intent or creator quality can still bias estimates.
-
Regression adjustment uses models like linear regression, logistic regression, or doubly robust estimators to control for pre-treatment covariates such as historical
sessions_per_user, priorsaves, country, device, and tenure. Never control for post-treatment variables like post-launch engagement path or exposure depth. -
CUPED reduces variance in A/B tests using a pre-treatment covariate: , where . It is powerful for
Pinterestmetrics with strong user-level autocorrelation, such as historical engagement or save propensity. -
Power and MDE connect sample size to detectable lift. For a difference in means, roughly . For low-base-rate metrics like
video_save_rate, small relative lifts may require long runtimes or aggregated user-level outcomes. -
Experiment diagnostics are not optional: check sample ratio mismatch, pre-period balance, missing metric events, exposure imbalance, novelty effects, day-of-week seasonality, and guardrail regressions. A statistically significant lift is not trustworthy if assignment, logging, or eligibility was biased.
-
Metric design should separate primary success metrics, guardrails, and diagnostics. For
Pinterest, a launch might optimizesaves_per_userorlong_click_rate, guardrailhide_rate,unfollow_rate,latency, or7d_retention, and inspect diagnostics by platform, country, content type, and user tenure. -
Uncertainty quantification should match the design. Use user-level standard errors for user-randomized experiments, cluster-robust errors for geo or creator-level treatments, bootstrap for complex ratio metrics, and multiple-testing corrections such as Bonferroni or Benjamini-Hochberg when slicing many cohorts.
Worked example
For Investigate Homepage Experiment Without Control Group: Methods and Metrics, a strong candidate starts by saying: “I’d first clarify what changed, when it launched, who was eligible, whether rollout was staggered, and what decision we need to make: estimate causal impact, diagnose metric movement, or decide whether to keep the module.” They would define the unit of analysis, likely user-day or user-week, and distinguish assigned users from actually exposed users to avoid conditioning on treatment-induced behavior. The answer can be organized into four pillars: first, metric definition; second, causal identification strategy; third, validation and falsification; fourth, segmentation and product diagnosis.
For metrics, they might propose homepage_engaged_sessions, pin_saves_per_user, outbound_click_rate, hide_rate, and 7d_retention, with one primary metric and several guardrails. For identification, if there is no randomized control, they would look for a natural comparison: unaffected countries, platforms, tenure cohorts, or users below an eligibility threshold, then use difference-in-differences or synthetic control. If no comparison exists, they would use interrupted time series, but explicitly label it weaker and spend more time ruling out concurrent shocks. A key tradeoff is bias versus variance: a tightly matched comparison cohort may be smaller and noisier, while a broader comparison group has more power but weaker parallel-trends credibility. They would validate using pre-trend plots, placebo launch dates, placebo metrics that should not move, and cohort balance on historical engagement. They would close by saying: “If I had more time, I’d test robustness across multiple counterfactual methods and estimate heterogeneous effects for new versus power users, mobile versus web, and video-heavy versus shopping-heavy sessions.”
A second angle
For Evaluate New Feed-Ranking Algorithm with A/B Testing, the same causal logic applies, but the design should start from randomized assignment rather than observational recovery. The candidate should frame the estimand as the causal effect of assignment to the new ranking algorithm on user-level metrics like saves_per_session, long_click_rate, session_depth, and 7d_retention. The emphasis shifts toward experiment design: unit of randomization, power, MDE, ramp plan, sample ratio mismatch, novelty effects, and guardrails such as hide_rate or creator-side distribution. Quasi-experimental methods still matter if the A/B test is compromised: for example, if treatment traffic was accidentally overrepresented on iOS, regression adjustment, reweighting, or stratified analysis can help diagnose sensitivity. The strongest answer makes clear that clean randomization beats post-hoc adjustment, but good diagnostics determine whether the randomized estimate is credible.
Common pitfalls
Pitfall: Treating pre/post movement as causal.
A tempting weak answer is: “The homepage metric rose 4% after launch, so the treatment caused a 4% lift.” That ignores seasonality, marketing campaigns, ranking changes, creator supply shifts, and user mix changes. A better answer defines a counterfactual and explains why its assumptions are plausible or not.
Pitfall: Jumping to methods without clarifying the estimand.
Candidates often list DiD, synthetic control, propensity matching, and regression without saying what effect they are estimating. Interviewers want to hear whether you mean effect of assignment, exposure, treatment-on-treated, short-term engagement, or long-term retention. Start with the decision and metric, then choose the method.
Pitfall: Overclaiming from observational adjustment.
Propensity scores and regressions can sound rigorous, but they do not solve unobserved confounding. For example, users who see more video pins may already prefer video, so higher engagement among exposed users is not automatically causal. Strong candidates discuss sensitivity checks, negative controls, placebo tests, and the limits of the evidence.
Connections
Interviewers may pivot from here into A/B testing, metric design, power analysis, ranking evaluation, or heterogeneous treatment effects. They may also ask how you would combine offline model metrics like NDCG or AUC with online product metrics such as saves, CTR, and retention. Be ready to explain when a randomized experiment is necessary versus when a quasi-experiment is acceptable.
Further reading
-
Trustworthy Online Controlled Experiments — Kohavi, Tang, and Xu — practical reference for A/B testing, diagnostics, metrics, and decision-making.
-
Causal Inference: The Mixtape — Scott Cunningham — accessible coverage of
DiD, synthetic control, regression discontinuity, and causal assumptions. -
Mostly Harmless Econometrics — Angrist and Pischke — deeper treatment of identification strategies and applied causal inference.
Practice questions

What's being tested
Pinterest Data Scientists are expected to reason about CTR, engagement quality, and experiment validity in ranking-heavy surfaces such as the home feed, carousels, Shopping, fresh content, and video. Interviewers are probing whether you can define metrics precisely, diagnose metric movement causally, separate product impact from logging or mix-shift artifacts, and make a launch recommendation under uncertainty. The strongest answers connect user behavior, recommender-system exposure, statistical inference, and business guardrails without drifting into data pipeline implementation. Pinterest cares because small changes in ranking, surface design, or content mix can move `CTR`, saves, session depth, creator distribution, and long-term retention in opposite directions.
Core knowledge
-
Click-through rate is usually but the unit matters: item-level
`CTR`, user-level average`CTR`, session-level`CTR`, and surface-level`CTR`answer different questions. For experiments, prefer user-level aggregation for inference so high-activity users do not dominate the estimated treatment effect. -
Engagement metrics should separate shallow interaction from value. Pinterest-specific examples include
`pin_clicks`,`saves`,`closeups`, outbound clicks, follows, board adds, video starts, video completes, Shopping product clicks, and return visits. A`+3% CTR`with flat saves and worse hide/report rates may indicate clickbait rather than better recommendations. -
Metric hierarchy should include a primary success metric, diagnostic funnel metrics, and guardrails. For a home carousel, primary could be incremental engaged sessions or saves per user; diagnostics include impressions, carousel visibility, click position, and downstream save rate; guardrails include latency perception, hides, reports, session exits, and creator/content diversity.
-
Exposure definition is often the hardest part. An impression should mean the user had a reasonable chance to see the Pin, module, video, or product, not merely that it was ranked server-side. For a carousel, distinguish module rendered, module in viewport, item impression, click, and post-click engagement.
-
Ranking changes create denominator effects. If a launch increases impressions by showing more content lower in the feed, raw
`CTR`can fall even while total clicks or saves per user rise. Always inspect both rate metrics and volume metrics:`clicks/user`,`impressions/user`,`CTR`,`saves/user`, and`save_rate`. -
Experiment design should randomize at the user level for personalized feeds because a user’s recommendations and engagement history are correlated across sessions. Item-level randomization can contaminate training signals or create inconsistent UX. For social or creator-marketplace effects, consider spillover and whether creator-level or geo-level analysis is needed.
-
Statistical inference should match the metric distribution. Binary clicks can use proportion tests, but engagement per user is often heavy-tailed and zero-inflated; common approaches include user-level means with robust standard errors, bootstrap, winsorization sensitivity checks, or delta method for ratios. For ratio metrics, do not treat clicks and impressions as independent rows.
-
Power and MDE matter before launch. A simplified sample-size formula for two-arm tests is where is the minimum detectable effect. For high-traffic surfaces, tiny
`CTR`changes may be statistically significant but practically irrelevant; define business-relevant thresholds. -
CUPED can improve sensitivity by adjusting for pre-period behavior: Use it when pre-period engagement predicts post-period engagement and treatment does not affect the pre-period covariate. It is especially useful for noisy metrics like saves per user or Shopping clicks.
-
Segmentation is required for diagnosis, not cherry-picking. Common Pinterest cuts include new vs returning users, heavy vs light pinners, logged-in vs logged-out, mobile platform, country, surface entry point, content type, creator cohort, fresh vs evergreen content, video vs static Pins, and shopping-intent users. Segment after confirming the overall experimental read.
-
Novelty and learning effects can distort short experiments. A new carousel or video format may get curiosity clicks that fade, while a ranking model may need time for user feedback loops to stabilize. Examine daily treatment effects, first-session vs repeat-session effects, and retention or repeat engagement over at least one user cycle when possible.
-
Offline ranking metrics are useful but insufficient. Metrics like
`NDCG@K`,`MAP`, calibration, and predicted click AUC can explain model quality, but online metrics capture UI, exploration, position bias, and user intent. A model with better offline`NDCG`can hurt online`CTR`if it over-personalizes, reduces freshness, or shifts content into lower-trust categories.
Worked example
For Diagnose CTR drop after recommendation launch, a strong candidate starts by clarifying: “Was this an A/B test or a full rollout, which surface changed, how is `CTR` defined, and did impressions, clicks, saves, and user mix move at the same time?” Then they state the key assumption: the goal is not to explain lower `CTR` alone, but to determine whether the recommender harmed user value or changed the denominator/content mix.
The answer can be organized into four pillars: metric validation, experiment validity, funnel decomposition, and segmentation. First, verify the definition path: ranked impression, viewport impression, click event, deduping rules, and whether the new recommender changed where impressions are counted. Second, check randomization balance, ramp timing, sample ratio mismatch, and pre-period comparability so the drop is not an assignment artifact. Third, decompose `CTR = clicks / impressions`: did clicks fall, impressions rise, or did position distribution shift toward lower slots? Fourth, slice by user cohort, platform, content type, freshness, position, and query/session intent to identify where the harm concentrates.
A key tradeoff to flag is that lower `CTR` may be acceptable if the launch increases saves per user, long-clicks, Shopping conversions, or retention while reducing low-quality clicks. The candidate should explicitly avoid saying “rollback because `CTR` dropped” without checking guardrails and downstream value. A strong close would be: “If I had more time, I’d run a CUPED-adjusted user-level analysis, inspect daily treatment effects for novelty or model-learning dynamics, and compare offline ranking diagnostics against the online segments where `CTR` fell.”
A second angle
For Design metrics and experiment for Shopping launch, the same concepts apply, but the objective shifts from generic engagement to commercial intent and downstream value. `CTR` on product modules is only an intermediate metric; primary metrics might include product detail clicks per user, merchant outbound clicks, add-to-cart proxies, or shopping-engaged sessions, with guardrails on overall home feed engagement and user trust. The experiment also has stronger heterogeneity: users with shopping intent may benefit while casual browsers may see irrelevant commerce content. The candidate should discuss whether to target the experiment to eligible users, how to measure cannibalization of organic Pin engagement, and how to interpret a `CTR` increase if saves or long-term retention decline.
Common pitfalls
Pitfall: Treating
`CTR`as the business goal.
A tempting answer is “optimize the recommender for higher `CTR` and launch if statistically significant.” That misses Pinterest’s value loop: users click, save, revisit, create boards, follow creators, and sometimes shop. A better answer frames `CTR` as a diagnostic or intermediate metric and pairs it with deeper engagement, retention, quality, and negative-feedback guardrails.
Pitfall: Ignoring denominator and exposure changes.
Many candidates see `CTR` drop and assume recommendations got worse. But a new carousel, fresh-content module, or video treatment can increase lower-intent impressions, shift positions, or expose different users, mechanically lowering rate metrics. Strong candidates decompose clicks and impressions, analyze position-adjusted metrics, and compare per-user volume metrics before making a causal claim.
Pitfall: Communicating a bag of metrics without a decision rule.
Listing `CTR`, saves, clicks, impressions, retention, hides, reports, and revenue is not enough. Interviewers want to hear which metric is primary, which are guardrails, what effect size matters, and what launch decision follows from conflicting outcomes. State a clear hierarchy such as: “Launch if saves per user or shopping-engaged sessions improve without significant degradation in home feed engagement, retention, or negative feedback.”
Connections
Interviewers may pivot from `CTR` and engagement into A/B testing, causal inference, ranking evaluation, metric design, or recommender-system bias such as position bias and selection bias. They may also ask for SQL-style metric computation, but the Data Scientist expectation is to define the analytic logic, aggregation grain, cohorts, and interpretation rather than discuss pipeline architecture.
Further reading
-
Trustworthy Online Controlled Experiments — Kohavi, Tang, and Xu — the standard reference for experiment design, guardrails, sample ratio mismatch, and practical decision-making.
-
Controlled experiments on the web: survey and practical guide — Kohavi et al. — useful for understanding online metric pitfalls, variance, and interpretation.
-
Evaluating Recommendation Systems — Ricci, Rokach, and Shapira, Recommender Systems Handbook — deeper context on offline ranking metrics and why online engagement can diverge from offline model quality.
Practice questions
Machine Learning

What's being tested
Pinterest feed ranking interviews test whether a Data Scientist can evaluate recommender-system changes as causal product interventions, not just as offline model improvements. The interviewer is probing your ability to connect ranking objectives like CTR, saves, long-clicks, hides, and session depth to experiment design, guardrails, segmentation, and model-quality diagnostics. Pinterest cares because Home Feed, Related Pins, and search/recommendation surfaces are high-volume, personalized systems where small ranking changes can shift user satisfaction, creator distribution, and long-term retention. A strong answer shows you can separate “the model is worse” from “the experiment, instrumentation, traffic mix, or metric definition is flawed.”
Core knowledge
-
Feed-ranking objective design starts with the product action you want to optimize:
CTRcaptures immediate interest, while saves, closeups, outbound clicks, long-clicks, hides, and “not interested” actions capture different levels of intent. A Pinterest DS should ask whether the new ranker optimizes short-term engagement or long-term user value. -
Online A/B testing is the gold standard for ranking changes because offline metrics are correlational. Randomize at the user level, keep assignment stable, define primary metrics before launch, and estimate treatment effect as or relative lift .
-
Power and minimum detectable effect matter because feed metrics are noisy and highly skewed. For a two-sample mean comparison, approximate sample size per arm is where is the desired absolute effect. For tiny lifts, required traffic can become very large even at Pinterest scale.
-
Guardrail metrics prevent optimizing one behavior at the expense of user trust or ecosystem health. Typical guardrails include
DAU, retention, session length, hide/report rate, creator impressions concentration, latency-sensitive engagement, and content diversity. ACTRlift with increased hides or lower saves may not be a win. -
Sample-ratio mismatch is a first-line experiment diagnostic. If a 50/50 test receives 47/53 traffic, run a chi-square test on assignment counts before interpreting impact. SRM can indicate logging issues, eligibility differences, ramping bugs, bot filtering asymmetry, or user bucketing problems.
-
Instrumentation validation should compare the event funnel: eligible users, feed impressions, pin impressions, clicks, saves, hides, and downstream sessions. As a DS, you do not design logging infrastructure, but you should query whether metric drops are consistent across independent signals and whether numerator/denominator definitions changed.
-
Offline recommender evaluation is useful but incomplete. Metrics like
AUC, log loss,NDCG@K,MAP@K, recall@K, and calibration error test ranking quality on historical labels, but they suffer from position bias, selection bias, delayed labels, and stale user intent. Offline wins should be treated as launch candidates, not proof of product lift. -
Counterfactual bias is central in recommender systems because users only interact with items the previous policy exposed. If the old ranker rarely showed niche content, historical labels understate its value. Techniques include inverse propensity scoring, randomized exploration buckets, debiasing by position, or careful online experimentation.
-
Ranking metrics differ by surface and slot.
NDCG@Krewards placing relevant items early using but the business interpretation depends on whether relevance is click, save, long-click, or human-labeled quality. Top-slot gains can dominate aggregateCTRwhile hurting diversity lower in the feed. -
Segmentation analysis is required for diagnosing launches. Break down by new versus returning users, geography, device, app version, traffic source, interest category, session depth, creator type, and historical engagement propensity. A global neutral result may hide a harmful effect on new users or a strong win for high-intent users.
-
Model calibration and thresholding matter when predicted scores are combined across objectives. If a model predicts click probability but is poorly calibrated, ranking by raw score may over-promote clickbait-like pins. Calibration can be assessed with reliability curves, expected calibration error, or binned predicted-versus-observed rates.
-
Multi-objective ranking usually combines several predicted outcomes, for example,
score = w1 * P(click) + w2 * P(save) - w3 * P(hide). The DS role is to evaluate whether weight changes improve the intended product metrics and identify tradeoffs; do not drift into model-serving architecture or feature pipeline design.
Worked example
For Evaluate New Feed-Ranking Algorithm with A/B Testing, a strong candidate would start by clarifying the surface, target population, rollout unit, and primary success metric: “Are we evaluating Home Feed for logged-in users, randomized by user, with CTR as primary and saves/hides/retention as guardrails?” In the first 30 seconds, they should state that the ranking algorithm is a product intervention, so the goal is estimating causal impact, not just comparing offline model scores.
The answer can be organized around four pillars: experiment setup, metric framework, statistical analysis, and diagnostics. For setup, propose a user-level randomized A/B test with stable bucketing, mutually exclusive treatment/control groups, a ramp plan, and pre-specified duration based on power. For metrics, choose one primary metric such as click-through rate per feed impression or per user-session, then add secondary metrics like saves, closeups, long-clicks, session depth, and guardrails like hide/report rate and retention.
For statistical analysis, describe estimating absolute and relative lift, confidence intervals, p-values, and correcting for multiple comparisons if many secondary metrics are tested. A specific tradeoff to flag is per-impression versus per-user analysis: per-impression CTR has more observations but violates independence because heavy users contribute many correlated events; per-user aggregation is often cleaner for inference. Diagnostics should include SRM, missing-event checks, novelty effects, pre-period balance, and segment-level heterogeneity. Close by saying that if there were more time, you would inspect long-term metrics and heterogeneous effects, because a feed ranker may increase immediate clicks while reducing user satisfaction over repeat sessions.
A second angle
For Diagnose CTR drop after recommendation launch, the same knowledge applies, but the framing is no longer “design a clean test”; it is “triage a metric regression under uncertainty.” Start by confirming whether the CTR drop is statistically significant, localized to treatment, and aligned with related metrics like impressions, clicks, saves, and hides. Then separate possible causes into measurement issues, traffic/composition shifts, ranking-quality changes, and user-experience tradeoffs. Instead of leading with power calculations, lead with a diagnostic tree: validate instrumentation, compare treatment/control deltas, segment the drop, inspect funnel stages, and reconcile online outcomes with offline evaluation. The best answer avoids assuming the model is bad until assignment, logging, denominator changes, and user mix have been ruled out.
Common pitfalls
Pitfall: Treating offline metrics as sufficient proof of a better recommender.
A tempting answer is “the new model has higher AUC, so ship it.” That misses the fact that recommender labels are policy-biased and product outcomes depend on position, diversity, novelty, and user trust. A better answer says offline metrics justify an experiment, while launch decisions require online causal evidence and guardrails.
Pitfall: Optimizing only for
CTR.
In feed ranking, higher click-through can come from sensational, repetitive, or low-quality recommendations. Pinterest interviewers expect you to discuss saves, long-clicks, hides, reports, retention, and content diversity as balancing metrics. The stronger framing is “CTR is one signal of relevance, not the objective function of the product.”
Pitfall: Giving a generic A/B testing checklist without recommender-specific depth.
A weak response says “randomize, run a t-test, check significance” and stops. A strong response adds SRM, per-user versus per-impression analysis, position bias, novelty effects, heterogeneous treatment effects, and the possibility that different user cohorts experience different ranking-quality changes. The interviewer wants evidence that you understand ranking systems, not just experimentation vocabulary.
Connections
Interviewers may pivot from feed-ranking evaluation into causal inference, especially selection bias, inverse propensity weighting, and heterogeneous treatment effects. They may also ask about metric design, ML model evaluation, calibration, or product analytics debugging when an online metric disagrees with offline model performance.
Further reading
-
“Hidden Technical Debt in Machine Learning Systems” — useful for understanding why model changes can create unexpected product and measurement side effects.
-
“Practical Lessons from Predicting Clicks on Ads at Facebook” — strong applied reference for large-scale prediction, calibration, and ranking tradeoffs.
-
Trustworthy Online Controlled Experiments by Kohavi, Tang, and Xu — canonical book for A/B testing diagnostics, metrics, SRM, and experiment interpretation.
Practice questions
What's being tested
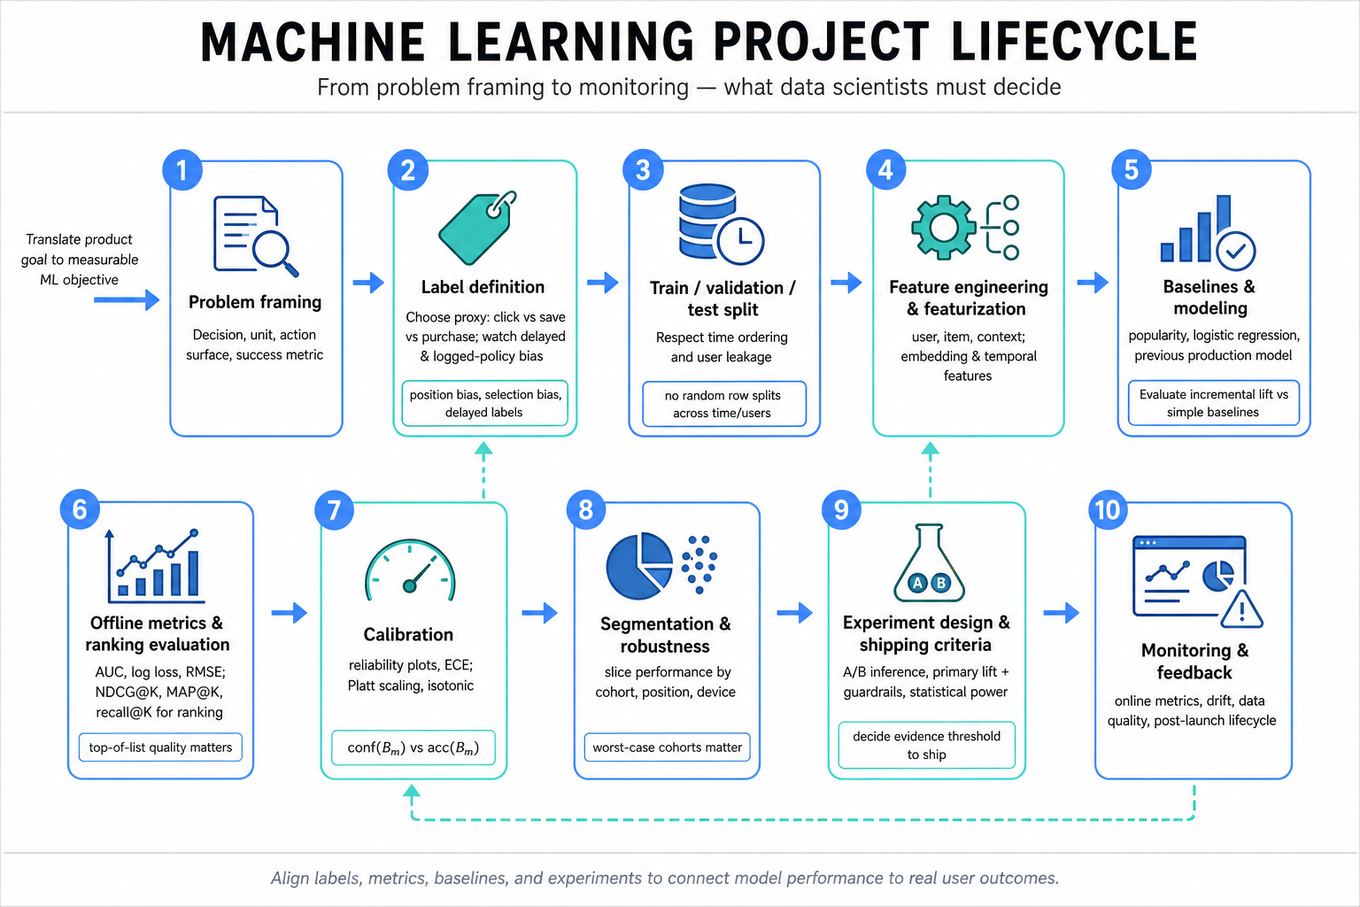
Interviewers are probing whether you can run the machine learning project lifecycle as a Data Scientist: translate a Pinterest-style product problem into a measurable ML objective, evaluate model quality offline, reason about ranking or recommendation tradeoffs, and decide what evidence is strong enough to ship. They care less about whether you can build serving infrastructure and more about whether you can defend choices around labels, features, metrics, baselines, calibration, segmentation, and experiment design. For Pinterest, this matters because recommender and ranking models affect home feed relevance, shopping discovery, ad quality, creator distribution, and long-term user retention. A strong answer shows you can connect model performance to user outcomes without hand-waving away statistical validity or business constraints.
Core knowledge
-
Problem framing comes before modeling: specify the decision being automated, prediction target, unit of prediction, action surface, and success metric. For Pinterest, “predict pin engagement” is weaker than “rank candidate Pins to maximize useful saves/clicks without hurting session satisfaction.”
-
Label definition is often the highest-leverage modeling choice. A click label may optimize curiosity, while saves, long-clicks, hides, purchases, or downstream sessions may better represent value. Watch for delayed labels, position bias, selection bias, and logged-policy bias in recommender data.
-
Offline metrics should match the model task. Use
AUCorlog lossfor binary classification,RMSE/MAEfor regression, andNDCG@K,MAP@K,MRR, or recall@K for ranking. For ranking, top-of-list quality usually matters more than average accuracy. -
Calibration matters when model scores are used as probabilities or combined with business rules. Check reliability plots and expected calibration error; for a probability bin , calibration compares to .
Platt scalingandisotonic regressionare common fixes. -
Baselines should include both simple and production-relevant references. A popularity model, recency heuristic, logistic regression, or previous model version often reveals whether
XGBoost,LightGBM, neural embeddings, or two-tower recommenders are adding real incremental value. -
Train/validation/test splitting must respect time and user leakage. Random row splits can leak future engagement or near-duplicate Pins across sets. For feeds and recommendations, prefer time-based splits and user- or item-aware checks when memorization is plausible.
-
Class imbalance changes evaluation and thresholding. For rare events like purchases or hides, accuracy is misleading; use precision-recall curves,
PR-AUC, lift, cost-weighted loss, or top-K recall. Sampling negatives can help training, but predicted probabilities may need correction. -
Regularization and overfitting controls depend on model family. Logistic regression uses
L1/L2; tree boosting uses max depth, learning rate, subsampling, and early stopping; neural recommenders use dropout, weight decay, and embedding constraints. Always compare train-vs-validation gaps. -
Hyperparameter search should avoid brute-force Cartesian explosion. Grid search with 6 parameters and 10 values each means trials; use random search, Bayesian optimization, successive halving, or targeted sweeps. Generate combinations lazily when enumeration is needed, but prioritize search strategy.
-
Metric tradeoffs are normal and should be explicit. A model may improve
CTRwhile hurting saves, hides, diversity, or creator fairness. For Pinterest, include guardrails such as hide rate, session length quality, fresh content exposure, shopping conversion, and long-term retention. -
Experiment design closes the lifecycle. Offline wins are not launch decisions; propose an
A/B testwith primary metric, guardrails, minimum detectable effect, power, duration, and segmentation. Analyze heterogeneous effects by new users, heavy users, country, platform, and content category. -
Monitoring from a DS lens means tracking model and product metrics after launch, not designing pipelines. Watch score distributions, feature missingness rates, calibration drift,
NDCG@Kproxies, engagement mix, and segment-level regressions to catch changes in user behavior or inventory.
Worked example
For “Explain your ML project end-to-end”, a strong candidate first clarifies the product goal, the prediction surface, and the launch criterion: “Are we ranking home feed Pins, predicting purchase propensity, or prioritizing notifications, and what metric defines success?” They should state assumptions, such as using historical impressions and engagements to train a ranking model, with NDCG@K and online saves/session as core evaluation metrics. The answer can be organized into five pillars: problem framing and metrics, data and labels, model development, evaluation and experimentation, and post-launch analysis.
For data and labels, they would discuss impression logs, user/content features, engagement labels, and biases like position bias or delayed conversions, without drifting into pipeline architecture. For modeling, they might start with logistic regression or gradient-boosted trees as a baseline, then compare against a ranking model optimized for top-K relevance. For evaluation, they would report offline metrics such as AUC, log loss, NDCG@10, calibration, and segment cuts, then explain why offline gains may not translate directly to user value. The key tradeoff to flag is between optimizing short-term clicks and long-term satisfaction: a click-heavy model may promote clickbait Pins, so saves, hides, return rate, or survey-based quality should be guardrails. They would close by saying that, with more time, they would run sensitivity checks on label windows, inspect error slices, estimate business impact, and design an A/B test with power calculations before recommending launch.
A second angle
For “Optimize Hyper-parameter Search to Prevent Combinatorial Explosion”, the same lifecycle thinking appears in the model development phase, but the constraint is computational and statistical efficiency rather than end-to-end storytelling. A Data Scientist should recognize that exhaustive grid search becomes infeasible when the search space grows multiplicatively, and that many hyperparameters contribute unevenly to model quality. A strong answer would propose random search for broad exploration, Bayesian optimization when evaluations are expensive, and early stopping or successive halving to kill weak configurations. The DS angle is not just “generate combinations lazily,” but “spend evaluation budget where it is most likely to improve validation performance while avoiding overfitting to the validation set.” They should also mention holding back a final test set because repeated tuning can leak information through metric peeking.
Common pitfalls
Pitfall: Optimizing the model metric while ignoring the product metric.
A tempting answer is “I chose the model with the highest AUC and shipped it.” That misses the Pinterest reality that ranking quality, user satisfaction, and creator/content ecosystem effects may matter more than a global classifier metric. A stronger answer ties offline metrics to online outcomes and names guardrails.
Pitfall: Describing implementation steps without analytical judgment.
Candidates often list “collect data, train model, deploy model, monitor model” as if the lifecycle were a checklist. Interviewers are looking for why you chose the label, why the split avoids leakage, why the baseline is fair, and what evidence would change your decision. Make tradeoffs explicit rather than narrating generic steps.
Pitfall: Treating hyperparameter search as purely mechanical.
Brute-force grid search sounds systematic but can waste huge compute and overfit the validation set. A better answer narrows ranges using model knowledge, uses random or adaptive search, applies early stopping, and preserves a clean test set for the final estimate.
Connections
Interviewers may pivot from here into recommender-system evaluation, A/B testing and causal inference, metric design, or bias and fairness in ranking systems. They may also ask how you would diagnose a launch where offline NDCG@K improved but online saves or retention declined.
Further reading
-
Rules of Machine Learning — Martin Zinkevich — Practical guidance on launching and iterating ML systems with metrics, baselines, and monitoring.
-
Random Search for Hyper-Parameter Optimization — Bergstra and Bengio, 2012 — Seminal paper explaining why random search often beats grid search under fixed evaluation budgets.
-
Recommender Systems Handbook — Ricci, Rokach, and Shapira — Broad reference for ranking metrics, collaborative filtering, evaluation, and recommender tradeoffs.
Practice questions
Statistics & Math
What's being tested
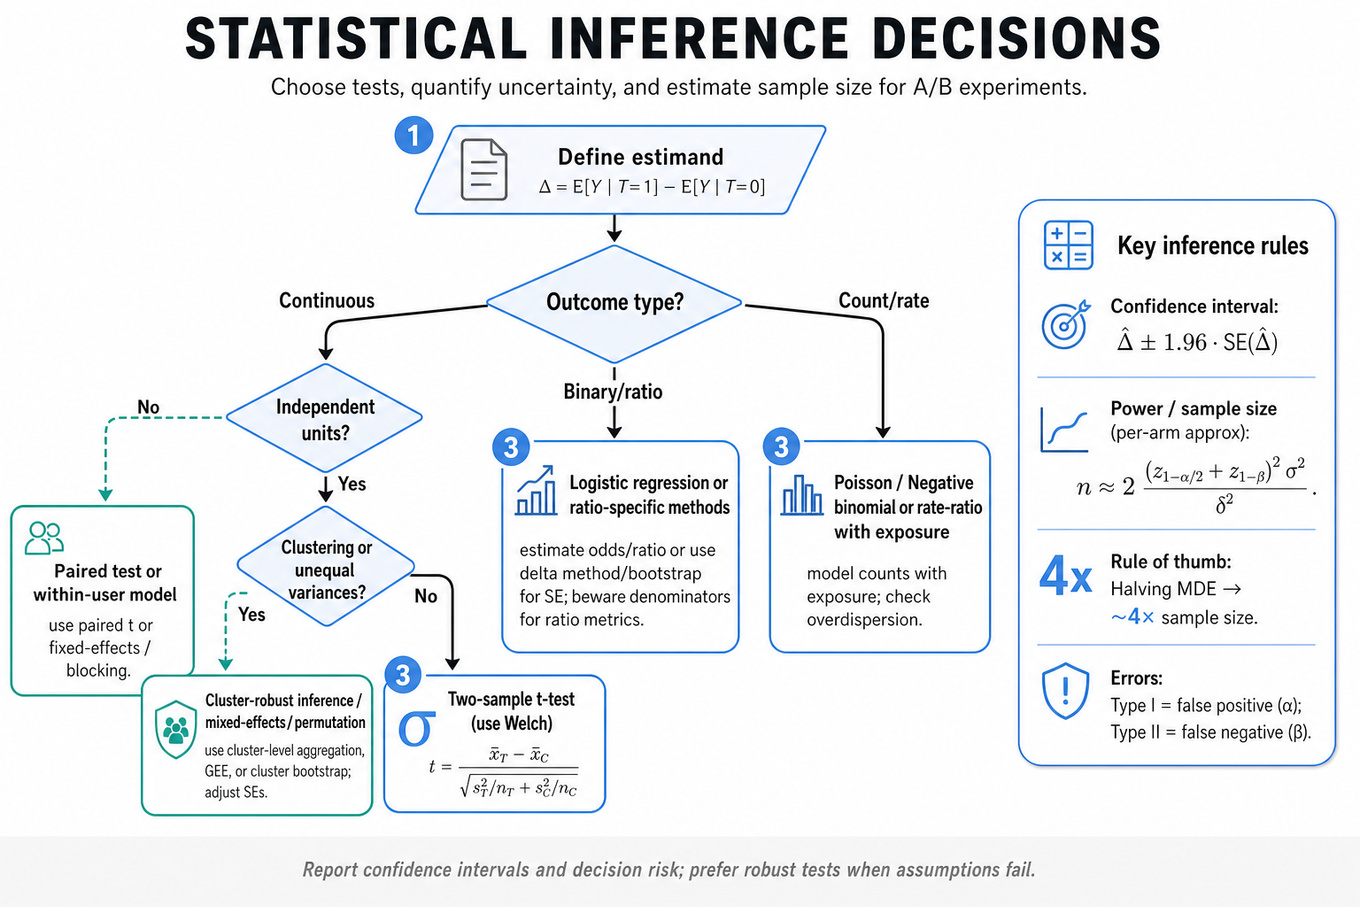
Interviewers are probing whether you can turn messy product or ads measurement problems into valid statistical inference: define the estimand, choose the right test or model, quantify uncertainty, and explain what the result means for a Pinterest decision. For a Data Scientist, this matters because experiments on ranking, recommendations, ads formats, creator surfaces, and notifications often have noisy metrics, heterogeneous users, multiple segments, and business pressure to ship quickly. You are expected to know when a simple two-sample t-test is sufficient, when power or clustering breaks the assumptions, and when bias matters more than variance. Strong answers combine formulas with judgment: “Here is the test, here are the assumptions, here is how I would validate them, and here is how I would communicate the confidence interval and decision risk.”
Core knowledge
-
Null hypothesis testing starts with an estimand, not a test. For an A/B test, define , where
Ycould besave_rate,CTR,revenue_per_user, or7d_retention; then choose the inference method based on assignment unit, outcome type, and dependence. -
Two-sample t-tests compare means using Prefer Welch’s t-test when variances or sample sizes differ; the equal-variance pooled t-test is rarely necessary in product analytics and can be brittle.
-
Confidence intervals communicate effect size and uncertainty better than p-values alone. A 95% CI for a difference in means is approximately ; if the CI is entirely practically positive, that is stronger than merely saying
p < 0.05. -
Power analysis estimates whether the test can detect a meaningful effect. For equal-sized groups, approximate per-arm sample size is where is the minimum detectable effect. Halving MDE requires roughly 4x sample size.
-
Type I error is a false positive; Type II error is a false negative. Standard choices are and power , but Pinterest decisions may require stricter thresholds for high-risk surfaces like ranking changes that affect home feed engagement or advertiser spend.
-
Ratio metrics such as
CTR = clicks / impressionsandconversion_rate = conversions / visitorsare not always simple Bernoulli means. If the denominator varies heavily by user, analyze at the randomized unit level, use the delta method, bootstrap, or regression with robust standard errors. -
Variance reduction methods like CUPED use pre-period covariates to reduce standard error: , with . It is valid when the covariate is pre-treatment and correlated with the outcome.
-
Sequential testing is dangerous if you repeatedly peek and stop when
p < 0.05; this inflates false positives. Use pre-planned looks, alpha spending, group sequential designs, or always-valid methods rather than ad hoc daily decision-making. -
Sample ratio mismatch occurs when observed treatment/control allocation deviates from expected randomization. For a 50/50 split, test counts using a chi-square goodness-of-fit test; SRM can signal logging bugs, eligibility differences, or assignment leakage, and should be investigated before trusting treatment effects.
-
Clustered data violates independent-observation assumptions when units influence each other or share shocks. For ads, households, campaigns, creators, or boards, use cluster-robust standard errors, randomize at the cluster level, or aggregate to the assignment unit before inference.
-
Survey inference requires weighting when sample composition differs from the target population. If a
Pinterestuser survey over-represents one gender, age group, or region, use post-stratification weights, report design effects, and distinguish sampling bias from true subgroup differences. -
Causal lift studies must separate randomized from observational evidence. A Conversion Lift Study can estimate incremental conversions if randomization is clean; observational attribution needs assumptions like ignorability, overlap, and no unmeasured confounding, often supported by matching, regression adjustment, or difference-in-differences.
Worked example
For “Design rigorous A/B test and causal analysis”, start by framing the first 30 seconds around the product decision: “What change are we testing, what is the primary metric, what is the randomization unit, and what launch decision will this support?” Then declare assumptions: users are independently assigned, treatment exposure is logged reliably, and the primary analysis will be intention-to-treat unless noncompliance is central. A strong answer can be organized into four pillars: experiment design, metric choice, power and duration, and validity checks.
For design, specify a user-level randomized controlled trial if the feature affects individual experience, but consider cluster randomization if there is interference through shared boards, creators, ads auctions, or social interactions. For metrics, choose one primary metric such as weekly_active_savers or save_rate, guardrails like hide_rate, session_length, or advertiser ROAS, and predefine segment cuts rather than fishing after results. For power, estimate baseline variance from historical data, choose an MDE that is product-relevant, and compute sample size before launch using the standard normal approximation or simulation for non-normal metrics.
The key tradeoff to flag is speed versus validity: shorter tests reduce opportunity cost but may underpower long-term outcomes, miss weekday seasonality, or overreact to novelty effects. You should explicitly say you would run SRM checks, inspect pre-treatment balance, use CUPED if a strong pre-period covariate exists, and avoid unplanned peeking unless sequential testing was designed up front. Close with: “If I had more time, I would add heterogeneous treatment effect analysis for new versus tenured users and validate whether the online metric movement predicts longer-term retention or marketplace value.”
A second angle
For “Analyze survey with gender imbalance”, the same inference ideas apply, but the main threat shifts from randomization variance to representativeness and bias. Instead of asking whether treatment and control are balanced by design, ask whether the survey sample matches the Pinterest population you want to generalize to across gender, age, geography, device, or engagement level. A naive mean from the survey may be precise but biased if one group is overrepresented and has systematically different responses. The answer should discuss post-stratification or inverse-probability weighting, weighted confidence intervals, and the increased variance from unequal weights. The close should separate descriptive claims about respondents from inferential claims about the broader user base.
Common pitfalls
Pitfall: Choosing a test by metric name instead of data-generating process.
A tempting answer is “use a t-test for means and a z-test for proportions” without asking about randomization unit, denominator variation, clustering, or sample size. A better answer says: “If the unit-level metric is approximately independent and sample size is large, Welch’s t-test is fine; if this is a ratio, clustered, or heavy-tailed metric, I would use unit-level aggregation, robust standard errors, bootstrap, or a transformation.”
Pitfall: Treating statistical significance as the launch decision.
Saying “p-value is below 0.05, so ship” misses practical significance, guardrails, power, novelty effects, and multiple testing. Interviewers want to hear whether the CI excludes effects that are too small to matter, whether business or user risk is asymmetric, and whether the result is stable across pre-specified segments.
Pitfall: Over-explaining formulas while under-explaining assumptions.
It is useful to know the t-statistic, but a DS interview is not a math exam alone. Spend equal time on what could invalidate the estimate: SRM, interference, logging gaps, noncompliance, selection bias, survey nonresponse, repeated peeking, and post-hoc segment mining.
Connections
This topic often pivots into causal inference, especially difference-in-differences, instrumental variables, matching, and regression adjustment when randomization is unavailable. It also connects to metric design, recommender-system evaluation, ads incrementality, and Bayesian experimentation, where the same uncertainty concepts appear with different decision rules.
Further reading
-
Trustworthy Online Controlled Experiments — Practical reference for A/B testing, SRM, guardrails, power, and online experimentation pitfalls.
-
Causal Inference: The Mixtape — Accessible treatment of causal estimands, selection bias, matching, difference-in-differences, and regression-based causal reasoning.
-
Deng, Xu, Kohavi, and Walker, “Improving the Sensitivity of Online Controlled Experiments by Utilizing Pre-Experiment Data” — Original CUPED paper; useful for explaining variance reduction in product experiments.
Practice questions
Behavioral & Leadership
What's being tested
Pinterest behavioral interviews for Data Scientists probe whether you can create measurable impact when the path is ambiguous, cross-functional, and not fully under your authority. Interviewers are listening for ownership, stakeholder influence, analytical judgment, and self-reflection: did you define the right metric, convince Product/Engineering/Design partners, make tradeoffs under uncertainty, and learn from the outcome? For a Pinterest DS, this matters because decisions about `Homefeed`, `Search`, recommendations, ads quality, creator growth, or shopping experiences often involve competing metrics like engagement, retention, relevance, revenue, and user trust. A strong answer is not “I ran an analysis”; it is “I identified the decision, framed the metric risk, aligned stakeholders, drove the experiment or causal readout, and changed the product direction.”
Core knowledge
-
STAR structure is the baseline: Situation, Task, Action, Result. For DS interviews, upgrade it to STAR-M: include Metric. The “Result” should quantify business or product impact, such as
`WAU`, save rate, outbound click-through rate, hide rate, session depth, or revenue lift. -
Ownership means carrying the decision through ambiguity, not merely completing an analysis request. A strong DS clarifies the product decision, defines success and guardrails, identifies analytical risks, communicates uncertainty, and follows through after launch with monitoring or post-analysis.
-
Influence without authority is central because DS rarely owns the roadmap directly. Effective influence comes from crisp problem framing, stakeholder-specific communication, pre-alignment before decision meetings, and translating statistical uncertainty into product risk: “we may be underpowered to detect retention harm below 0.2%.”
-
Metric design should reflect user value and business intent. For Pinterest, a DS might balance primary metrics like
`Pinner saves per session`,`long-click rate`, or`7-day retention`against guardrails like`hide rate`,`report rate`, creator distribution, latency-sensitive engagement, or ad load tolerance. -
Experimentation judgment is often the backbone of leadership stories. Be ready to discuss hypothesis, unit of randomization, power, minimum detectable effect, novelty effects, heterogeneous treatment effects, and launch criteria. The standard error for a mean-based lift is roughly .
-
Causal humility matters when randomized experiments are unavailable. Good answers distinguish correlation from causation, mention confounding and selection bias, and propose alternatives like difference-in-differences, propensity weighting, synthetic controls, regression discontinuity, or sensitivity analysis when appropriate.
-
Ranking and recommender evaluation stories should connect offline and online evidence. Offline gains in
`NDCG`,`MAP`, calibration, or relevance labels are not enough; a DS should explain how they validated user impact through online metrics, segment cuts, and guardrails for low-frequency or new users. -
Segmentation is a leadership tool, not just an analysis technique. When aggregate results are flat, a strong DS checks cohorts such as new vs. retained users, international markets, content verticals, device type, logged-in status, creator size, or shopping intent before recommending launch or rollback.
-
Decision tradeoffs should be explicit. Examples: optimizing short-term clicks may reduce long-term satisfaction; increasing shopping recommendations may help revenue but hurt inspirational discovery; improving average engagement may mask harm to new users. Interviewers want to hear how you made the tradeoff visible.
-
Communication artifacts matter. Strong candidates mention concise experiment readouts, metric trees, decision memos, executive summaries, pre-reads, or dashboard snapshots. The artifact is not the point; the point is that it helped stakeholders converge on a decision with shared assumptions.
-
Resilience and reflection should be specific. If a project failed, explain the incorrect assumption, the signal you missed, how you changed your process, and what you would do differently. Avoid blaming Engineering, Product, data quality, or leadership; show learning and agency.
-
Cultural fit at Pinterest usually rewards customer focus, craft, collaboration, and humility. A DS should connect analysis to Pinner, advertiser, creator, or merchant outcomes rather than only internal metrics. “We improved
`CTR`” is weaker than “we improved discovery quality without increasing hides.”
Worked example
For “Demonstrate leadership with concrete STAR examples”, a strong candidate would first frame the answer in the opening 30 seconds: “I’ll use an example where I led the analytical strategy for a recommendation change, aligned Product and Engineering on launch criteria, and influenced a no-launch decision despite a positive top-line metric.” They should clarify the context briefly: what product surface, what user problem, what decision needed to be made, and what their personal responsibility was as the DS. The skeleton can follow four pillars: first, define the ambiguous product question; second, design the metric and experiment plan; third, manage stakeholder disagreement; fourth, drive the final decision and follow-up.
A concrete answer might describe a `Homefeed` ranking experiment where total engagement increased, but new-user save rate and hide rate worsened. The candidate should explain how they decomposed the top-line lift by cohort, showed that heavy users drove most of the gain, and reframed the launch discussion around long-term retention risk rather than average clicks. One explicit tradeoff to flag: a positive short-term engagement lift may not justify launch if it degrades early user trust or content diversity. The candidate should show influence through actions: pre-briefing the PM, preparing a one-page readout, proposing a revised ramp with stricter guardrails, and partnering with ML/Engineering to test a modified ranking threshold. They should close with the measured result, such as “we avoided launching the first variant, shipped a constrained version two sprints later, and preserved the engagement lift while neutralizing the new-user guardrail.” If they had more time, they could mention adding longer-term retention tracking or a heterogeneous treatment effect model to understand which user segments benefited.
A second angle
For “Assess Cultural Fit and Self-Reflection in Hiring Process”, the same competency shifts from “prove leadership impact” to “show how you think about yourself as a teammate.” The interviewer is less interested in a perfect win and more interested in whether you can name a real weakness, describe feedback you received, and show a changed behavior. A strong answer could discuss over-indexing on analytical rigor early in a project, producing a technically correct but poorly timed analysis that did not help the PM make a roadmap decision. The improved framing would be: “I learned to align on decision deadlines, separate must-have evidence from nice-to-have analysis, and communicate uncertainty earlier.” This still demonstrates ownership, but the emphasis is humility, adaptability, and collaboration rather than only impact.
Common pitfalls
Pitfall: Giving a generic leadership story with no analytical spine.
A tempting answer is, “I coordinated across teams, kept everyone aligned, and delivered the project.” That sounds collaborative but not DS-specific. A stronger version names the metric decision, the causal or experimental uncertainty, the stakeholder conflict, and the quantified product outcome.
Pitfall: Treating stakeholder influence as persuasion instead of decision quality.
Weak answers imply, “I convinced the PM I was right.” Better answers show that you made assumptions explicit, represented tradeoffs fairly, and helped the group choose under uncertainty. Interviewers trust candidates who can say, “My initial hypothesis was wrong, and the evidence changed my recommendation.”
Pitfall: Over-claiming impact from ambiguous evidence.
Do not say a dashboard analysis “caused” a retention increase unless you had a credible causal design. If the evidence was observational, say so, explain the confounders, and describe how you triangulated with experiment results, cohort trends, or robustness checks.
Connections
Interviewers can pivot from this topic into experiment design, metric design, causal inference, ranking evaluation, or product analytics case studies. They may also ask for a failure story, a conflict with a PM or engineer, or a time you recommended not launching despite pressure. Prepare two or three reusable stories that can flex across leadership, ambiguity, conflict, and self-reflection.
Further reading
-
Trustworthy Online Controlled Experiments — Kohavi, Tang, and Xu — Practical grounding for explaining experiment tradeoffs, launch criteria, guardrails, and decision risk.
-
Crucial Conversations — Patterson, Grenny, McMillan, and Switzler — Useful framework for discussing stakeholder conflict without sounding political or adversarial.
-
Radical Candor — Kim Scott — Helpful for framing feedback, self-reflection, and direct but collaborative communication.
Practice questions