Statistical Inference, Power, And Confidence Intervals
Asked of: Data Scientist
Last updated
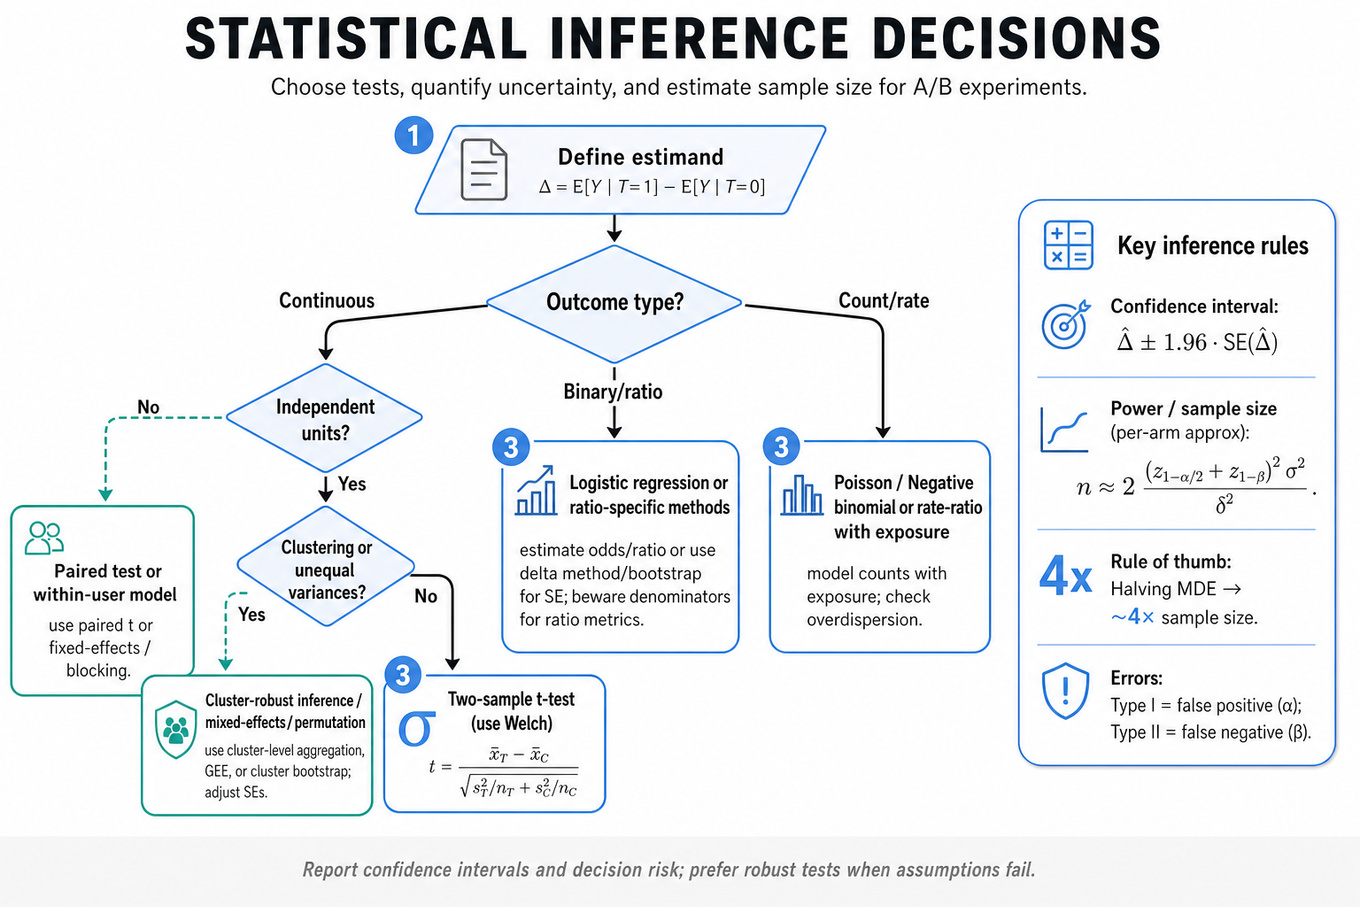
What's being tested
Interviewers are probing whether you can turn messy product or ads measurement problems into valid statistical inference: define the estimand, choose the right test or model, quantify uncertainty, and explain what the result means for a Pinterest decision. For a Data Scientist, this matters because experiments on ranking, recommendations, ads formats, creator surfaces, and notifications often have noisy metrics, heterogeneous users, multiple segments, and business pressure to ship quickly. You are expected to know when a simple two-sample t-test is sufficient, when power or clustering breaks the assumptions, and when bias matters more than variance. Strong answers combine formulas with judgment: “Here is the test, here are the assumptions, here is how I would validate them, and here is how I would communicate the confidence interval and decision risk.”
Core knowledge
-
Null hypothesis testing starts with an estimand, not a test. For an A/B test, define , where
Ycould besave_rate,CTR,revenue_per_user, or7d_retention; then choose the inference method based on assignment unit, outcome type, and dependence. -
Two-sample t-tests compare means using Prefer Welch’s t-test when variances or sample sizes differ; the equal-variance pooled t-test is rarely necessary in product analytics and can be brittle.
-
Confidence intervals communicate effect size and uncertainty better than p-values alone. A 95% CI for a difference in means is approximately ; if the CI is entirely practically positive, that is stronger than merely saying
p < 0.05. -
Power analysis estimates whether the test can detect a meaningful effect. For equal-sized groups, approximate per-arm sample size is where is the minimum detectable effect. Halving MDE requires roughly 4x sample size.
-
Type I error is a false positive; Type II error is a false negative. Standard choices are and power , but Pinterest decisions may require stricter thresholds for high-risk surfaces like ranking changes that affect home feed engagement or advertiser spend.
-
Ratio metrics such as
CTR = clicks / impressionsandconversion_rate = conversions / visitorsare not always simple Bernoulli means. If the denominator varies heavily by user, analyze at the randomized unit level, use the delta method, bootstrap, or regression with robust standard errors. -
Variance reduction methods like CUPED use pre-period covariates to reduce standard error: , with . It is valid when the covariate is pre-treatment and correlated with the outcome.
-
Sequential testing is dangerous if you repeatedly peek and stop when
p < 0.05; this inflates false positives. Use pre-planned looks, alpha spending, group sequential designs, or always-valid methods rather than ad hoc daily decision-making. -
Sample ratio mismatch occurs when observed treatment/control allocation deviates from expected randomization. For a 50/50 split, test counts using a chi-square goodness-of-fit test; SRM can signal logging bugs, eligibility differences, or assignment leakage, and should be investigated before trusting treatment effects.
-
Clustered data violates independent-observation assumptions when units influence each other or share shocks. For ads, households, campaigns, creators, or boards, use cluster-robust standard errors, randomize at the cluster level, or aggregate to the assignment unit before inference.
-
Survey inference requires weighting when sample composition differs from the target population. If a
Pinterestuser survey over-represents one gender, age group, or region, use post-stratification weights, report design effects, and distinguish sampling bias from true subgroup differences. -
Causal lift studies must separate randomized from observational evidence. A Conversion Lift Study can estimate incremental conversions if randomization is clean; observational attribution needs assumptions like ignorability, overlap, and no unmeasured confounding, often supported by matching, regression adjustment, or difference-in-differences.
Worked example
For “Design rigorous A/B test and causal analysis”, start by framing the first 30 seconds around the product decision: “What change are we testing, what is the primary metric, what is the randomization unit, and what launch decision will this support?” Then declare assumptions: users are independently assigned, treatment exposure is logged reliably, and the primary analysis will be intention-to-treat unless noncompliance is central. A strong answer can be organized into four pillars: experiment design, metric choice, power and duration, and validity checks.
For design, specify a user-level randomized controlled trial if the feature affects individual experience, but consider cluster randomization if there is interference through shared boards, creators, ads auctions, or social interactions. For metrics, choose one primary metric such as weekly_active_savers or save_rate, guardrails like hide_rate, session_length, or advertiser ROAS, and predefine segment cuts rather than fishing after results. For power, estimate baseline variance from historical data, choose an MDE that is product-relevant, and compute sample size before launch using the standard normal approximation or simulation for non-normal metrics.
The key tradeoff to flag is speed versus validity: shorter tests reduce opportunity cost but may underpower long-term outcomes, miss weekday seasonality, or overreact to novelty effects. You should explicitly say you would run SRM checks, inspect pre-treatment balance, use CUPED if a strong pre-period covariate exists, and avoid unplanned peeking unless sequential testing was designed up front. Close with: “If I had more time, I would add heterogeneous treatment effect analysis for new versus tenured users and validate whether the online metric movement predicts longer-term retention or marketplace value.”
A second angle
For “Analyze survey with gender imbalance”, the same inference ideas apply, but the main threat shifts from randomization variance to representativeness and bias. Instead of asking whether treatment and control are balanced by design, ask whether the survey sample matches the Pinterest population you want to generalize to across gender, age, geography, device, or engagement level. A naive mean from the survey may be precise but biased if one group is overrepresented and has systematically different responses. The answer should discuss post-stratification or inverse-probability weighting, weighted confidence intervals, and the increased variance from unequal weights. The close should separate descriptive claims about respondents from inferential claims about the broader user base.
Common pitfalls
Pitfall: Choosing a test by metric name instead of data-generating process.
A tempting answer is “use a t-test for means and a z-test for proportions” without asking about randomization unit, denominator variation, clustering, or sample size. A better answer says: “If the unit-level metric is approximately independent and sample size is large, Welch’s t-test is fine; if this is a ratio, clustered, or heavy-tailed metric, I would use unit-level aggregation, robust standard errors, bootstrap, or a transformation.”
Pitfall: Treating statistical significance as the launch decision.
Saying “p-value is below 0.05, so ship” misses practical significance, guardrails, power, novelty effects, and multiple testing. Interviewers want to hear whether the CI excludes effects that are too small to matter, whether business or user risk is asymmetric, and whether the result is stable across pre-specified segments.
Pitfall: Over-explaining formulas while under-explaining assumptions.
It is useful to know the t-statistic, but a DS interview is not a math exam alone. Spend equal time on what could invalidate the estimate: SRM, interference, logging gaps, noncompliance, selection bias, survey nonresponse, repeated peeking, and post-hoc segment mining.
Connections
This topic often pivots into causal inference, especially difference-in-differences, instrumental variables, matching, and regression adjustment when randomization is unavailable. It also connects to metric design, recommender-system evaluation, ads incrementality, and Bayesian experimentation, where the same uncertainty concepts appear with different decision rules.
Further reading
-
Trustworthy Online Controlled Experiments — Practical reference for A/B testing, SRM, guardrails, power, and online experimentation pitfalls.
-
Causal Inference: The Mixtape — Accessible treatment of causal estimands, selection bias, matching, difference-in-differences, and regression-based causal reasoning.
-
Deng, Xu, Kohavi, and Walker, “Improving the Sensitivity of Online Controlled Experiments by Utilizing Pre-Experiment Data” — Original CUPED paper; useful for explaining variance reduction in product experiments.
Featured in interview prep guides
Practice questions
- Estimate population singletons from a 10% logGoogle · Data Scientist · Technical Screen · medium
- Test a coefficient and explain t-distributionGoogle · Data Scientist · Technical Screen · medium
- Narrow a confidence interval for a meanGoogle · Data Scientist · Technical Screen · medium
- Compute p-values, probabilities, and regularization choicesGoogle · Data Scientist · Onsite · medium
- Derive MLEs and conditional Normal distributionsGoogle · Data Scientist · Technical Screen · medium
- Explain BLS vs CLS; compute t-statsPinterest · Data Scientist · Onsite · medium
- Design rigorous A/B test and causal analysisPinterest · Data Scientist · Onsite · hard
- Interpret A/B results for video-pin increasePinterest · Data Scientist · Technical Screen · medium
- Design human review to estimate model accuracyGoogle · Data Scientist · Onsite · hard
- Calculate 95% Bootstrap Confidence Interval for Order ValuesPinterest · Data Scientist · Onsite · medium
- Analyze survey with gender imbalancePinterest · Data Scientist · Onsite · hard
- Assess Fundamental Statistics Knowledge in Data-Science InterviewsGoogle · Data Scientist · Technical Screen · medium
Related concepts
- Statistical Inference, Power, And Metric UncertaintyStatistics & Math
- Hypothesis Testing, Power, And Confidence Intervals
- Statistical Inference, Hypothesis Tests, And Power
- Hypothesis Testing And Confidence IntervalsStatistics & Math
- Statistical Inference, Hypothesis Testing, And Power
- Power Analysis And Statistical InferenceStatistics & Math