Statistical Inference, Hypothesis Testing, And Power
Asked of: Data Scientist
Last updated
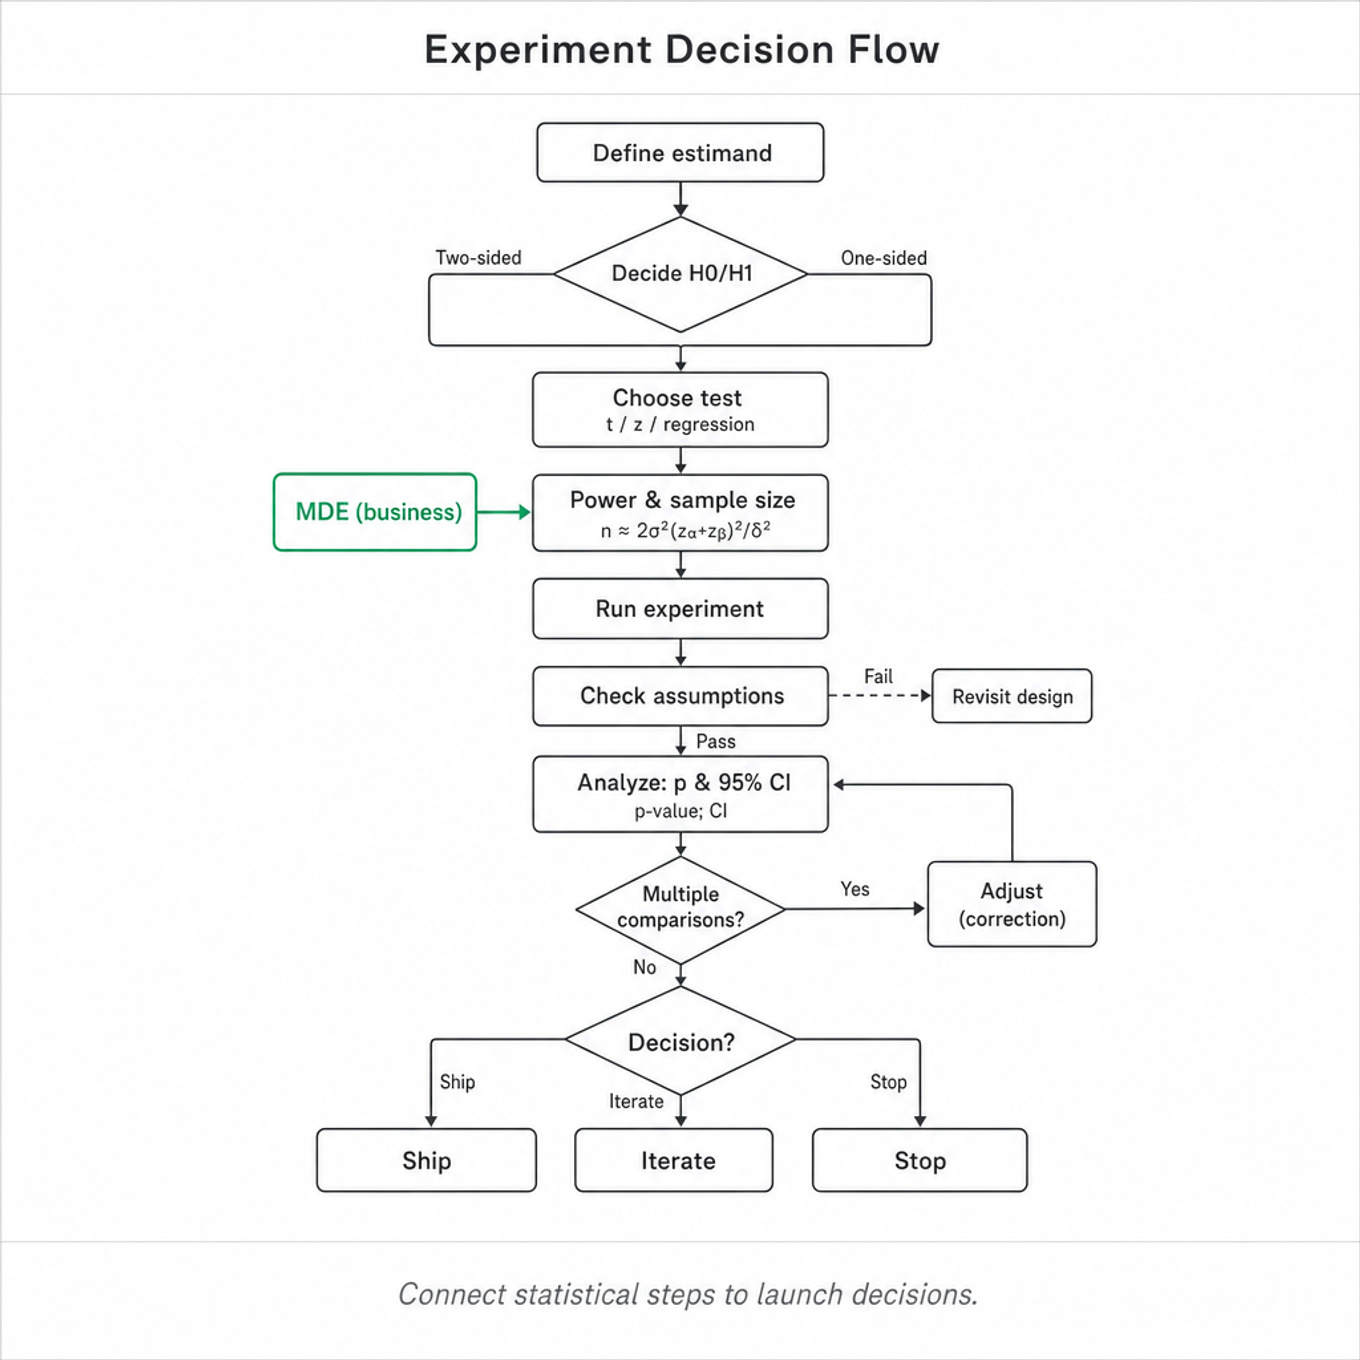
What's being tested
Interviewers are probing whether you can make reliable product decisions under uncertainty, not whether you can mechanically define a p-value. At Meta, product changes affect billions of users, metrics are noisy and correlated, and false positives can ship harmful changes at enormous scale. A strong Data Scientist must know how to frame hypotheses, choose valid tests, estimate power, handle multiple comparisons, and explain uncertainty to product partners. The real skill is connecting statistical rigor to launch decisions: “Do we have enough evidence to ship, iterate, or stop?”
Core knowledge
-
Start with a precise estimand before choosing a test. Define the population, treatment, control, unit of analysis, metric, and time window. For example: “average treatment effect on 7-day user-level feed sessions among eligible logged-in users,” not just “did engagement go up?”
-
Null and alternative hypotheses should match the decision. A standard setup is versus , where . For directional product bets, may be justified, but only if decided before seeing results.
-
p-values are not probabilities that the null is true. A p-value is . It does not measure effect size, business importance, or probability of launch success. Always pair it with confidence intervals and practical impact.
-
Confidence intervals communicate uncertainty around the effect. For a difference in means:
If a 95% CI is , the result may be statistically significant but still need business interpretation. -
Power is the probability of detecting a real effect. Power is , commonly 80% or 90%. For equal-sized variants and a continuous metric, approximate sample size per arm is:
where is the minimum detectable effect. -
Minimum detectable effect should be business-driven. Do not say “we need enough users for significance.” Ask what effect size is worth shipping: e.g., a 0.2% lift in daily active users may be massive, while a 0.2% lift in low-value clicks may not matter.
-
Metric distribution determines the test. User-level averages often use t-tests or regression; binary outcomes use z-tests for proportions or logistic regression; count metrics may need Poisson/negative binomial models; heavy-tailed metrics like revenue often require winsorization, bootstrap, or robust standard errors.
-
Ratio metrics require special care. Metrics like clicks per session or revenue per user are not simple independent observations if denominators vary. Use user-level aggregation, delta method, bootstrap, or linearization. For very large datasets, delta method or influence-function approaches scale better than repeated bootstrap.
-
Randomization unit must match interference risk. User-level randomization works for isolated UX changes. For social products, ads auctions, creator ecosystems, or feed ranking, SUTVA may fail because treated users affect control users. Consider cluster randomization, geo experiments, switchbacks, or network-aware analysis.
-
Multiple testing inflates false positives. If you test 20 metrics at , the chance of at least one false positive is . Use Bonferroni, Holm-Bonferroni, Benjamini-Hochberg FDR, or pre-register one primary metric plus guardrails.
-
Sequential peeking breaks nominal p-values. Repeatedly checking results and stopping when increases Type I error. Use alpha-spending, group sequential designs, always-valid p-values, or Bayesian monitoring. Otherwise, commit to a fixed horizon before interpreting significance.
-
Variance reduction can materially improve power. CUPED uses pre-experiment covariates to reduce variance:
It is especially useful when pre-period behavior strongly predicts post-period behavior, common for engagement metrics.
Worked example
For prompt: “Design an A/B test for a new Feed ranking change.” A strong candidate would first clarify the product goal: are we optimizing meaningful engagement, session quality, retention, creator distribution, or ad revenue, and what user population is eligible? They would state assumptions: randomize at the user level unless there is feed/network interference, run long enough to cover weekly cycles, and choose one primary metric such as 7-day user-level meaningful interactions or sessions per DAU. The answer should be organized around five pillars: hypothesis and estimand, experiment design, metrics, statistical testing and power, and launch decision criteria.
They should define and a practical MDE, then estimate sample size using historical variance and desired power, usually 80% or 90%. They should include guardrails such as hides, reports, session length extremes, retention, latency, and ecosystem metrics for creators or publishers. One important tradeoff is user-level randomization versus cluster or network-aware designs: user-level gives more power, but Feed changes can create spillovers through resharing, comments, and creator incentives. They should also mention novelty effects and day-of-week seasonality, so a 24-hour test may be misleading even with large sample size. A strong close would be: “If I had more time, I’d validate randomization balance, check heterogeneous effects by country/device/new versus existing users, and run sensitivity analyses for metric outliers and interference.”
A second angle
For prompt: “How would you determine the sample size needed for an experiment?” The same ideas apply, but the focus shifts from experiment design to power and decision thresholds. Start by asking for the primary metric, baseline mean, historical variance, desired MDE, significance level, power, traffic allocation, and expected experiment duration. For a binary metric, use the two-proportion approximation; for a continuous user-level metric, use historical standard deviation; for a ratio metric, estimate variance through delta method or bootstrap. The key constraint is often not statistical but product-driven: if the required sample size implies a six-month test, the team may need a larger MDE, variance reduction, a more sensitive metric, or a staged rollout. Also flag that underpowered tests do not merely “fail to find significance”; they produce noisy estimates that can mislead roadmaps.
Common pitfalls
Analytical mistake: treating statistical significance as launch readiness. A tempting answer is “if p < 0.05, ship it.” Better is to discuss effect size, confidence interval, guardrails, novelty effects, heterogeneous harm, and whether the observed lift exceeds the pre-defined practical threshold.
Communication mistake: leading with formulas before framing the product decision. Interviewers do not want a statistics lecture disconnected from Meta’s context. Start with the decision: what change is being evaluated, for whom, over what horizon, and what metric would justify action.
Depth mistake: ignoring dependency and interference. Many candidates assume iid users by default. For social graphs, messaging, groups, creators, ads auctions, or marketplace-like surfaces, one user’s treatment can affect another user’s outcome; mention SUTVA, cluster randomization, geo tests, or sensitivity checks.
Connections
Interviewers may pivot from hypothesis testing into experimentation design, causal inference, metric design, or decision science. If they push on causal validity, expect follow-ups on selection bias, difference-in-differences, instrumental variables, or synthetic controls. If they push on scale, expect discussion of logging quality, variance reduction, multiple testing platforms, and sequential experimentation.
Further reading
- Trustworthy Online Controlled Experiments — Kohavi, Tang, Xu — Practical reference for A/B testing, metrics, pitfalls, and organizational decision-making.
- Improving the Sensitivity of Online Controlled Experiments by Utilizing Pre-Experiment Data — Deng, Xu, Kohavi, Walker — Seminal CUPED paper on variance reduction in large-scale experiments.
- An Introduction to the Bootstrap — Efron and Tibshirani — Classic source for bootstrap intuition and methods, useful for non-normal and complex metrics.
Related concepts
- Statistical Inference, Hypothesis Tests, And Power
- Hypothesis Tests, Confidence Intervals, And P-Values
- Hypothesis Testing, Power, And Confidence Intervals
- Statistical Inference, Power, And Confidence IntervalsStatistics & Math
- Statistical Inference, Power, And Metric UncertaintyStatistics & Math
- Hypothesis Testing And Confidence Intervals