Power Analysis And Statistical Inference
Asked of: Data Scientist
Last updated
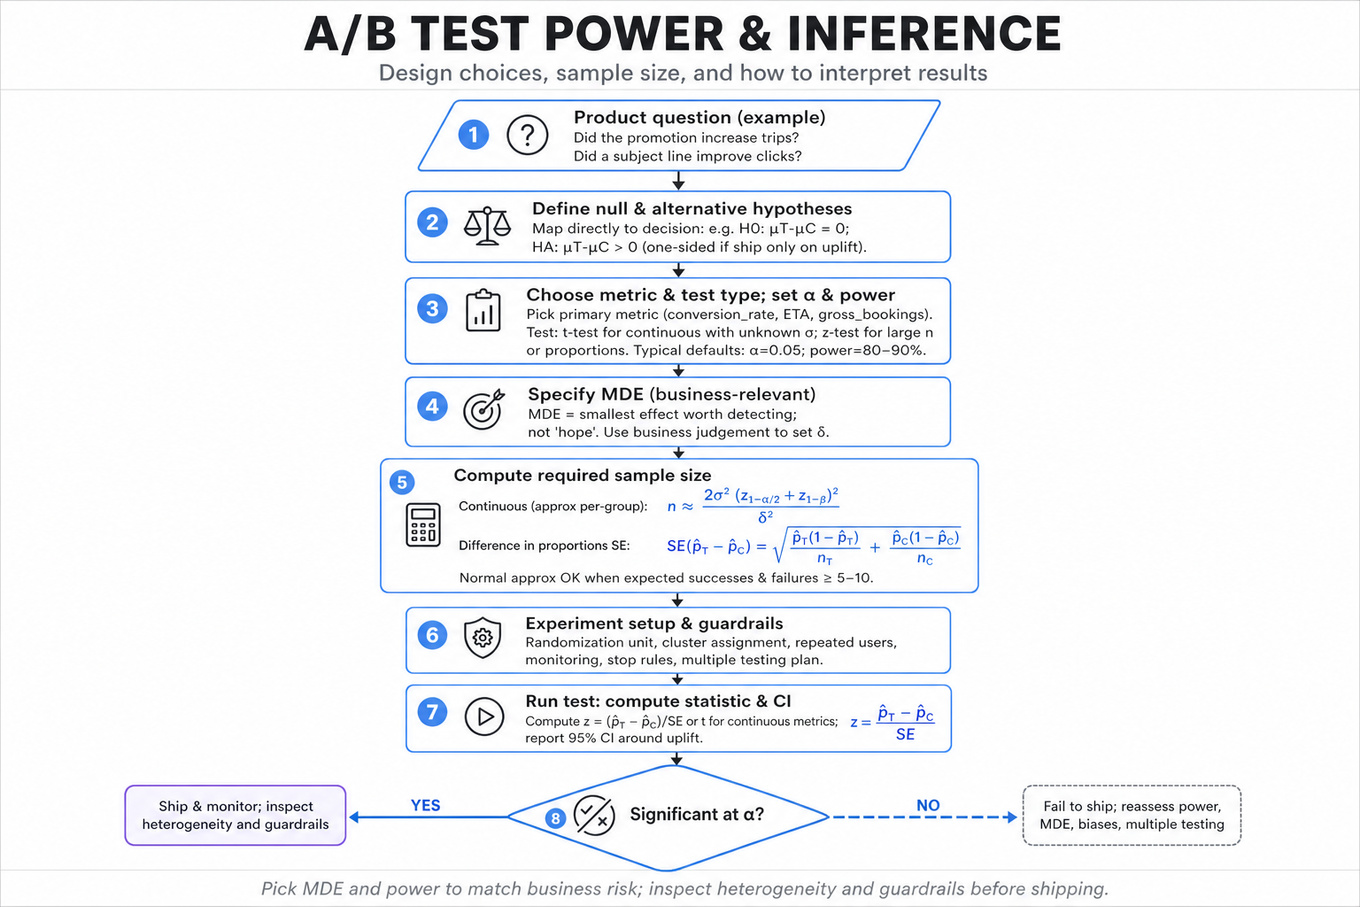
What's being tested
Interviewers are probing whether you can design and interpret A/B tests as a Data Scientist, not just plug numbers into a calculator. You need to translate product questions like “did this promotion increase trips?” or “did this subject line improve clicks?” into hypotheses, metrics, power assumptions, test statistics, and decision rules. Uber cares because small changes to conversion_rate, ETA, gross_bookings, driver_accept_rate, or cancellation_rate can have large marketplace effects, and bad inference can ship harmful changes or reject valuable ones. The strongest answers show statistical correctness, business judgment, and awareness of messy experimental realities like skewed revenue, repeated users, cluster assignment, guardrails, and multiple testing.
Core knowledge
-
Null and alternative hypotheses should map directly to the product decision. For a promotion test, and may fit if you only ship on uplift; use two-sided tests when either harm or benefit matters.
-
Type I error, Type II error, and power are the foundation. Significance level is the false-positive rate, is the false-negative rate, and power is . Common defaults are and power or , but the right choice depends on launch risk and opportunity cost.
-
Minimum detectable effect (MDE) is the smallest effect worth detecting, not the effect you hope to see. For a two-arm test with equal allocation and continuous outcomes, an approximate per-group sample size is:
where is the absolute MDE. -
For difference in proportions, such as email
click_through_rate, use:
and compute . The normal approximation is reasonable when expected successes and failures in each arm are usually at least 5–10. -
Z-tests vs t-tests depend on what is known and sample size. Use a Z-test for large-sample proportions or when variance is effectively known; use a t-test for continuous metrics with unknown variance, especially smaller samples. In large Uber experiments with thousands or millions of units, Z and t often converge, but the interviewer may test whether you know why.
-
Confidence intervals are often more useful than p-values. A 95% CI for a treatment effect gives the plausible range of impact, e.g. “+0.2% to +1.1% conversion.” If the CI excludes both zero and economically trivial effects, the launch case is stronger than “p < 0.05.”
-
Large p-values do not prove no effect. They mean the observed data are not sufficiently inconsistent with under the test assumptions. A well-calibrated answer says “we failed to reject the null,” then checks whether the test was powered for the business-relevant MDE.
-
Intent-to-treat (ITT) analysis preserves randomization by analyzing users, trips, or cities according to assigned group, regardless of whether they fully received treatment. For marketplace products, ITT is usually the primary estimate because non-compliance can be correlated with user behavior and create selection bias.
-
Ratio metrics like
revenue_per_trip,trips_per_user, orconversion_rateneed care because the numerator and denominator are random. Delta method, bootstrap, or user-level aggregation are safer than naively treating every trip as independent when users contribute multiple trips. -
Clustered observations break independence assumptions. If randomization is by city, market, driver, or user, inference should match that unit; use cluster-robust standard errors or analyze at the assignment level. Treating millions of trips as independent when only 20 cities were randomized can massively understate uncertainty.
-
Variance reduction methods such as CUPED can increase power by adjusting for pre-experiment covariates. A common form is , where is a pre-period metric. It is valid when is measured before treatment and not affected by the experiment.
-
Multiple testing inflates false positives across many metrics, segments, or variants. Pre-specify a primary metric and guardrails; for many planned comparisons, use methods like Bonferroni correction, Holm-Bonferroni, or Benjamini-Hochberg FDR depending on whether the priority is strict family-wise error control or discovery.
-
Sequential testing requires correction if you repeatedly peek at results. Naively checking daily and stopping when increases false positives. Valid approaches include alpha-spending functions, group sequential designs, always-valid p-values, or a pre-registered fixed horizon.
-
Guardrail metrics protect the marketplace from local optimization. A promotion might increase
gross_bookingsbut hurtcontribution_margin,driver_supply_hours, orcancellation_rate. A good launch rule distinguishes primary success metrics from non-negotiable guardrails.
Worked example
For “Determine Sample Size for Promotion Campaign A/B Test,” a strong candidate would start by clarifying the randomization unit, target population, primary metric, expected baseline, and business-relevant MDE. For example: “Are we randomizing riders, trips, cities, or markets? Is success incremental gross_bookings, completed_trips, conversion_rate, or profit after promo cost?” Then they would state assumptions: equal allocation, fixed-horizon test, independent user-level outcomes unless there is clustering, and a chosen and power.
The answer skeleton should have four pillars: first, define hypotheses and the primary metric; second, estimate baseline variance or baseline conversion from historical data; third, compute sample size using the appropriate formula for proportions or continuous outcomes; fourth, define guardrails and an analysis plan before launch. If the metric is conversion_rate, they might use a difference-in-proportions power formula; if it is revenue_per_user, they would discuss skewness and potentially bootstrap or log-transform sensitivity checks. A specific tradeoff to flag is that a smaller MDE requires quadratically more sample: halving roughly quadruples required sample size. They should also mention that promotions can create interference since treated riders may affect driver availability or surge dynamics for control riders. A strong close would be: “If I had more time, I’d validate variance from a pre-period, run a power curve across plausible MDEs, and check whether cluster-level randomization is needed to reduce marketplace spillovers.”
A second angle
For “Analyze results and large p-values correctly,” the same inference machinery applies, but the emphasis shifts from planning to interpretation. The interviewer is looking for whether you avoid saying “there is no effect” when the p-value is large. A better answer separates statistical uncertainty from business relevance: “The estimate is positive but imprecise; the confidence interval includes both meaningful lift and no lift, so we may be underpowered.” This framing naturally leads to checking sample size, realized variance, treatment exposure, experiment duration, and whether the analysis used the correct unit of randomization. It also tests judgment about whether to extend the test, stop due to futility, or redesign the metric.
Common pitfalls
Pitfall: Treating
p > 0.05as proof that the treatment failed.
This is the most common analytical mistake. A large p-value may reflect a small true effect, high variance, insufficient sample size, dilution from non-compliance, or an incorrectly specified test. Say “we failed to reject the null,” then discuss the confidence interval, MDE, and realized power.
Pitfall: Choosing a metric after seeing the results.
A tempting but weak answer is “we checked many segments and found a significant increase among weekday riders, so we should launch there.” That may be p-hacking unless the segment was pre-specified or adjusted for multiple comparisons. A stronger response labels it exploratory and proposes a follow-up confirmatory test.
Pitfall: Ignoring the assignment unit and pretending all rows are independent.
If users are randomized but the dataset has one row per trip, trip-level tests can overweight frequent riders and understate standard errors. If cities are randomized, the effective sample size is closer to the number of cities than the number of trips. The better answer aggregates or uses cluster-robust inference aligned to the randomization design.
Connections
Interviewers may pivot from power analysis into causal inference, especially selection bias, non-compliance, and interference. They may also connect this to metric design, variance reduction, sequential experimentation, heterogeneous treatment effects, or ranking/model evaluation when product changes affect marketplace quality metrics beyond the primary KPI.
Further reading
-
Trustworthy Online Controlled Experiments by Kohavi, Tang, and Xu — Practical treatment of online experiment design, metrics, pitfalls, and interpretation.
-
CUPED: Controlled-experiment Using Pre-Experiment Data — Seminal paper on variance reduction for large-scale experiments.
-
Causal Inference: The Mixtape by Scott Cunningham — Useful background on causal reasoning, identification, and interpretation beyond randomized tests.
Featured in interview prep guides
Practice questions
- Compare Two Coin ProportionsUber · Data Scientist · Technical Screen · medium
- Compute A/B sample size under clusteringUber · Data Scientist · Technical Screen · hard
- Design and power an incentive experimentUber · Data Scientist · Onsite · hard
- Analyze Cancellation Change with StatisticsUber · Data Scientist · Technical Screen · medium
- Analyze results and large p-values correctlyUber · Data Scientist · Technical Screen · hard
- Design an A/B test; choose Z vs TUber · Data Scientist · Technical Screen · hard
- Formulate hypotheses and compute AB test significanceUber · Data Scientist · Technical Screen · hard
- Determine Sample Size for Promotion Campaign A/B TestUber · Data Scientist · Technical Screen · medium
- Evaluate Email Subject Line Performance Using HypothesesUber · Data Scientist · Technical Screen · medium
Related concepts
- Statistical Inference, Power, And Confidence IntervalsStatistics & Math
- Hypothesis Testing, Power, And Confidence Intervals
- Statistical Inference For Proportions And Confidence IntervalsStatistics & Math
- Statistical Power AnalysisStatistics & Math
- Statistical Inference, Power, And Metric UncertaintyStatistics & Math
- Statistical Inference, Hypothesis Testing, And Power