Statistical Power Analysis
Asked of: Data Scientist
Last updated
What's being tested
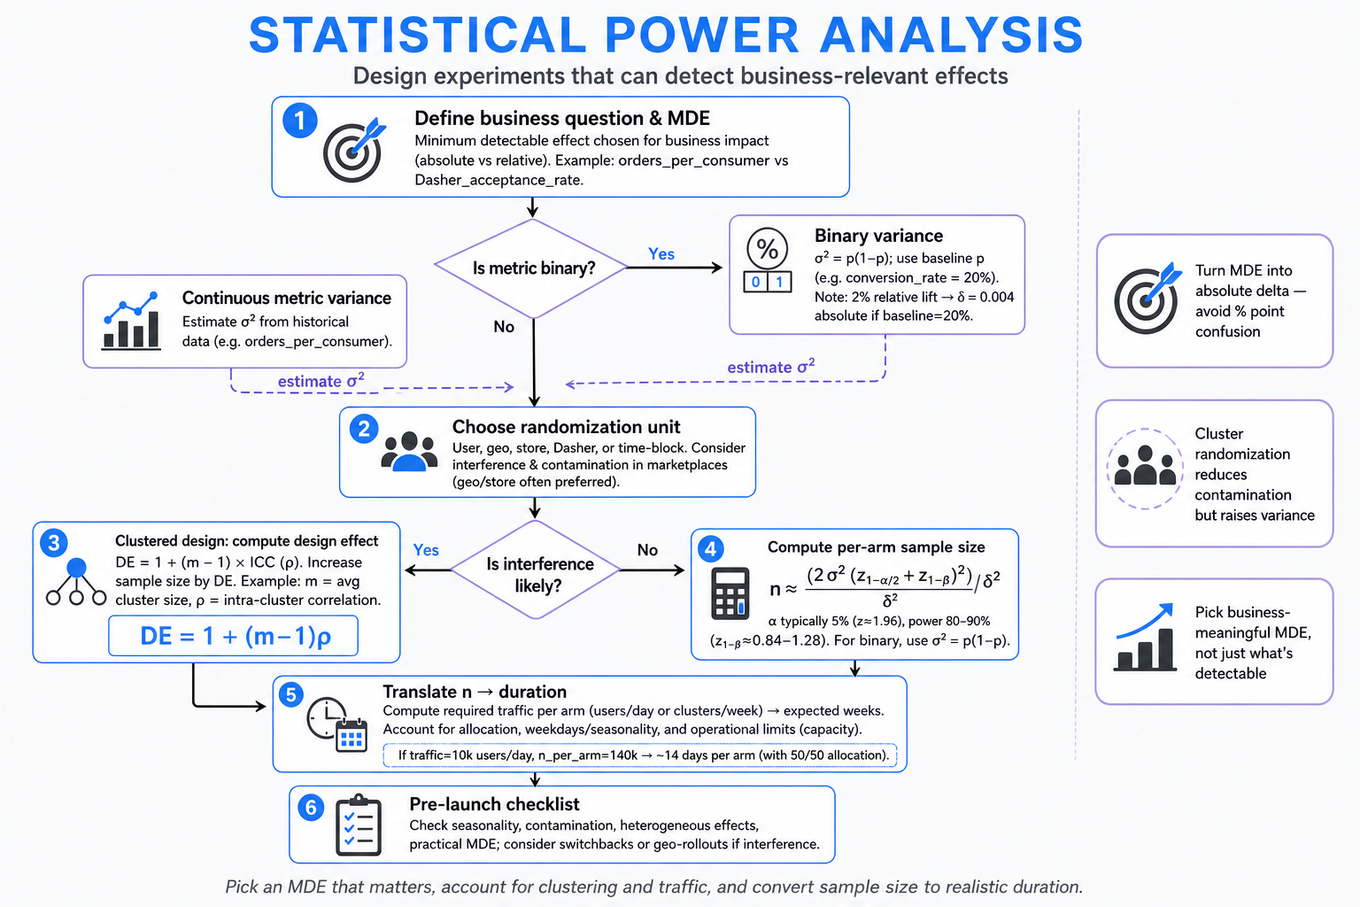
Statistical power analysis in these interviews is about whether you can design an experiment that has a realistic chance of detecting a business-relevant effect before DoorDash spends weeks running it. The interviewer is probing whether you understand the link between effect size, variance, sample size, randomization unit, and experiment duration, especially in marketplace settings with interference between consumers, Dashers, and merchants. You are expected to reason beyond a simple user-level A/B test: switchbacks, geo launches, notification campaigns, courier initiatives, and revenue algorithms all create clustering, contamination, seasonality, and heterogeneous treatment effects. DoorDash cares because underpowered tests waste marketplace capacity, while overpowered or poorly framed tests can ship statistically significant but operationally meaningless changes.
Core knowledge
-
Power is the probability of detecting a true effect of a specified size: , commonly set to 80% or 90%. The standard test design also chooses a Type I error rate , often 5%, and a practically meaningful minimum detectable effect.
-
MDE should come from product or business relevance, not from whatever the experiment can conveniently detect. For
DoorDash, a 0.1% lift inorders_per_consumermay matter at scale, while a 0.1% lift inDasher_acceptance_ratemay be meaningless if it worsenson_time_delivery_rate. -
For a two-sample difference in means with equal allocation, approximate per-arm sample size is:
where is outcome variance and is the absolute MDE. Binary metrics use . -
Relative MDE and absolute MDE must be translated carefully. If baseline
conversion_rateis 20%, a 2% relative lift means absolute, not 0.02. Many weak interview answers overstate power by confusing percentage points with percent lift. -
Randomization unit determines effective sample size. User-level randomization works for independent consumer experiences, but marketplace experiments often need cluster randomization by geo, store, Dasher, or time block to reduce interference. More rows in the dataset do not imply more independent observations.
-
Clustered designs inflate variance through the intra-cluster correlation. A common design effect is:
where is average cluster size and is the intra-cluster correlation. Effective sample size is roughly , which can drastically reduce power for geo or store-level tests. -
Switchback experiments randomize treatment by market-time blocks, such as city-hour or zone-day. Power depends on the number of randomized blocks, not just total orders. Analysis should usually include fixed effects for market and time, plus clustered standard errors at the randomization level.
-
Pre-period covariates can improve power through CUPED or regression adjustment. If a covariate explains outcome variance, adjusted variance becomes approximately . This is valuable for noisy metrics like
gross_order_value,delivery_time, andretention. -
Triggering affects power and interpretation. If only 10% of consumers receive an extra notification, analyzing all assigned users estimates the intent-to-treat effect and may be diluted. A triggered analysis can improve sensitivity but risks post-treatment selection bias unless eligibility is defined pre-randomization.
-
Ratio metrics such as
revenue_per_order,orders_per_active_user, orcost_per_deliveryneed careful variance estimation. Delta method, bootstrap, or user-level aggregation is often safer than treating numerator and denominator events as independent. -
Multiple metrics create multiple testing risk.
DoorDashexperiments usually have one primary metric, guardrails such asrefund_rate,lateness, andDasher_pay, and diagnostic secondary metrics. Use hierarchy, pre-registration, or corrections like Bonferroni or Benjamini-Hochberg when many claims are made. -
Duration must cover temporal cycles. Even if sample size is reached in two days, marketplace metrics often vary by weekday, lunch/dinner peaks, weather, holidays, and promotions. A credible design often runs at least one or two full weekly cycles unless the intervention is extremely short-lived.
Worked example
For Design and analyze a switchback experiment, a strong candidate would start by clarifying the intervention, the marketplace side affected, the primary metric, and the likely interference pattern: “Are we changing dispatch logic, pricing, batching, or Dasher incentives, and does treatment spill over across nearby zones or time windows?” They would state that user-level randomization may be invalid if supply is shared, so they would propose randomizing market-time blocks, such as zone_id × hour or market × meal_period. The answer would be organized around four pillars: define success metrics and guardrails, choose the randomization unit, calculate power/MDE using block-level variance, and specify the analysis model.
For the model, they might propose a regression like , where are zone fixed effects, are time fixed effects, and standard errors are clustered by zone or switchback block depending on assignment. They would explain that power comes from the number of randomized blocks and the within-zone over-time variation, not merely the number of deliveries. A key tradeoff is granularity: shorter blocks increase sample size but raise carryover risk if Dashers reposition or orders started in one block finish in another. They would close by saying that, with more time, they would simulate power from historical delivery_time, fulfillment_rate, and order_volume data to account for skew, seasonality, and cluster correlation instead of relying only on a normal approximation.
A second angle
For Analyze Retention Data for Geo-Targeted Feature Launch, the same power logic applies, but the constraint shifts from time-block randomization to a small number of geographies. The effective sample size is closer to the number of markets than the number of consumers, especially if local marketing, merchant mix, or Dasher supply shocks affect everyone in a region. A strong design would use matched geo pairs, pre-period retention trends, and possibly a difference-in-differences estimator to reduce variance. Power should be based on historical market-level retention volatility, not individual-level binomial variance. The candidate should also discuss that retention curves create multiple endpoints, such as D7_retention, D28_retention, and repeat-order rate, so the primary endpoint must be chosen before launch.
Common pitfalls
Pitfall: Treating rows as independent observations.
A tempting answer is, “We have millions of orders, so the experiment will be highly powered.” That fails in switchback, geo, courier, and marketplace tests because the independent unit may be a zone-hour, market, Dasher, or user cohort. A better answer explicitly identifies the randomization unit and computes power using variance at that level.
Pitfall: Starting with the formula before defining the decision.
Interviewers do not want a memorized sample-size equation detached from the business question. If the candidate cannot say what MDE matters for revenue, retention, delivery_quality, or Dasher_experience, the math is not useful. Start with the decision the experiment must support, then translate that into an effect size and duration.
Pitfall: Ignoring dilution and noncompliance.
For notification experiments or courier initiatives, not everyone assigned to treatment will actually receive or comply with the treatment. Reporting only a per-exposed lift can exaggerate impact if exposure is post-treatment. A stronger answer distinguishes intent-to-treat, treatment-on-the-treated, eligibility criteria, and how each affects power and causal interpretation.
Connections
Interviewers often pivot from power analysis into causal inference, especially difference-in-differences, instrumental variables, or synthetic control for geo launches. They may also probe metric design, experiment guardrails, sequential testing, variance reduction, or heterogeneous treatment effects across markets, merchants, consumers, and Dashers.
Further reading
-
Trustworthy Online Controlled Experiments — Kohavi, Tang, and Xu; practical reference for online experimentation, variance, guardrails, and interpretation.
-
Field Experiments: Design, Analysis, and Interpretation — Gerber and Green; strong treatment of randomization, clustering, and causal estimands.
-
Causal Inference for Statistics, Social, and Biomedical Sciences — Imbens and Rubin; deeper foundation for potential outcomes, assignment mechanisms, and experimental validity.
Featured in interview prep guides
Practice questions
- Design experiment for bike delivery featureDoorDash · Data Scientist · Technical Screen · medium
- Design and analyze a switchback experimentDoorDash · Data Scientist · Technical Screen · hard
- Experiment on increasing order notificationsDoorDash · Data Scientist · Onsite · hard
- Calculate power and test durationDoorDash · Data Scientist · Technical Screen · medium
- Investigate Causes of Cold Food Deliveries and SolutionsDoorDash · Data Scientist · Technical Screen · medium
- Analyze Retention Data for Geo-Targeted Feature LaunchDoorDash · Data Scientist · Technical Screen · medium
- Design Experiments to Evaluate Courier Initiatives EffectivelyDoorDash · Data Scientist · Onsite · hard
- Design A/B Test to Evaluate Algorithm's Revenue ImpactDoorDash · Data Scientist · Technical Screen · hard
Related concepts
- Power Analysis And Statistical InferenceStatistics & Math
- Statistical Inference, Power, And Metric UncertaintyStatistics & Math
- Hypothesis Testing, Power, And Confidence Intervals
- Power, MDE, And Multiple Testing
- Statistical Inference, Power, And Confidence IntervalsStatistics & Math
- A/B Test Design and Power Analysis