A/B Testing And Product Metric Diagnostics
Asked of: Data Scientist
Last updated
What's being tested
Google is testing whether you can turn an ambiguous product change into a statistically valid experiment design with a clear decision rule. Strong Data Scientist answers define the hypothesis, unit of randomization, primary metric, guardrails, sample size, segmentation, and analysis plan before talking about launch decisions. Interviewers are probing whether you understand both causal inference and product realities: network effects in Google Chat, local-intent heterogeneity in Google Maps, pricing sensitivity in subscriptions, and forecasting uncertainty in products like video views. The strongest candidates balance rigor with practicality: they know when precision matters, when speed matters, and how to avoid misleading conclusions from noisy product metrics.
Core knowledge
-
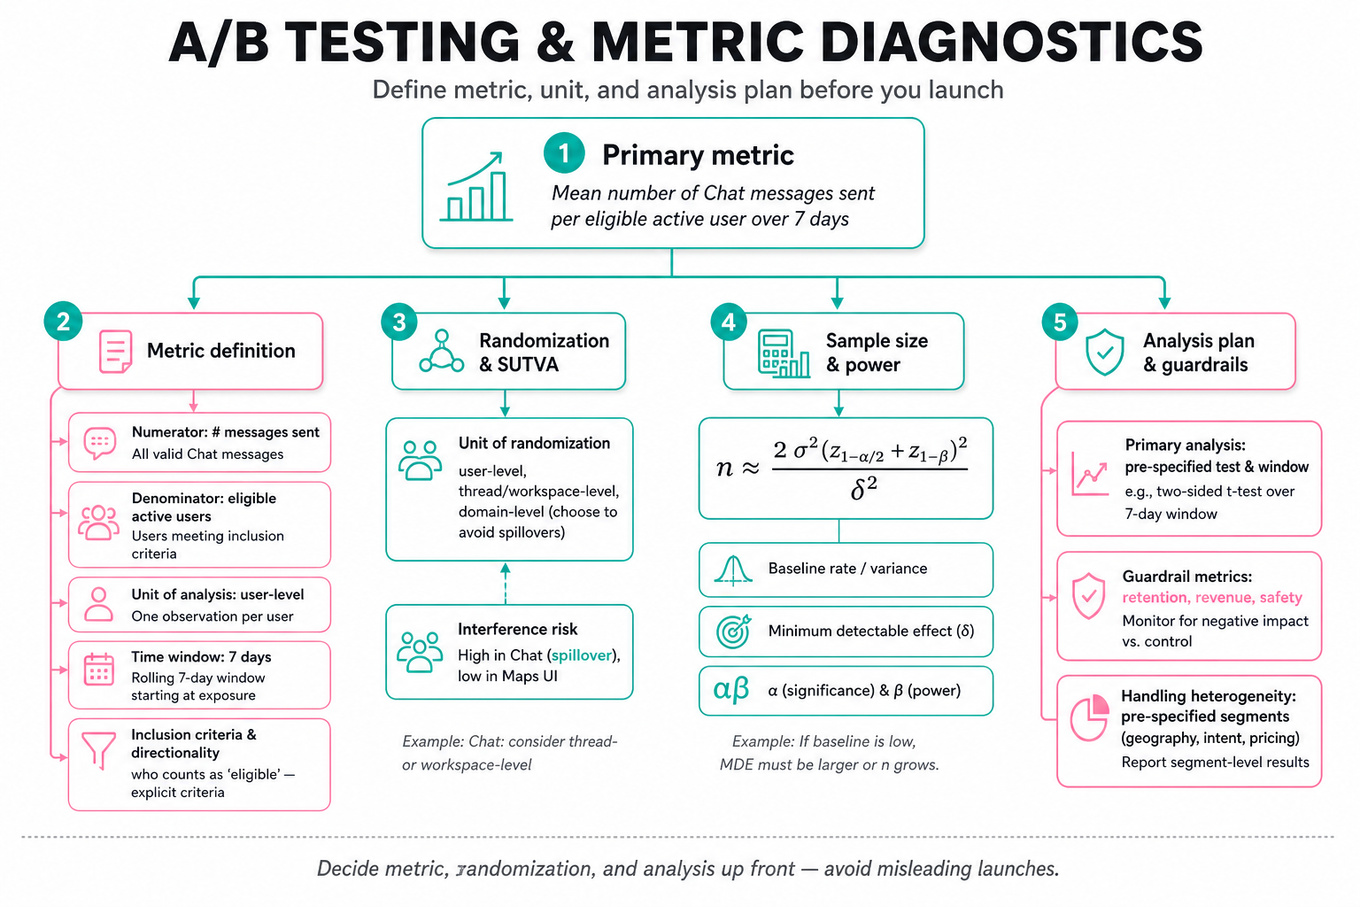
Primary metric selection is the center of the design. Define numerator, denominator, unit of analysis, time window, inclusion criteria, and directionality. “Engagement increased” is weak; “mean number of
Chatmessages sent per eligible active user over 7 days” is interview-ready. -
Unit of randomization must match the interference structure. For UI changes in
Google Maps, user-level randomization is often fine. ForGoogle Chat, randomizing individuals can create spillovers because one treated user changes conversation behavior for untreated coworkers; consider domain-, workspace-, or thread-level assignment. -
Stable Unit Treatment Value Assumption, or SUTVA, is often violated in social and collaborative products. If treatment affects peers, the measured effect may be diluted or contaminated. Call this out explicitly for messaging, sharing, group collaboration, marketplace, and recommendation settings.
-
Sample size / power depends on baseline rate, minimum detectable effect, variance, significance level, and power. For a two-sample mean comparison, a useful approximation is
where is the absolute effect size you want to detect. -
Confidence level tradeoff is not automatic.
95%confidence is common, but a lower threshold may be acceptable for low-risk iteration, while higher confidence may be needed for pricing, trust, safety, or irreversible launches. Discuss false positives, false negatives, experiment duration, and opportunity cost. -
Guardrail metrics protect against local optimization. For
Google Maps, guardrails might includetask_success_rate,route_start_rate,latency,crash_rate, andsearch_refinement_rate. For pricing, userefund_rate,support_contact_rate,churn, and long-termLTV, not just immediate conversion. -
Multiple testing becomes a problem when slicing by many cohorts or tracking many outcomes. If you evaluate 20 metrics at , expect about one false positive by chance. Mention Bonferroni correction, Benjamini-Hochberg false discovery rate, or pre-registering primary versus secondary metrics.
-
Sequential monitoring can inflate false positives if you peek daily and stop when significant. A strong answer proposes fixed analysis windows or uses methods such as alpha spending, group sequential tests, or always-valid confidence intervals. “I’ll monitor guardrails continuously but reserve success decisions for the planned readout” is a good line.
-
Metric diagnostics require decomposing changes into funnel steps, cohorts, platforms, geographies, traffic sources, and user maturity. If
Chatusage rises, ask whether it is more users sending messages, more messages per sender, more bots, more notifications, or a logging artifact visible in the analytical data. -
Heterogeneous treatment effects matter, but they should be framed as exploratory unless pre-specified. Pricing effects may differ by country, acquisition channel, tenure, or plan type. UI changes may help novice users and hurt power users. Avoid overfitting noisy segments into product decisions.
-
Ratio metrics need careful variance handling. Metrics like messages per active user, revenue per visitor, or views per session can be analyzed with delta method, bootstrap, or user-level aggregation. Do not compare raw event-level rows if the treatment is assigned at user level; that understates uncertainty.
-
Experiment validity checks are mandatory before interpreting impact. Check sample ratio mismatch, pre-period balance, exposure logging, eligibility consistency, novelty effects, seasonality, bot/internal traffic, and missingness. If assignment is
50/50, a large deviation in treatment counts is a red flag before any product conclusion.
Worked example
For Design A/B Test for Google Maps UI Change, a strong candidate starts by clarifying the product goal: is the new UI intended to improve search-to-navigation completion, reduce time to find a place, increase exploration, or improve satisfaction? They would ask who is eligible, whether the UI affects all map sessions or only certain surfaces, and whether there are safety-sensitive contexts such as driving mode. The answer can be organized around four pillars: hypothesis and population, metrics, randomization and power, and analysis / launch criteria.
A crisp setup might be: randomize eligible users at the user level, expose them consistently for two weeks, and use successful_task_completion_rate as the primary metric, defined as the share of map search sessions that lead to a meaningful action such as route start, call, website visit, or save within a fixed window. Secondary metrics could include time_to_action, search_refinement_rate, repeat_usage_7d, and user_report_rate. Guardrails should include crash_rate, latency, route_abandonment_rate, and negative feedback. One tradeoff to flag is that a broad primary metric may capture overall user value but be harder to interpret, while a narrow metric such as route_start_rate is easier to move but may miss discovery use cases. The close should be decision-oriented: launch if the primary metric improves or is neutral with strong secondary benefits, no key guardrail regresses, and effects are consistent across major platforms and regions. If more time were available, add pre-period covariate adjustment, long-term retention analysis, and qualitative review for cohorts with negative movement.
A second angle
For Design A/B Test for Subscription Price Increase Effectiveness, the same experimental logic applies, but the constraints are sharper because the intervention directly changes user cost and can affect trust. The primary metric cannot simply be conversion_rate; a higher price may lower conversion but increase revenue_per_visitor or long-term LTV. Randomization should be handled carefully across acquisition channels and geographies because users may compare prices, share screenshots, or return across devices. Guardrails should include refund_rate, chargeback_rate, support_contacts_per_signup, early churn, and brand-sensitive feedback. The tradeoff is also different: pricing tests may need longer follow-up and stronger confidence because short-term revenue lift can mask long-term retention damage.
Common pitfalls
Pitfall: Choosing a vague metric like “usage,” “engagement,” or “growth” without a precise definition.
This is the most common analytical mistake. A better answer specifies the unit, event, denominator, and window: for example, messages_sent_per_weekly_active_user among eligible Google Workspace users over 14 days, with bot-generated messages excluded or analyzed separately.
Pitfall: Treating the A/B test as only a significance test.
Interviewers expect a decision framework, not just “p-value below 0.05 means launch.” Discuss minimum detectable effect, practical significance, guardrails, confidence intervals, pre-specified readout dates, and what you would do if the result is directionally positive but underpowered.
Pitfall: Ignoring product-specific interference and heterogeneity.
For collaboration products, pricing, and local search, users are not interchangeable independent observations. Mention spillovers, cohort differences, and segment diagnostics, but avoid claiming every subgroup result is causal unless it was pre-planned or adjusted for multiple comparisons.
Connections
Interviewers may pivot from here into causal inference beyond randomized tests, such as difference-in-differences, regression discontinuity, or propensity score methods when experimentation is infeasible. They may also ask about forecasting, ranking metric evaluation, funnel diagnostics, or long-term metric design when short-term A/B results conflict with retention or user trust.
Further reading
-
Trustworthy Online Controlled Experiments by Kohavi, Tang, and Xu — the standard reference for practical A/B testing, metric design, pitfalls, and organizational decision-making.
-
Controlled experiments on the web: survey and practical guide, Kohavi et al. — concise coverage of online experiment design, power, ramping, and interpretation issues.
-
The Seven Rules of Thumb for Web Site Experimenters, Kohavi et al. — useful heuristics for avoiding false positives, misleading metrics, and common online experimentation mistakes.
Featured in interview prep guides
Practice questions
- How do you diagnose a ratio metric changeGoogle · Data Scientist · Onsite · medium
- Design pricing and multivariate button experimentsGoogle · Data Scientist · HR Screen · medium
- Diagnose 10–11% usage drop across geosGoogle · Data Scientist · Technical Screen · medium
- Design an A/B test with guardrails and SRM checksGoogle · Data Scientist · Technical Screen · medium
- Experimentally evaluate jogging-route recommendationsGoogle · Data Scientist · Technical Screen · hard
- Diagnose a metric drop in search timeGoogle · Data Scientist · Onsite · medium
- Choose a precise A/B test primary metricGoogle · Data Scientist · Technical Screen · hard
- Diagnose and reverse an adoption-rate declineGoogle · Data Scientist · Onsite · hard
- Design tests to measure latency impactGoogle · Data Scientist · Onsite · easy
- Decide confidence level and forecast video viewsGoogle · Data Scientist · Onsite · medium
- Boost Google Workspace Chat Usage with Strategic A/B TestingGoogle · Data Scientist · Technical Screen · hard
- Design A/B Test for Google Maps UI ChangeGoogle · Data Scientist · Onsite · medium
Related concepts
- Experimentation, A/B Testing, And Product MetricsBehavioral & Leadership
- Product Metric Design And Diagnostic Deep DivesAnalytics & Experimentation
- Experiment Metric DesignAnalytics & Experimentation
- Experiment Metric Design And GuardrailsAnalytics & Experimentation
- A/B Testing And Experiment DesignAnalytics & Experimentation
- A/B Testing, Power, And Experiment DesignAnalytics & Experimentation