Distributional Analysis And Robust Statistics
Asked of: Data Scientist
Last updated
What's being tested
Interviewers are probing whether you can reason about real-world metric distributions rather than assuming clean, Gaussian data. At Meta, product metrics like time spent, messages sent, ad impressions, revenue, friend requests, and video watch time are often zero-inflated, heavy-tailed, multimodal, bot-contaminated, or affected by logging bugs. The skill is not just naming “mean vs median,” but choosing summaries, tests, transformations, and guardrails that preserve business meaning under messy data. A strong answer shows you can distinguish true user heterogeneity from data quality issues, quantify uncertainty robustly, and communicate tradeoffs to product and engineering partners.
Core knowledge
-
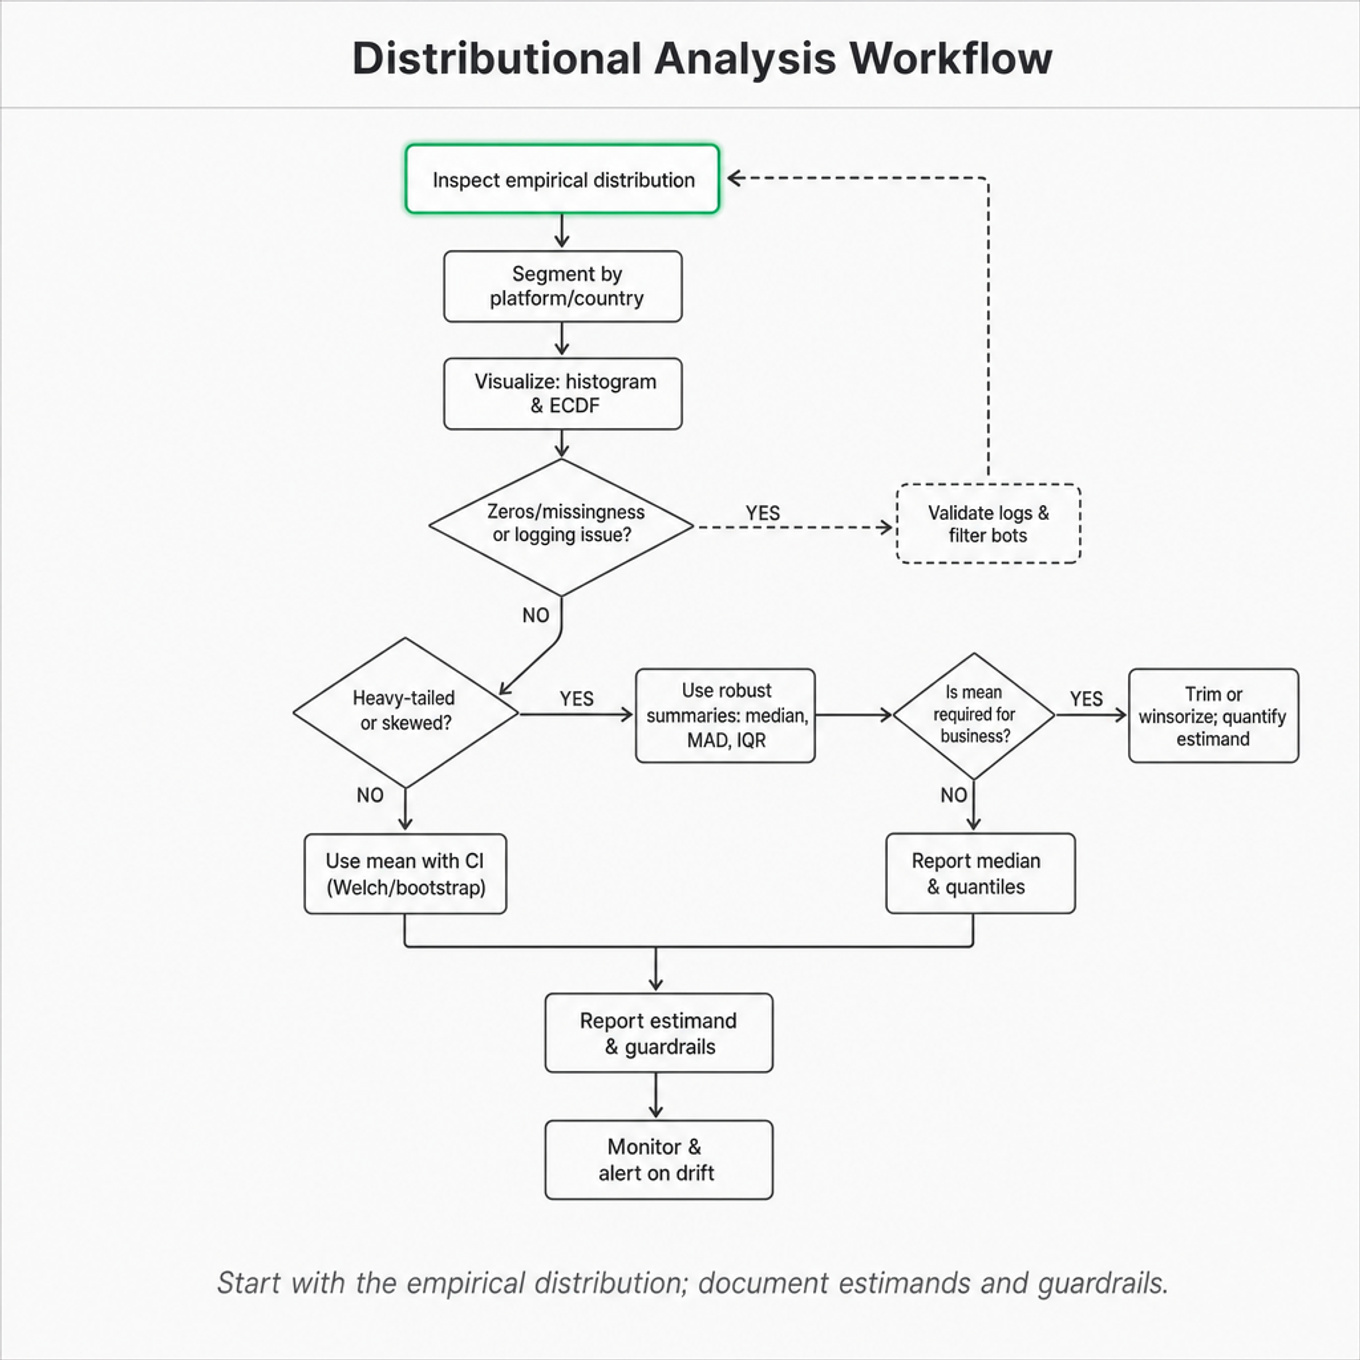
Always start with the empirical distribution: histogram on linear and log scale, ECDF, quantiles, missingness, zeros, max/min, and segmented distributions by platform, country, tenure, device, or traffic source. Aggregates can hide mixture distributions and logging defects.
-
Mean, median, and quantiles answer different business questions. The mean estimates total expected impact: . The median describes a typical user. For revenue or time-spent metrics, the mean may be business-critical even when unstable.
-
Heavy-tailed metrics make means noisy because variance can be dominated by a small number of users. If is large or undefined, classical confidence intervals based on normal approximations can be misleading, especially for small samples or highly skewed per-user metrics.
-
Robust summaries include median, trimmed mean, winsorized mean, interquartile range, and median absolute deviation: For approximately normal data, estimates standard deviation while resisting extreme values.
-
Trimming removes extremes; winsorization caps them. A 1% winsorized mean replaces values below the 1st percentile and above the 99th percentile with those cutoffs. This reduces variance but changes the estimand, so report exactly what business quantity is being estimated.
-
Outliers are not automatically bad data. A user sending 10,000 messages may be spam, a power user, a business account, or a logging duplication. Good analysis separates data validation, abuse filtering, and legitimate long-tail behavior before changing the metric.
-
For comparing groups, Welch’s t-test is often more robust than Student’s t-test under unequal variances, but it still targets mean differences. Mann-Whitney U tests rank differences, not strictly median differences, and can reject because distributions have different shapes.
-
Bootstrap confidence intervals are useful for skewed statistics like medians, quantiles, ratios, and trimmed means. Typical resamples are to ; for very large datasets, resample users or use stratified/bootstrap-at-aggregate approaches to control compute.
-
For online experimentation, analyze at the randomization unit, usually user or account, not event. Event-level tests on impressions or clicks can massively understate standard errors because observations from the same user are correlated.
-
Streaming or massive-scale distribution summaries need approximate algorithms. Exact quantiles require sorting, usually fine up to millions of rows in memory; at billions of events, use t-digest, KLL sketches, or Greenwald-Khanna summaries with known approximation error.
-
Log transforms help visualize and model positive skewed data, but is not the same as . For zero-inflated data, use carefully and explain whether the transformed metric remains interpretable.
-
Distribution shifts should be tested and localized, not only summarized. KS tests, Wasserstein distance, PSI, quantile deltas, and segmented ECDFs can reveal whether an experiment affects everyone slightly, only power users, or only a tail segment.
Worked example
For “How would you analyze a metric with a highly skewed distribution and outliers?”, a strong candidate would first clarify what the metric represents, the unit of analysis, and the decision it supports: “Are we estimating total business impact, typical-user experience, or detecting data quality issues?” They would declare that the first step is descriptive: plot the metric on raw and log scales, inspect quantiles such as p50/p90/p99/p99.9, check the fraction of zeros, and segment by major dimensions like country, platform, tenure, and traffic source. The answer can then be organized around four pillars: validate data quality, characterize the distribution, choose robust summaries, and select an inference method appropriate to the estimand.
For data validation, they would check whether extreme values correspond to duplicate events, bots, internal traffic, clock issues, or legitimate power users. For summarization, they would report mean for total impact, median or p75 for typical experience, and tail quantiles for risk or abuse-sensitive metrics. For inference, they might use bootstrap intervals for medians or quantiles, Welch’s t-test or bootstrap for means, and possibly winsorized means if the product team agrees that capped influence is acceptable. A key tradeoff to flag is that winsorization improves stability but changes the metric definition; it can make an experiment look healthier by hiding real effects concentrated among high-activity users. They should close by saying that, with more time, they would run sensitivity analyses across raw mean, log-transformed mean, trimmed mean, and key quantiles to show whether conclusions are robust.
A second angle
For “How would you compare two groups when the data is not normally distributed?”, the same concepts apply, but the framing shifts from description to valid inference. The candidate should first ask whether the goal is to compare means, medians, quantiles, or the whole distribution, because each implies a different test and business interpretation. If the metric is per-user revenue, the mean may matter most despite skew; bootstrap or permutation tests may be preferable to relying only on normality assumptions. If the product concern is user experience, comparing medians or p90 latency-like outcomes may be more meaningful. The candidate should also emphasize analyzing users, not events, and checking whether distributional differences are localized in a small tail segment.
Common pitfalls
A common analytical mistake is saying, “The data is skewed, so use the median,” without asking what decision the metric supports. For revenue, ads value, or total time spent, the mean often maps directly to business impact; the better answer is to report both robust typical-user metrics and mean-based impact with appropriate uncertainty.
A communication mistake is treating outlier handling as a mechanical cleanup step: “Remove points more than three standard deviations away.” In heavy-tailed product data, that rule can remove legitimate power users and bias conclusions. A stronger answer explains a hierarchy: validate instrumentation, identify abuse or non-human traffic, then use documented capping or robust estimators only when aligned with the metric definition.
A depth mistake is invoking nonparametric tests as a magic fix. Mann-Whitney, KS, bootstrap, and permutation tests answer different questions and have different sensitivities. Interviewers expect you to say what estimand you care about, whether samples are independent, and whether user-level clustering or repeated measures affects standard errors.
Connections
This topic often leads into A/B testing under non-normal metrics, variance reduction methods like CUPED, quantile treatment effects, anomaly detection, and data quality investigations. If the interviewer pushes on causal validity, expect follow-ups on randomization units, interference, clustered standard errors, or heterogeneous treatment effects across user segments.
Further reading
- Huber, Robust Statistics — foundational treatment of robust estimators, influence functions, and breakdown points.
- Efron and Tibshirani, An Introduction to the Bootstrap — practical reference for bootstrap confidence intervals and uncertainty estimation.
- Dunning and Ertl, “Computing Extremely Accurate Quantiles Using t-Digests” — useful for understanding approximate quantiles in large-scale streaming systems.