Event Attribution, Deduplication, And Cohort SQL
Asked of: Data Scientist
Last updated
What's being tested
Interviewers are probing whether you can turn messy event logs into trustworthy metrics under realistic production constraints: duplicated events, late-arriving data, multiple identifiers, ambiguous attribution rules, and large-scale SQL performance. For Meta, this matters because product, ads, notifications, integrity, and growth decisions often depend on joining user actions across time and assigning credit correctly. The interviewer is not just testing whether you know ROW_NUMBER(); they want to see whether you can define the metric, encode the business logic, handle edge cases, and explain the bias introduced by your choices. Strong answers combine SQL mechanics with measurement judgment.
Core knowledge
-
Attribution requires an explicit unit, trigger, outcome, and window: for example, “attribute a purchase to the most recent ad click by the same user within 7 days before purchase.” Formally, eligible touches satisfy .
-
Common attribution models include last-touch, first-touch, linear, time-decay, and position-based. Last-touch is easiest in SQL and common operationally, but it over-credits lower-funnel surfaces; first-touch favors discovery; fractional methods require careful denominator logic and can complicate experiment readouts.
-
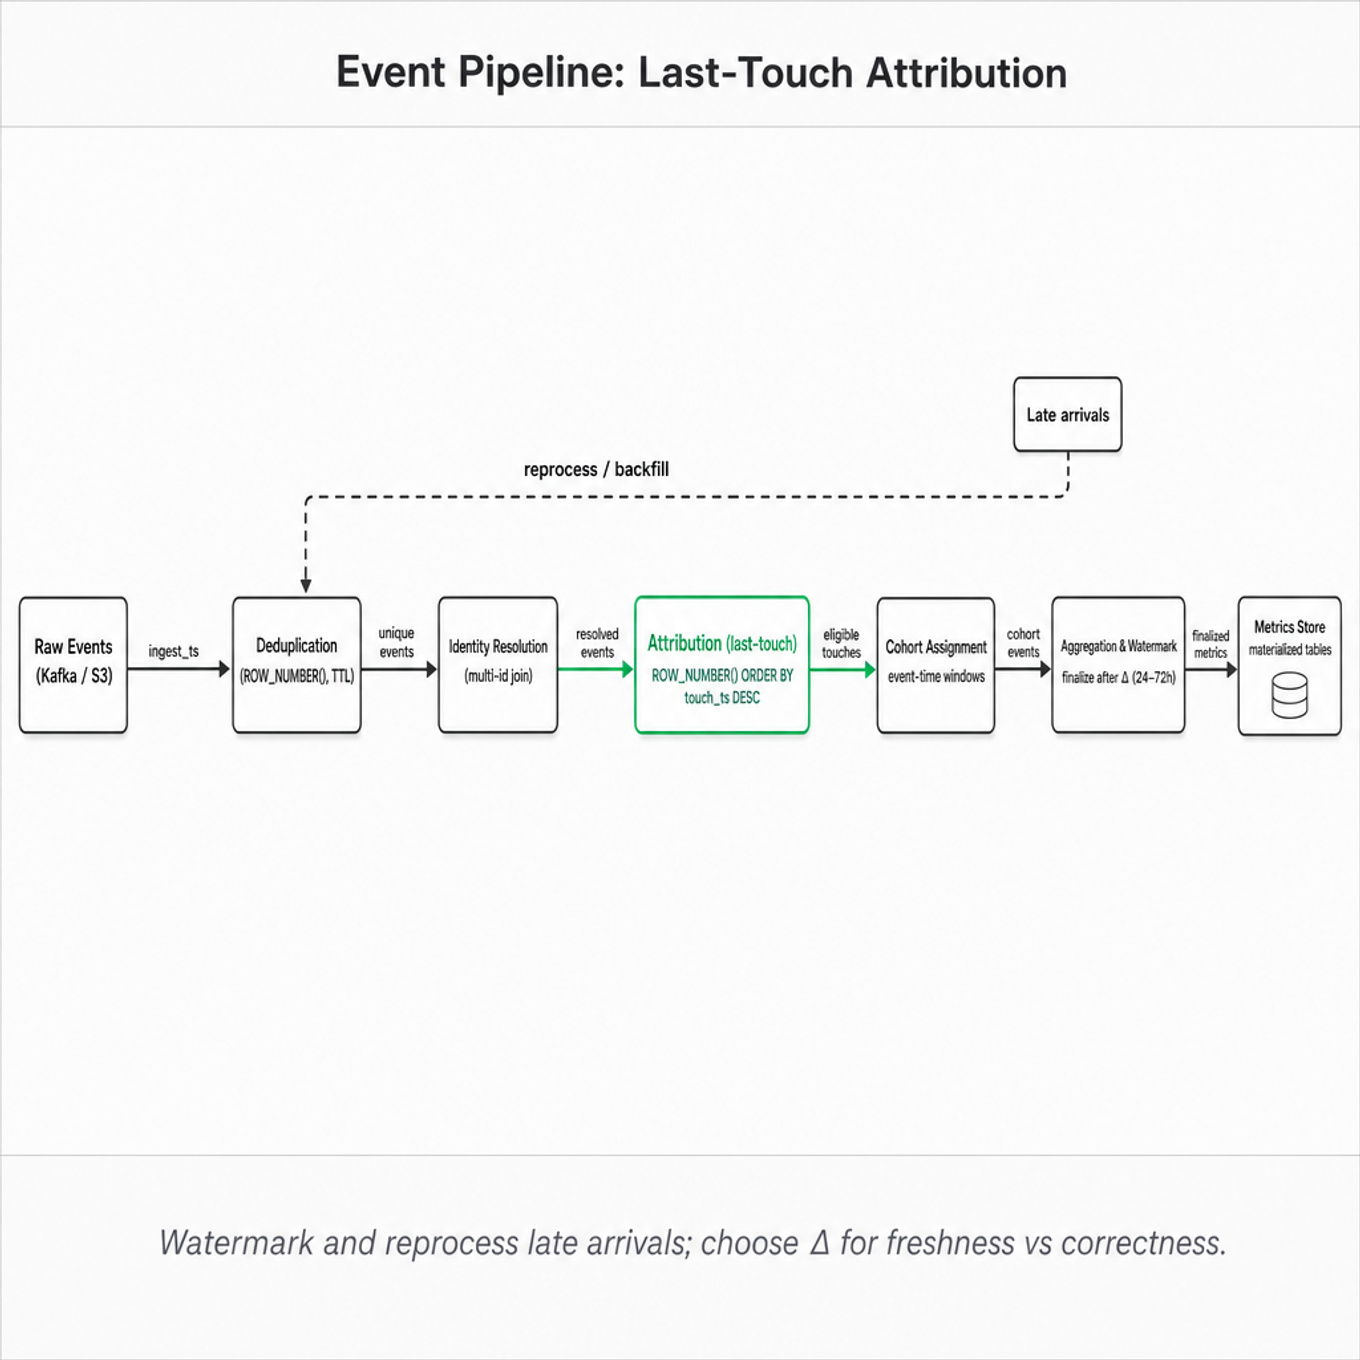
In SQL, last-touch attribution is usually solved by joining conversions to eligible touch events, then ranking:
ROW_NUMBER() OVER (PARTITION BY conversion_id ORDER BY touch_ts DESC) = 1. Add deterministic tie-breakers such astouch_id DESCto avoid nondeterministic outputs. -
Deduplication starts by defining what “duplicate” means. Best case: a stable
event_idgenerated client-side or server-side. If absent, use a compound key like(user_id, event_type, item_id, event_ts_bucket)but acknowledge false merges and missed duplicates. -
Use
ROW_NUMBER()for exact deduplication when data fits batch SQL scale. Example: keeprn = 1overPARTITION BY event_id ORDER BY ingestion_ts ASC. For streaming, use stateful deduplication with TTL in Flink, Spark Structured Streaming, Kafka Streams, or Beam. -
Late-arriving events create correctness versus freshness tradeoffs. A common pattern is watermarking: finalize metrics for event time after waiting , such as 24 or 72 hours. Longer windows improve accuracy but delay dashboards and experiment decisions.
-
Always distinguish event time from processing or ingestion time. Cohorts, attribution windows, and retention should usually use event time; pipeline monitoring and freshness should use ingestion time. Mixing them creates subtle bias, especially around mobile offline events.
-
Cohort analysis groups users by a start event, usually signup, first activation, install, or first exposure. Retention is typically with clear definitions for “active” and timezone.
-
For cohort SQL, avoid counting events when the metric is user-based. Use
COUNT(DISTINCT user_id)or pre-aggregate to one row per user per day. Otherwise heavy users inflate retention, conversion, or engagement rates. -
At Meta-scale, exact
COUNT(DISTINCT)can be expensive. HyperLogLog-style approximate distinct counting is useful for large dashboards, often with ~1–2% relative error depending on precision, but should be avoided when exact user-level joins are needed. -
Identity resolution is a major edge case. Attribution by
user_id,device_id, cookie, account center identity, or household produces different results. Logged-out, cross-device, privacy-limited, and deleted-user cases must be treated consistently and documented. -
Performance matters: partition by date, filter early, pre-aggregate events, avoid many-to-many explosions, and bound attribution joins with time predicates. A naive join of all clicks to all conversions by user can blow up; restrict to candidate windows before ranking.
Worked example
Attribute Conversions to Ads
A strong candidate would first clarify the business rule: “Are we attributing purchases to clicks, impressions, or both; what is the attribution window; do we want last-touch or fractional credit; and is the unit a conversion event or a user?” They would state an assumption, such as: “I’ll use last-click attribution within 7 days, one credited ad click per purchase, using event time and deduplicated input tables.” The answer should be organized around four pillars: clean the events, define eligible touch-conversion pairs, choose the winning touch, and aggregate metrics.
For cleaning, they would deduplicate clicks and conversions using stable IDs if available, otherwise a defensible compound key, keeping the earliest ingestion record. For eligibility, they would join conversions to clicks on user_id with click_ts <= conversion_ts and click_ts >= conversion_ts - INTERVAL '7' DAY. For attribution, they would use ROW_NUMBER() OVER (PARTITION BY conversion_id ORDER BY click_ts DESC, click_id DESC) and keep rn = 1. Then they could aggregate attributed conversions and revenue by ad_id, campaign_id, or advertiser.
One tradeoff to flag explicitly is that last-click attribution is simple and operationally clear, but it biases credit toward retargeting or lower-funnel ads. The candidate should also mention that if an experiment is available, causal lift beats observational attribution for decision-making. A strong close would be: “If I had more time, I’d add late-event backfills, compare last-click to impression-assisted metrics, and validate totals against raw conversion counts to ensure no over-attribution.”
A second angle
Compute Day-7 Retention by Signup Cohort
The same skills apply, but the framing shifts from assigning credit to preserving a clean denominator and numerator over time. Instead of ranking candidate touches, the key is defining the cohort table as one row per user with a cohort date, then joining to deduplicated activity events exactly seven days later. The candidate should clarify whether D7 means activity on the calendar day 7 days after signup, activity during the 7th 24-hour period, or activity any time within days 1–7. They should also ask whether to use user-local timezone or UTC, because cohort boundaries can shift materially for global products. The main tradeoff is strict retention definitions versus rolling or cumulative definitions, which often answer different product questions.
Common pitfalls
Analytical mistake: double-counting after joins. A tempting wrong answer is to join all clicks to all purchases and then COUNT(*) by campaign. This inflates conversions when multiple touches qualify; the better answer ranks eligible touches per conversion or explicitly assigns fractional credit that sums to one.
Communication mistake: skipping metric definitions. Saying “I’d calculate retention using active users divided by signups” is too vague. A stronger answer defines the cohort event, activity event, date grain, timezone, inclusion/exclusion rules, and whether the numerator is exact-day, rolling, or cumulative retention.
Depth mistake: assuming clean event IDs and real-time completeness. Many candidates write perfect SQL on ideal tables but ignore retries, offline mobile logging, bot traffic, schema changes, and delayed ingestion. Interviewers expect you to mention deduplication keys, watermarking/backfills, and validation checks such as attributed conversions never exceeding total deduplicated conversions.
Connections
From here, interviewers often pivot to experiment measurement, especially whether attribution metrics are causal or merely descriptive. They may also ask about funnel analysis, retention curves, incrementality testing, identity resolution, or large-scale SQL optimization in Presto/Trino, Hive, Spark, or streaming systems.
Further reading
- Designing Data-Intensive Applications — strong background on event logs, stream processing, exactly-once semantics, and distributed data tradeoffs.
- The Data Warehouse Toolkit by Kimball and Ross — useful for fact tables, grain, slowly changing dimensions, and cohort-friendly warehouse design.
- Google Dataflow Model paper — foundational treatment of event time, processing time, watermarks, and late data.