Instagram Product Analytics
Asked of: Data Scientist
Last updated
What's being tested
Meta is probing whether a Data Scientist can turn ambiguous product questions about Instagram, Facebook, Stories, Reels, and Shopping into measurable causal analyses. Strong answers define the right success metric, design a credible experiment or quasi-experiment, anticipate cannibalization across surfaces or apps, and explain metric movement without overclaiming. The interviewer cares less about naming many metrics and more about whether you can choose a primary objective, defend guardrails, segment users meaningfully, and reason from observed data to product decisions. For recommender and monetization questions, you also need to connect product value, user welfare, creator/ecosystem health, and business impact.
Core knowledge
-
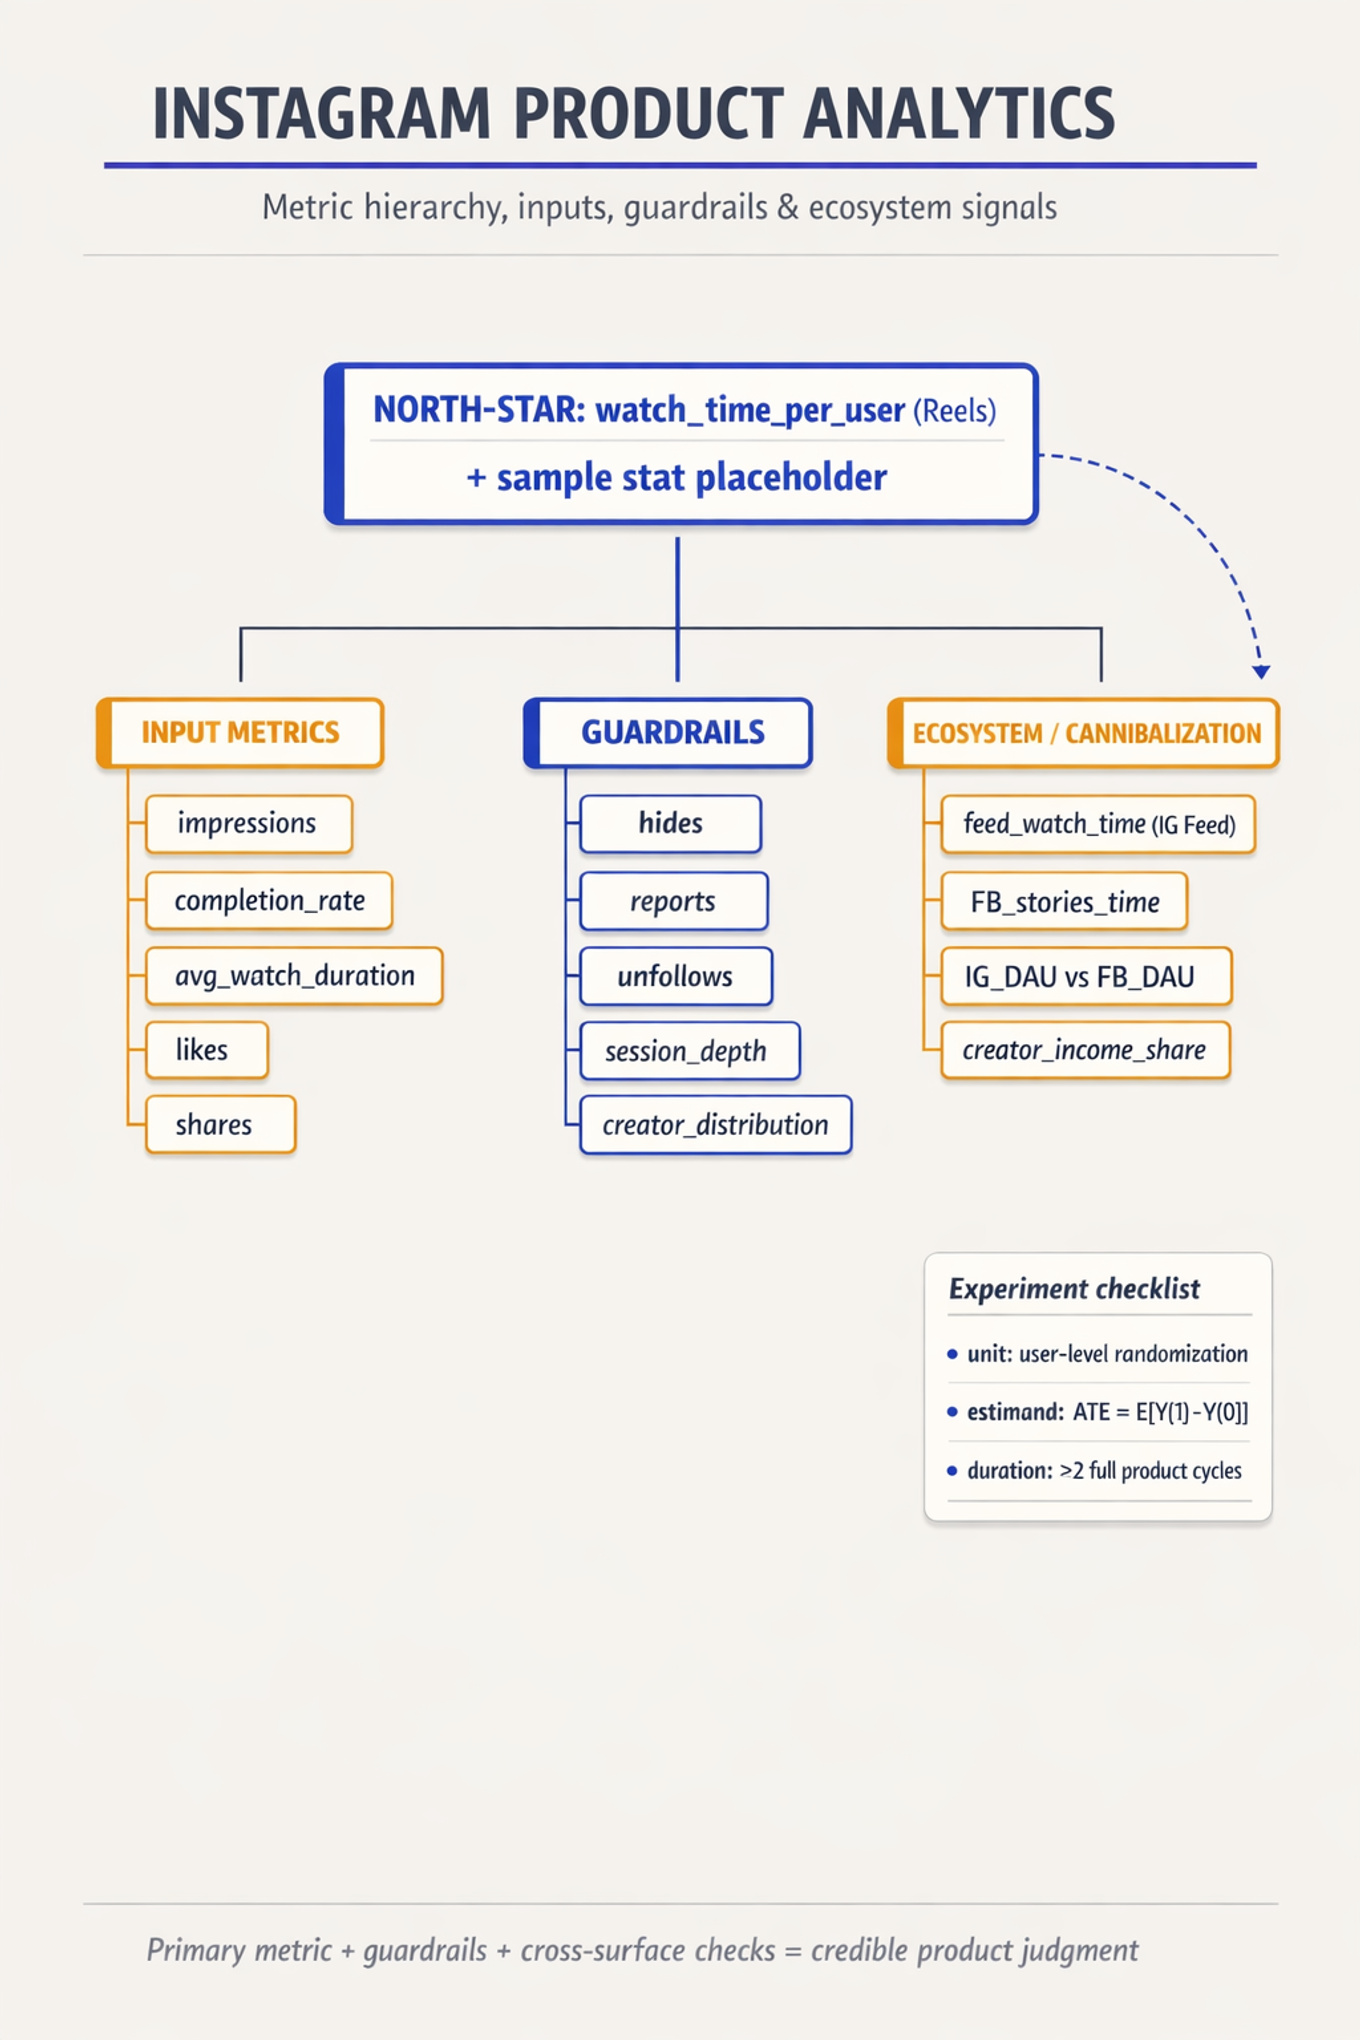
Metric hierarchy should separate a north-star metric, input metrics, and guardrails. For
Reels, a primary metric might bewatch_time_per_user, while inputs includeimpressions,completion_rate,likes,shares, and guardrails includehides,reports,unfollows,session_depth, and creator distribution. -
Primary metric choice must match product intent and avoid easy gaming.
total_watch_timecan rise from more users or more addictive low-quality sessions;watch_time_per_DAUcontrols for exposure but can hide user loss. Consider paired metrics likeD7_retentionormeaningful_social_interactions. -
Experiment design starts with unit, treatment, exposure, and duration. For feed ranking or short video changes, randomize at the user level to avoid mixed experiences; for creator-side interventions, consider creator-level or cluster randomization because viewers can be exposed to treated creators.
-
Causal estimand should be explicit: average treatment effect
ForInstagram StoriesversusFacebook Stories, the estimand may be incremental ecosystem engagement, not just app-local lift, because usage can move from one Meta app to another. -
Cannibalization is central to cross-surface launches. If
Instagram Storiesincreases by 10 minutes/user/day butFeeddrops by 8 andFacebook Storiesdrops by 5, the product-local win may be an ecosystem loss. Always inspect cross-app and cross-surface metrics when surfaces substitute for attention. -
Guardrail metrics protect against harmful launches. For recommender systems, include negative feedback rate, content diversity, creator concentration, integrity violations,
p95session length, teen usage safeguards if relevant, ad load tolerance, and retention. A launch with higher watch time but higher reports may not be acceptable. -
Power and variance determine whether an experiment is informative. Approximate sample size per arm for a continuous metric is
where is minimum detectable effect. Heavy-tailed metrics like watch time often need winsorization, log transforms, or nonparametric checks. -
CUPED / variance reduction uses pre-period behavior to improve sensitivity:
This is especially useful for stable user-level metrics like baselineDAU, prior watch time, or prior purchase propensity. -
Segmentation should be hypothesis-driven, not a fishing expedition. Useful cuts include new versus existing users, heavy versus light creators, age cohorts, geography, device class, prior
Storiesusage, shopping intent, and content interest clusters. Correct for multiple testing if segments drive decisions. -
Recommender evaluation needs both offline and online views. Offline metrics like
NDCG,AUC, calibration, and replay-based estimates are diagnostic, but online A/B tests capture feedback loops, exploration effects, creator incentives, and satisfaction changes that offline labels often miss. -
Revenue modeling for
Instagram Shoppingshould decompose the funnel:
Then test incrementality, because observed purchases may be shifted from organic clicks, external websites, or future purchases. -
Diagnostic reasoning moves from symptom to mechanism. If
Storiesusage is higher onInstagramthanFacebook, plausible causes include audience demographics, camera-first creation norms, social graph composition, creator adoption, notification entry points, content supply, and product placement—not just “younger users like Instagram.”
Worked example
For “Evaluate Instagram's Short-Video Recommender System Success”, a strong candidate would first clarify whether the goal is user engagement, long-term retention, creator ecosystem health, or revenue, because a recommender can optimize one while harming another. In the first 30 seconds, state assumptions: the system ranks short videos in a dedicated feed similar to Reels, the change is eligible for a user-level A/B test, and the launch decision should be based on incremental impact versus the current recommender. The answer can be organized into four pillars: define success metrics, design the experiment, analyze heterogeneous effects, and make a launch recommendation using guardrails.
For metrics, propose one primary metric such as qualified_watch_time_per_user or D7_retention depending on product strategy, then add input metrics like completion_rate, rewatch_rate, shares, and follow_after_view. Add guardrails for negative feedback, content diversity, creator concentration, integrity reports, and displacement of Feed, Stories, or messaging. For experiment design, randomize users, run long enough to capture novelty and retention effects, use pre-period covariates for variance reduction, and avoid peeking unless a pre-specified sequential testing method is used. One tradeoff to flag explicitly: optimizing for watch time can select sensational or repetitive content, so the launch criterion should require both primary metric lift and no statistically or practically meaningful degradation in satisfaction or safety guardrails. Close by saying that with more time you would inspect long-term ecosystem effects, such as whether new creators receive distribution or whether gains concentrate among a small set of high-performing accounts.
A second angle
For “Evaluating and launching Instagram Stories”, the same product analytics toolkit applies, but the key constraint is cross-product substitution rather than ranking quality. The primary question is not only whether Instagram Stories increases engagement, but whether it creates incremental value across Instagram, Facebook, and the broader Meta ecosystem. You would define local metrics like story creation rate, story viewers per creator, replies, and return frequency, then ecosystem guardrails such as Facebook Stories usage, Feed time, messaging, and total app time. The causal design may require holdouts by user or market, plus careful interpretation because social features have network effects: a treated user’s story can affect untreated viewers. The launch recommendation should distinguish “successful adoption” from “net incremental success.”
Common pitfalls
Pitfall: Treating engagement as automatically good.
A tempting answer is “launch if watch_time increases significantly.” That is too shallow for Meta-style product analytics because attention can be cannibalized, low quality, or unsafe. A stronger answer pairs engagement with retention, satisfaction, negative feedback, ecosystem displacement, and user/creator fairness.
Pitfall: Listing metrics without choosing a decision metric.
Candidates often name ten metrics and never say which one drives the decision. Interviewers want prioritization: “My primary metric is D7_retention because the goal is durable value; watch_time and shares are diagnostics; reports and hides are guardrails.” This shows product judgment and statistical discipline.
Pitfall: Ignoring interference and social spillovers.
For Stories, Shopping, or creator distribution changes, users are not independent atoms. A treated creator can influence control viewers, and a treated viewer can change reply behavior for untreated friends. Call out this risk and propose cluster-level analysis, network-aware sensitivity checks, or ecosystem metrics rather than pretending a simple user-level A/B test fully solves causality.
Connections
Interviewers may pivot from here into experimentation design, causal inference, metric design, recommender evaluation, or marketplace/revenue analytics. Be ready to discuss novelty effects, multiple testing, heterogeneous treatment effects, long-term holdouts, and how offline model quality relates to online product outcomes.
Further reading
-
Trustworthy Online Controlled Experiments — practical reference for A/B testing design, pitfalls, guardrails, and interpretation.
-
Causal Inference for the Brave and True — accessible treatment of causal estimands, selection bias, diff-in-diff, and observational methods.
-
Recommender Systems Handbook — broad coverage of recommender evaluation, ranking metrics, feedback loops, and system-level tradeoffs.
Practice questions
- Compare Instagram vs. Facebook using causal experimentsMeta · Data Scientist · Onsite · medium
- Explain why IG Story usage exceeds FacebookMeta · Data Scientist · Onsite · easy
- Estimate Instagram Shopping Feature's Revenue and Test ImpactMeta · Data Scientist · Onsite · hard
- Evaluate Instagram's Short-Video Recommender System SuccessMeta · Data Scientist · Onsite · medium
- Evaluating and launching Instagram StoriesMeta · Data Scientist · Onsite · medium
Related concepts
- Facebook And Instagram Product Surface AnalyticsAnalytics & Experimentation
- Facebook And Instagram Cross-App Analytics
- Facebook Product AnalyticsAnalytics & Experimentation
- Shop Ads And Social Commerce Analytics
- Statistical Inference For Product AnalyticsStatistics & Math
- Shop Visibility And Commerce AnalyticsData Manipulation (SQL/Python)