Linux Networking And Performance Fundamentals
Asked of: Software Engineer
Last updated
What's being tested
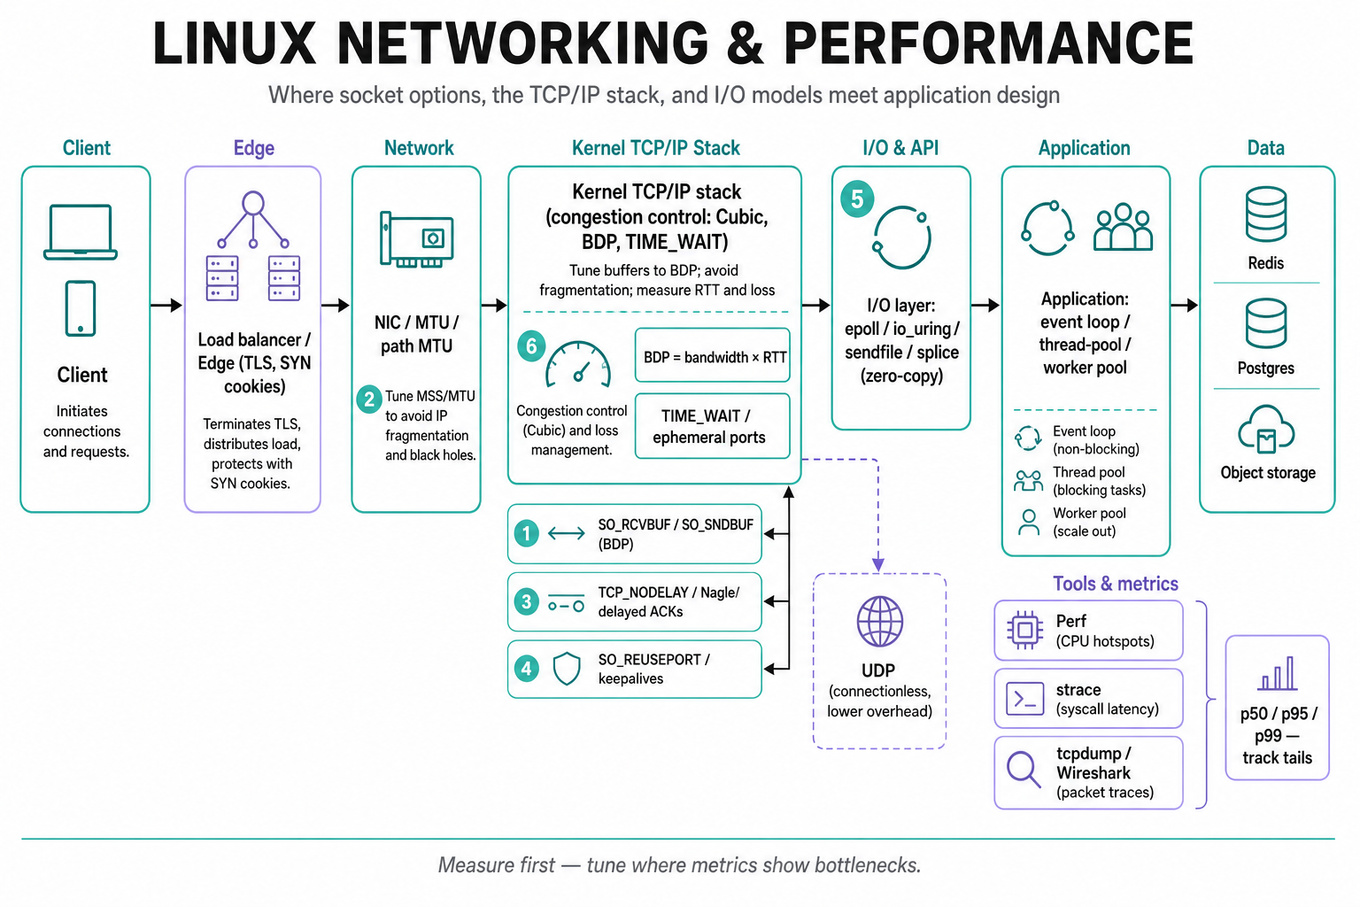
Interviewers expect you to reason about building low-latency, high-throughput networked services on Linux: knowing how the TCP/IP stack, socket options, and OS scheduling interact with application architecture. They probe measurement-first troubleshooting, tradeoffs between blocking threads and event-driven IO, and concrete tuning steps to reduce tail latency and increase throughput.
Core knowledge
-
TCP vs UDP:
TCPprovides reliable, ordered delivery and congestion control; UDP is connectionless and lower-overhead. Choose UDP for simple idempotent datagrams or when application handles loss and ordering. -
Bandwidth-Delay Product (BDP): BDP = bandwidth * RTT; tune send/receive buffers (
SO_RCVBUF,SO_SNDBUF) and congestion window to keep the pipe full for high throughput. -
MSS and MTU: MSS (max segment size) ≤ MTU - headers; fragmentation increases latency and CPU. Prefer path-MTU discovery and avoid forcing fragmentation.
-
Nagle, delayed ACKs, TCP_NODELAY: Nagle's algorithm batches small writes;
TCP_NODELAYdisables it. For small request/response RPCs, disable Nagle to avoid head-of-line delays; balance with extra packets. -
Connection lifecycle:
SYN,SYN-ACK,ACKhandshake plusTIME_WAITsemantics; many short-lived connections cause ephemeral-port exhaustion andTIME_WAITaccumulation — use connection pooling orSO_REUSEPORT/keepalives. -
Scaling models: thread-per-connection scales poorly past thousands (context switch costs); event-driven (
epoll,kqueue,io_uring) or hybrid thread-pool models handle C10k+ efficiently with fewer syscalls. -
IO system calls and zero-copy: Syscalls and copies cost CPU; use zero-copy primitives (
sendfile,splice,mmap) to reduce user/kernel copies for large transfers and lower CPU per-byte. -
Congestion control and loss: Linux uses loss- or delay-based algorithms (e.g., Cubic). Packet loss or bufferbloat triggers retransmits and
p99spikes. Profile with RTT and loss metrics, not only averages. -
Latency metrics and tail behavior: Track
p50,p95,p99and SLOs separately; the mean hides spikes. Tail often caused by GC, lock contention, scheduling, or network retransmit rather than steady-state throughput limits. -
Profiling and debugging tools: Use
perffor CPU hotspots,stracefor syscall latency,tcpdump/Wiresharkfor packet-level traces,ss/netstatfor socket states, and eBPF-based tools for low-overhead tracing.
Worked example — "Design a high-throughput TCP server for small RPCs"
Frame the problem: ask QPS, average/request size, target p99 latency, TLS requirement, client distribution, hardware (NICs, cores), and whether requests are idempotent. Organize the answer around (1) architecture: event-loop with worker thread-pool, SO_REUSEPORT to scale accept on multiple cores; (2) latency tuning: set TCP_NODELAY, small socket buffers tuned to BDP, and disable Nagle if requests are small; (3) throughput: reuse connections, use sendfile/zero-copy for large responses, and keep per-connection memory pooled to avoid allocations; (4) observability: instrument p50/p95/p99, collect per-core CPU, packet loss, and syscall latency. Explicit tradeoff: an async, epoll-based design minimizes context switches but increases complexity (callback/state machines); a thread-per-connection model is simpler but will saturate CPU and cause p99 tail when scaled. Close by proposing a short benchmarking plan (wrk/netperf), followed by profiling (perf, tcpdump) and iterative tuning of kernel buffers and accept backlog; if time allows, add TLS session resumption or consider hardware TLS offload.
A second angle — "Why is p99 latency high while average latency is low?"
Same fundamentals apply but focus on tail causes and measurement. Start by verifying measurement fidelity: ensure histograms, not just mean. Investigate GC/event-loop pauses, lock contention, CPU steal on noisy neighbors, retransmits and TCP fast retransmit timers, and bufferbloat causing variable RTTs. Collect traces: capture slow requests with stack traces + packet traces to correlate application stalls and network events. Mitigations include isolating cores (NUMA-aware allocation), reducing single-threaded critical sections, applying backpressure/load-shedding, using smaller request batches, and tuning kernel queuing discipline (e.g., fq_codel) to reduce bufferbloat.
Common pitfalls
Pitfall: Optimizing for mean latency instead of tail metrics.
Many candidates tune throughput or average latency; interviewers expect plans forp95/p99and mitigation strategies for rare but high-impact spikes.
Pitfall: Jumping to micro-optimizations without measurement.
Don't change socket options or data structures blindly — first reproduce the problem with benchmarks and trace data (perf,tcpdump), then apply targeted fixes.
Pitfall: Missing system-level constraints (ephemeral ports, accept backlog).
A design that opens/tears down connections for each RPC will hitTIME_WAIT, port exhaustion, or accept-queue drops; propose pooling and kernel parameter adjustments as part of your design.
Connections
Interviewers may pivot to distributed-systems topics like retries/backoff and idempotency, or to observability (tracing, distributed traces) when discussing latency sources. They might also ask about TLS performance implications or how cloud networking (service meshes/load balancers) changes your architecture.
Further reading
-
[TCP/IP Illustrated, Volume 1 — W. Richard Stevens] — canonical deep-dive on TCP mechanics and behavior.
-
[High Performance Browser Networking — Ilya Grigorik] — excellent chapters on BDP, TCP, and how OS/network interact; pragmatic tuning advice.
Related concepts
- Network Programming And ProtocolsSoftware Engineering Fundamentals
- Robust Networking, REST, And Concurrency ControlSystem Design
- Cloud Networking, CIDR, And Secure InfrastructureSystem Design
- Performance Profiling And Capacity Planning For C++ Services
- Reliability, Performance, And Infrastructure OperationsSystem Design
- PM Technical Fundamentals For Non-Technical Candidates