SQL Analytics Joins, Aggregations, And Windows
Asked of: Data Scientist
Last updated
What's being tested
Meta Data Scientists are expected to turn raw product logs into trustworthy metrics using SQL analytics: joins, aggregations, windows, time filters, cohorts, ratios, and ranking logic. Interviewers are probing whether you can preserve the correct unit of analysis, avoid double counting, handle missing or zero-denominator cases, and explain performance tradeoffs without drifting into data engineering. The goal is not just syntactically valid SQL; it is whether your query answers the business question behind metrics like CTR, DAU, revenue share, retention, visibility, or call concurrency. Strong answers show you can reason from schema grain to metric definition to edge cases.
Core knowledge
-
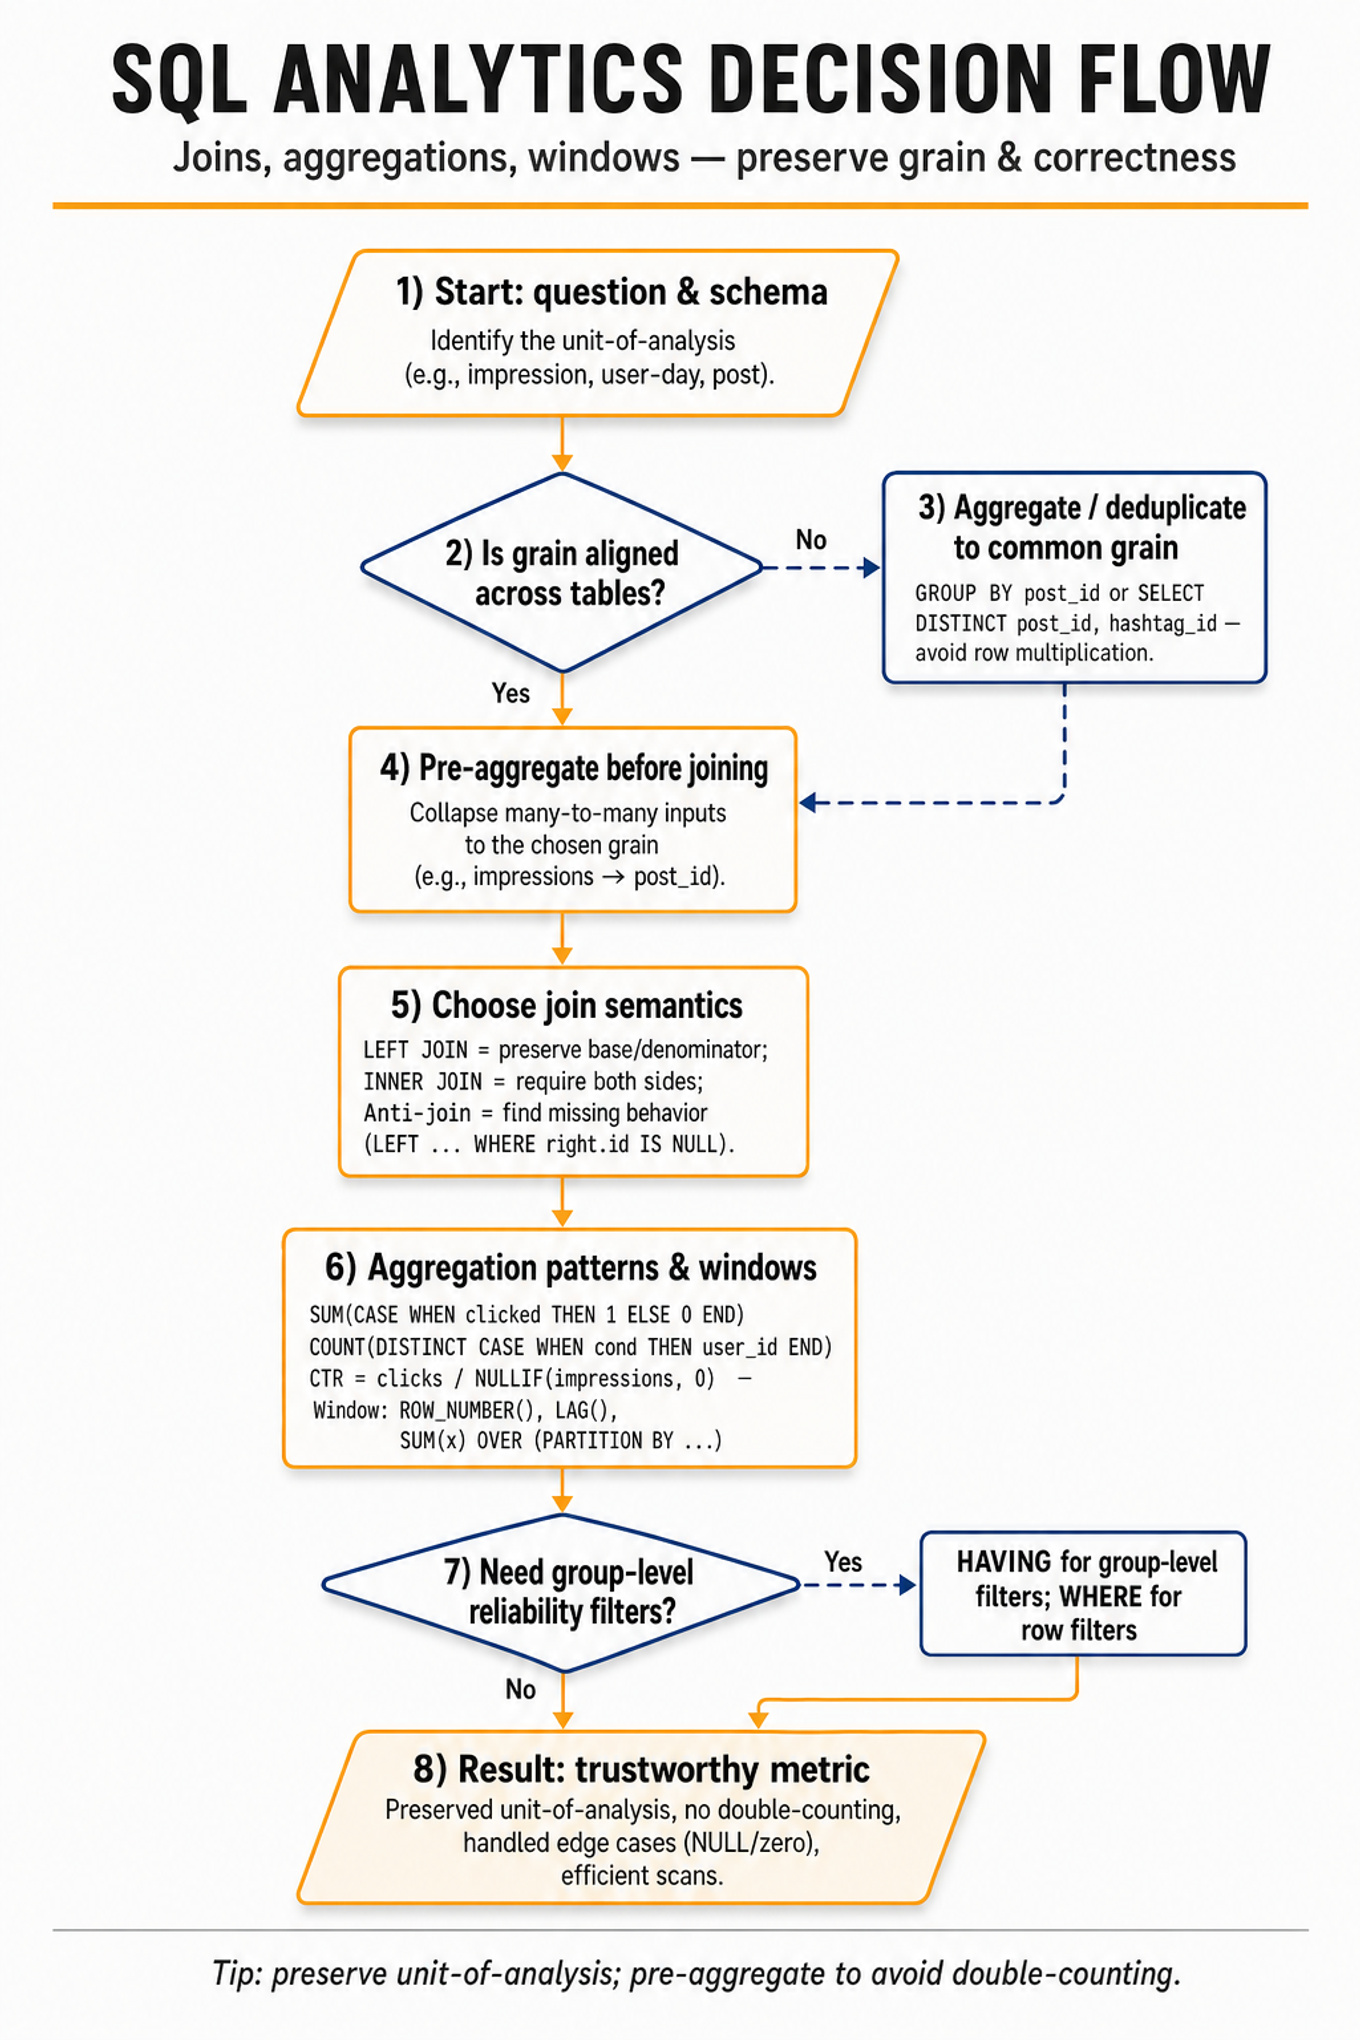
Grain is the first thing to identify: one row per impression, post, user-day, call participant, advertiser-month, etc. Most mistakes come from joining tables at incompatible grains, causing row multiplication before aggregation and inflating metrics like viewers, clicks, revenue, or active users.
-
Join semantics matter analytically. Use an
INNER JOINwhen requiring presence in both tables, aLEFT JOINwhen preserving a base population, and an anti-join pattern when finding missing behavior. For funnel metrics, the denominator table usually belongs on the left. -
Pre-aggregation before joining prevents duplication. If
impressionshas many rows per post andhashtagshas many hashtags per post, join after aggregating topost_idor deduplicating withSELECT DISTINCT post_id, hashtag_id; otherwise each impression may be counted once per hashtag. -
Conditional aggregation is the standard pattern for segmented metrics:
SUM(CASE WHEN condition THEN 1 ELSE 0 END),COUNT(DISTINCT CASE WHEN condition THEN user_id END), and ratios like . InPostgres, useNULLIF(impressions, 0)to avoid division-by-zero. -
HAVING filters groups after aggregation, while
WHEREfilters rows before aggregation. For example,WHERE event_date >= ...limits the scan;HAVING COUNT(DISTINCT user_id) >= 100enforces a post-aggregation reliability threshold. Mixing them changes both correctness and performance. -
Window functions compute ranking, running totals, percentiles, and cohort-relative metrics without collapsing rows. Common patterns include
ROW_NUMBER()for tie-breaking,RANK()for shared ranks,LAG()for day-over-day change, andSUM(x) OVER (PARTITION BY user_id ORDER BY date)for cumulative activity. -
Date filtering should be explicit about boundaries. Prefer half-open intervals such as
event_time >= '2024-01-01' AND event_time < '2024-02-01'overBETWEEN, especially when timestamps include hours, minutes, and seconds. Align to product timezone if the metric is user-facing. -
Distinct counts are expensive and semantically delicate.
COUNT(DISTINCT user_id)is exact but can be slow at Meta-scale; systems likePresto/Trinooften support approximate cardinality via HyperLogLog, trading small error, often around 1–2%, for major speed and memory savings. -
Cohort analysis usually fixes users by an anchor date or event, then measures later behavior relative to that anchor. Retention can be expressed as with clear inclusion and censoring rules.
-
Concurrency analysis for calls or sessions is an interval problem, not a simple count. A scalable SQL approach is the sweep-line algorithm: emit
+1at start time and-1at end time, order events, then compute running sum usingSUM(delta) OVER (ORDER BY ts). -
Ranking and tie-breaking must be deterministic. If asked for top hashtags, advertisers, or posts, define whether ties share a rank via
RANK()/DENSE_RANK()or are broken by a secondary key likecreated_at,post_id, or revenue. Ambiguous ranking creates non-reproducible dashboards. -
Query efficiency is part of analytical competence. Filter early on partition-like columns such as
dsorevent_date, select only needed columns, pre-aggregate large fact tables, and avoid unnecessaryCOUNT(DISTINCT ...). For rows up to ~10M, exact SQL is usually fine; beyond that, approximation or staged aggregation may be needed.
Tip: In interviews, narrate the grain of every CTE: “This CTE is one row per user per day,” or “This one is one row per post per hashtag.” That single habit prevents many hidden correctness bugs.
Worked example
For Write SQL for hashtag analytics and joins, a strong candidate starts by clarifying the metric grain: “Are we calculating unique viewers per hashtag over a date window, post-level CTR, or recommending hashtags for a specific user/post?” They would ask whether repeated views by the same user count once, whether hashtag assignments are unique per post, and whether deleted/private posts should be excluded. The answer skeleton would be: first define the base post set with date and visibility filters; second deduplicate hashtag-post relationships; third aggregate impressions and clicks at the right grain; fourth compute ratios and ranks with deterministic tie-breaking.
A candidate might say: “I’ll pre-aggregate impressions and clicks to post_id before joining to hashtags, because joining event-level impressions directly to a many-to-many hashtag table can multiply rows.” For CTR, they should use something like clicks * 1.0 / NULLIF(impressions, 0) and decide whether posts with zero impressions should show NULL, zero, or be excluded. For unique viewers, they should distinguish COUNT(*) from COUNT(DISTINCT viewer_id), and explain the tradeoff between exact and approximate distinct counts if the log table is very large. A useful design decision to flag is LEFT JOIN versus INNER JOIN: if the goal is all hashtags including those with zero views, preserve the hashtag dimension with a left join; if the goal is only active hashtags, an inner join is acceptable. They should close with: “If I had more time, I’d validate row counts at each CTE, check for duplicate hashtag mappings, and compare top results against a known dashboard or sampled manual calculation.”
A second angle
For Write SQL to analyze group-call concurrency, the same SQL foundations apply, but the hard part shifts from many-to-many joins to temporal intervals. Instead of counting calls directly, you transform each call into start and end events, then use a windowed running sum to estimate concurrent active calls or participants at each timestamp. The grain must be explicit: concurrency of calls, users, or participants can produce different answers. Percentiles add another layer: computing p95 concurrency across minutes differs from computing p95 across raw event transition points, so the candidate should state the time bucket or sampling method. The key transfer is still the same: define the unit, aggregate at that unit, and only then apply windows or rankings.
Common pitfalls
Pitfall: Treating
COUNT(*)as a universal metric.
If the prompt asks for unique viewers, active advertisers, or users in a cohort, COUNT(*) is usually wrong because event logs often contain multiple rows per entity. A stronger answer says, “At the event grain this counts events; for users I need COUNT(DISTINCT user_id) or a deduplicated user-level CTE.”
Pitfall: Writing SQL before clarifying the denominator.
For metrics like CTR, revenue share, retention, or visibility rate, the denominator defines the metric. A tempting but weak answer is to jump into joins; a better answer first states, “My denominator is all eligible impressions/posts/users in the window, including those with zero clicks unless the business definition excludes them.”
Pitfall: Ignoring tie-breaking, nulls, and missing periods.
Top-N queries and monthly advertiser analyses often fail on edge cases: tied ranks, advertisers with no spend in a month, or null revenue after a left join. Interviewers notice whether you use COALESCE, deterministic ordering, calendar tables, or explicit missing-period logic rather than returning only rows that happen to exist.
Connections
Interviewers may pivot from SQL mechanics into metric design, experimentation analysis, cohort retention, or anomaly diagnosis. If they push beyond the query, expect questions about whether the metric is causally interpretable, how sampling or approximate counts affect decision-making, and how you would validate a dashboard against product behavior.
Further reading
-
Mode SQL Tutorial — Practical coverage of joins, aggregations, windows, and analytical query patterns.
-
PostgreSQL Window Functions Documentation — Clear reference for
ROW_NUMBER,RANK,LAG, and window frames. -
HyperLogLog: the analysis of a near-optimal cardinality estimation algorithm — Seminal paper behind approximate distinct counting used in large-scale analytics.
Practice questions
- Compute ad revenue metrics by geography in SQLMeta · Data Scientist · Technical Screen · medium
- Compute CTR overall and by campaign typeMeta · Data Scientist · Technical Screen · medium
- Write SQL for visibility, calls, and cohort activityMeta · Data Scientist · HR Screen · medium
- Calculate posts per DAU by country todayMeta · Data Scientist · Technical Screen · medium
- Write SQL with HAVING and efficient joinsMeta · Data Scientist · Technical Screen · medium
- Write SQL for comment analyticsMeta · Data Scientist · Onsite · medium
- Compute feed ad frequency and retention in SQLMeta · Data Scientist · Onsite · medium
- Join datasets and compute conversion by assignmentMeta · Data Scientist · Technical Screen · medium
Related concepts
- SQL AnalyticsData Manipulation (SQL/Python)
- SQL Analytical QueryingData Manipulation (SQL/Python)
- SQL Analytics And Event Data ManipulationData Manipulation (SQL/Python)
- SQL Window Functions And AnalyticsData Manipulation (SQL/Python)
- SQL Product AnalyticsData Manipulation (SQL/Python)
- SQL Window Functions And Temporal JoinsData Manipulation (SQL/Python)