Data Pipeline Reliability And Stream Processing
Asked of: Data Scientist
Last updated
What's being tested
These problems test practical SQL/Python data-manipulation skills: joining event and reference tables, computing per-entity metrics, and using window functions to handle ordering, deduplication and week-over-week changes. Interviewers probe whether you can produce correct, auditable metrics from messy time-series data and explain tradeoffs for edge cases.
Patterns & templates
-
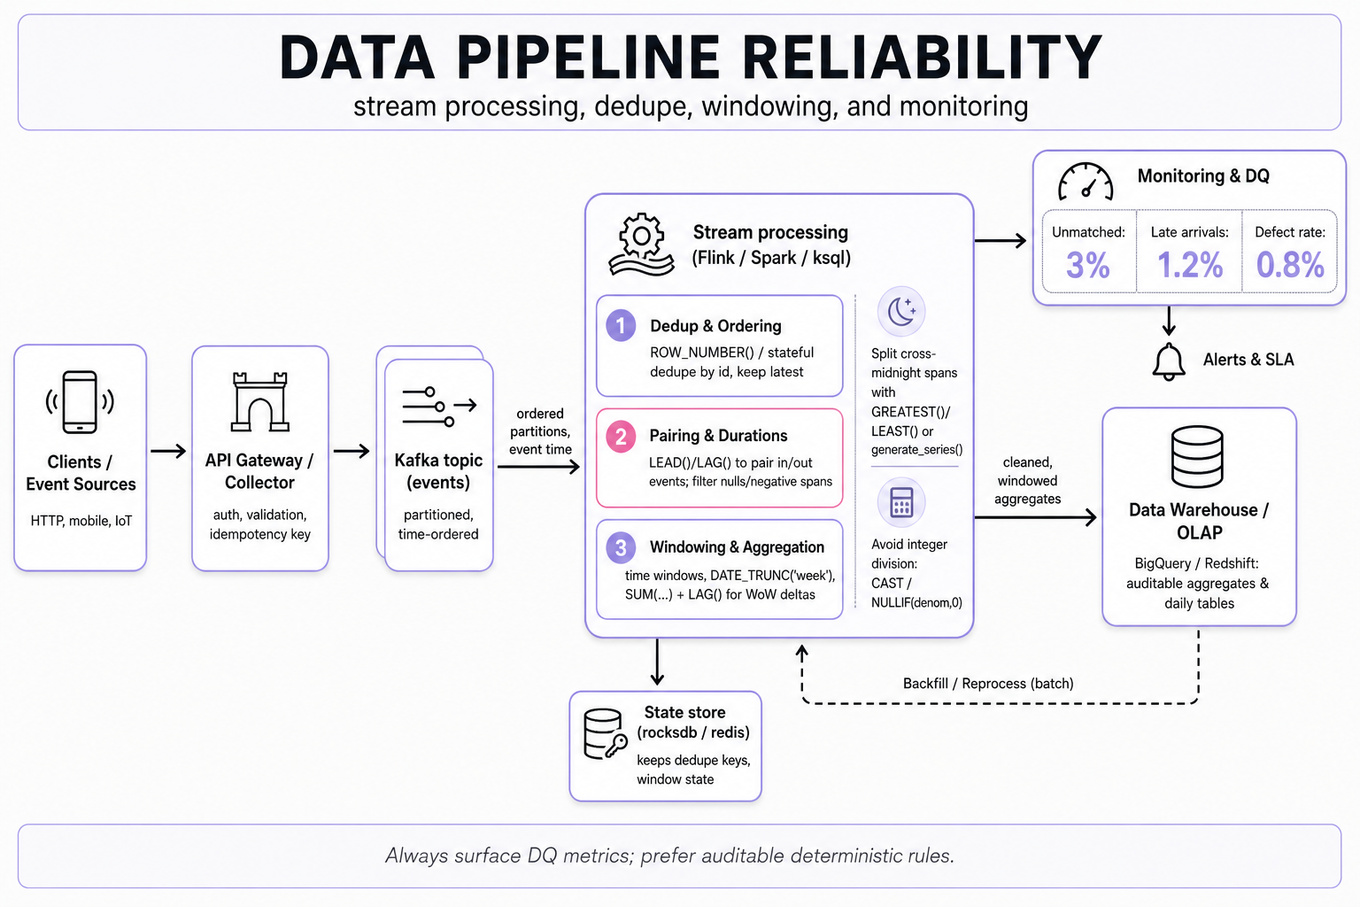
ROW_NUMBER()over partitions for deduping:ROW_NUMBER() OVER (PARTITION BY id ORDER BY ts DESC)to keep the latest record. -
Pair in/out events with
LEAD()/LAG()— compute durations aslead(ts)-ts, filter nulls and negative spans. -
Split cross-midnight shifts by truncating and using
GREATEST()/LEAST()orgenerate_series()for per-day allocation. -
Aggregate defects:
SUM(CASE WHEN condition THEN 1 ELSE 0 END)and defect rate =defects/NULLIF(total,0). -
Week-over-week: use
DATE_TRUNC('week', dt)thenSUM(...)+LAG()window to compute changes and percent deltas. -
Use
GROUP BY+ORDER BYwithROW_NUMBER()to extract top-N lanes/carriers per metric; tie-break on stable key (e.g.,carrier_id).
Common pitfalls
Pitfall: Pairing events by simple self-join without ordering — leads to wrong durations when multiple ins or outs exist. Always order and dedupe first.
Pitfall: Dividing by zero or using integer division — wrap denominators with
NULLIFand cast to numeric to avoid truncation.
Pitfall: Ignoring late-arriving or duplicate events — surface a data-quality metric (e.g., percent unmatched events) instead of assuming perfect data.
Practice these
the practice cards below cover the canonical variants — solve all of them and time yourself
Practice questions
- Design idempotent daily loads with dedupingAmazon · Data Scientist · Technical Screen · medium
- Compute daily work hours from in/out eventsAmazon · Data Scientist · Onsite · medium
- Process real-time enter/exit events and activesAmazon · Data Scientist · Onsite · medium
- Calculate Defect Rate and Identify Top Lanes for CarriersAmazon · Data Scientist · Technical Screen · medium
- Identify Key Metrics for Monitoring Shipment DefectsAmazon · Data Scientist · Technical Screen · medium
- Design Incremental Load Process for Large Relational TableAmazon · Data Scientist · Technical Screen · medium
Related concepts
- Distributed Data Processing PipelinesSystem Design
- End-To-End ETL Pipeline Case Design
- Distributed Batch Processing With Partial AggregationSystem Design
- High-Throughput Streams, Jobs, And ObservabilitySystem Design
- Event Ingestion And Streaming AnalyticsSystem Design
- Google-Scale Data Quality And Pipeline Reliability