Event Ingestion And Streaming Analytics
Asked of: Software Engineer
Last updated
What's being tested
These interviews test whether you can design a high-throughput event pipeline that accepts client/server events, preserves enough correctness for analytics, and serves both real-time and historical queries. The interviewer is probing your ability to reason about ingestion APIs, stream processing, storage models, deduplication, backpressure, latency, and failure recovery without losing sight of product-facing requirements like dashboards, alerts, and auditability. Rippling cares because many core systems generate operational events: employee actions, payroll workflows, device activity, approvals, integrations, and compliance logs. A strong Software Engineer answer should show practical distributed-systems judgment: what must be strongly correct, what can be eventually consistent, and how the system behaves under spikes, retries, and partial outages.
Core knowledge
-
Start from requirements: ask for event volume, event size, write/read ratio, latency target, retention, query patterns, and correctness expectations. A design for 10K events/sec with 5-second dashboard freshness differs from 5M events/sec with sub-second alerting and 7-year compliance retention.
-
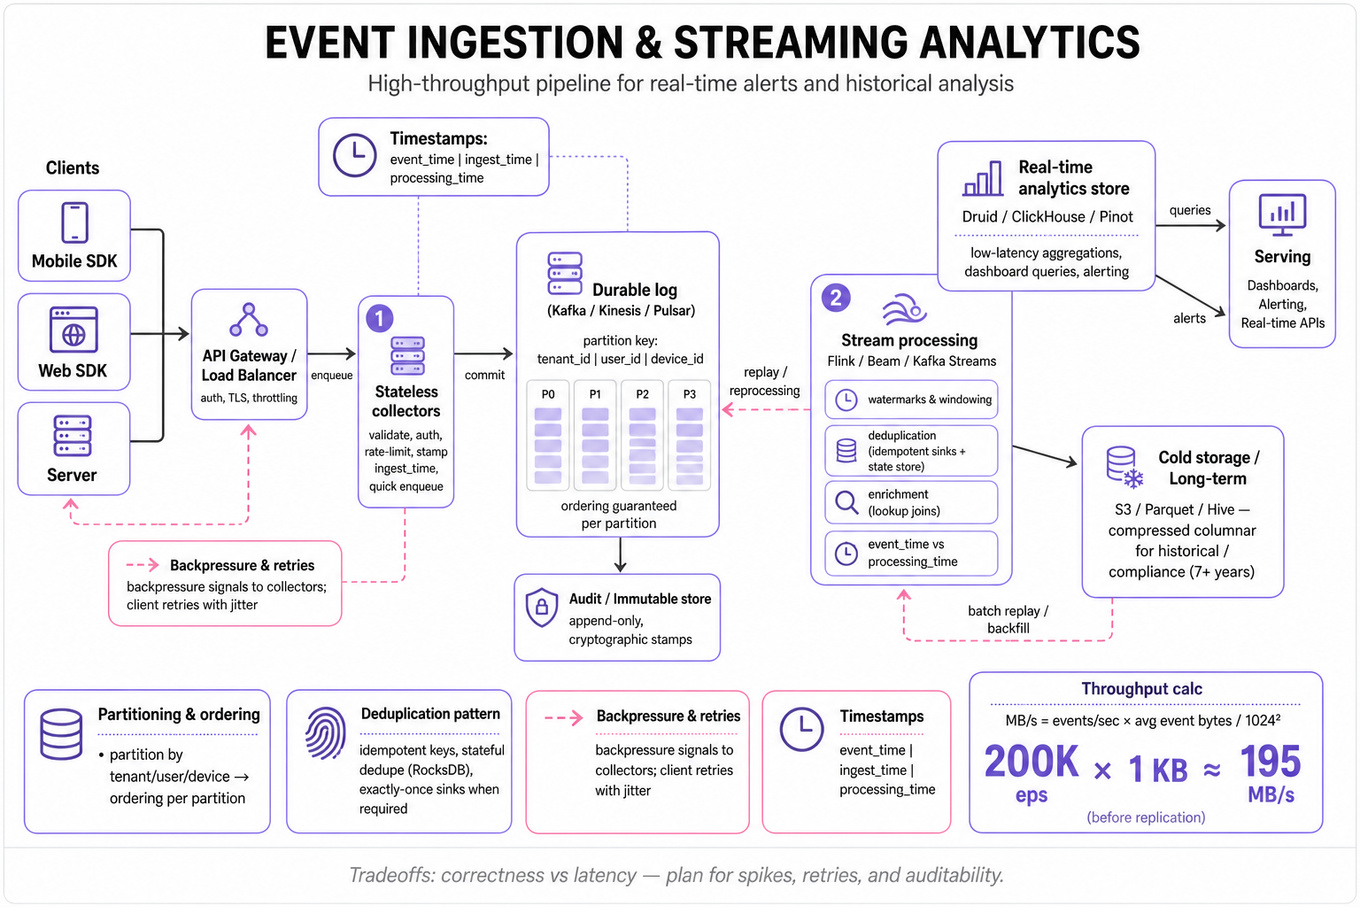
Use an ingestion layer to decouple producers from storage. A typical path is client/server SDKs →
API Gatewayor load balancer → stateless collectors → durable log such asKafka,Kinesis, orPulsar. Collectors validate, authenticate, rate-limit, stamp server receive time, and enqueue quickly. -
Separate event time from processing time.
event_timeis when the action happened;ingest_timeis when the backend received it;processing_timeis when the stream job saw it. Real systems need all three because mobile clients, offline devices, retries, and clock skew produce out-of-order data. -
Partitioning determines scalability and ordering. Partition by
tenant_id,user_id,device_id, ordelivery_iddepending on the query and ordering needs.Kafkaonly guarantees ordering within a partition, so “all events for one user in order” implies partitioning by user or routing related keys consistently. -
Throughput math should be explicit. Estimate write bandwidth as
For 200K events/sec at 1 KB each, ingestion is about 195 MB/sec before replication, indexes, and enrichment overhead.
-
Deduplication is mandatory when clients retry. Use an idempotency key such as
event_id = UUIDv7or a deterministic key liketenant_id:user_id:client_sequence. Store recent IDs inRedis, a compactedKafkatopic, or stream processor state with TTL. Exactly-once is expensive; “effectively once” via idempotent writes is usually the practical target. -
Choose storage by access pattern. Raw immutable events can live in
S3/object storage for cheap retention and replay. Aggregates can live inRedis,DynamoDB,Cassandra,ClickHouse,Druid,Pinot, orElasticsearchdepending on whether the workload is key-value lookup, time-series aggregation, OLAP slicing, or full-text search. -
Real-time analytics usually needs pre-aggregation. A dashboard asking “active users per minute by tenant” should not scan raw events on every refresh. Use stream jobs in
Flink,Spark Structured Streaming,Kafka Streams, or consumers that maintain tumbling/sliding window aggregates likecount(distinct user_id)orsum(clicks). -
Windowing has correctness tradeoffs. A tumbling window has fixed non-overlapping buckets; a sliding window overlaps; a session window groups activity separated by inactivity. Late events require a watermark and allowed lateness policy, e.g., close a 1-minute window after
event_time + 2 minutes, then emit corrections for later arrivals. -
Backpressure and load shedding must be designed. If stream consumers fall behind, queue lag grows and dashboards become stale. Protect the system with bounded queues, autoscaling consumers, rate limits per tenant, circuit breakers, and graceful degradation such as sampling low-value events while preserving critical audit events.
-
Schema evolution should be boring and safe. Events need
event_name,schema_version,tenant_id,actor_id,entity_id,event_time,event_id, and a typed payload. Prefer backward-compatible changes: add nullable fields, avoid renaming existing fields, and keep unknown fields tolerable for older consumers. -
Observability is part of the design. Track
ingest_qps,ingest_error_rate,queue_lag_seconds,consumer_lag,dropped_events,dedupe_rate,p95/p99latency, and aggregate freshness. Include replay tooling because bugs in stream logic should be fixable by reprocessing raw events.
Worked example
For “Design a user behavior monitoring system”, a strong candidate starts by clarifying whether the system is for product analytics, security monitoring, or operational debugging, because those imply different latency and retention requirements. In the first 30 seconds, say something like: “I’ll assume 100M events/day, multi-tenant traffic, near-real-time dashboards within 10 seconds, and raw event retention for replay.” Then organize the answer around four pillars: event producers and SDK/API contract, durable ingestion through Kafka-like storage, stream processing for aggregates and alerts, and serving stores for real-time plus historical queries.
For ingestion, describe stateless collectors behind a load balancer that authenticate tenants, validate schemas, assign server timestamps, and write to partitioned topics. For processing, explain that consumers enrich events with tenant/user metadata, deduplicate by event_id, and maintain windowed counters. For storage, keep raw events in object storage, recent searchable events in ClickHouse or Elasticsearch, and hot dashboard aggregates in Redis or an OLAP store. A useful tradeoff to flag is whether to optimize for exact distinct counts or approximate cardinality using HyperLogLog; exact counts are costly at high scale, while approximations are often acceptable for monitoring. Close by saying that with more time you would detail privacy controls, per-tenant rate limits, replay/backfill behavior, and alerting for pipeline lag.
A second angle
For “Design a real-time delivery dashboard”, the same event-streaming backbone applies, but the dominant constraint shifts from generic event analytics to location freshness and stateful entity tracking. Instead of only counting events, the system must maintain the latest state per delivery driver or order: last GPS point, status, ETA, and assignment. Partitioning by delivery_id or driver_id matters because you want ordered updates for each moving entity. The serving layer may need geospatial indexes such as PostGIS, Redis GEO, geohashes, or S2 cells to answer “show active deliveries in this viewport.” The tradeoff becomes freshness versus cost: updating every GPS ping gives smoother maps but can overwhelm storage and clients, so you may throttle, coalesce, or send only significant location changes.
Common pitfalls
Pitfall: Designing only the happy path: client sends event, backend stores it, dashboard reads it.
A better answer discusses retries, duplicate events, delayed mobile uploads, consumer lag, poison messages, partial outages, and replay. Interviewers want to hear how the system behaves when Kafka is slow, one tenant floods the service, or a stream job deploy introduces a bad aggregation.
Pitfall: Claiming “exactly-once processing” without explaining the mechanism.
In most real systems, exactly-once semantics require coordination between the stream processor, offsets, transactions, and the sink, and many sinks do not support it cleanly. A stronger Software Engineer answer says: “I’ll make writes idempotent using event_id, commit offsets after durable writes, and design aggregates to tolerate replay.”
Pitfall: Jumping into tools before naming the access patterns.
Saying “use Kafka, Flink, and Cassandra” is not a design by itself. First identify the required reads: latest status lookup, time-series dashboard, ad hoc filtering, alert triggers, raw replay, or compliance audit. Then map each read/write pattern to the simplest storage and processing model that satisfies it.
Connections
An interviewer can pivot from here into rate limiting, idempotent API design, distributed counters, log-based architectures, geospatial indexing, or observability systems. They may also ask you to compare push versus pull dashboards, batch versus streaming computation, or consistency versus availability during regional failures.
Further reading
-
Designing Data-Intensive Applications — best single source for logs, streams, replication, partitioning, and storage tradeoffs.
-
The Log: What every software engineer should know about real-time data’s unifying abstraction — explains why append-only logs underpin systems like
Kafka. -
Google Dataflow Model paper — deep treatment of event time, watermarks, windows, and late data.
Featured in interview prep guides
Practice questions
- Design a user behavior tracking systemRippling · Software Engineer · Technical Screen · hard
- Design a scalable logging systemRippling · Software Engineer · Onsite · medium
- Design a user behavior monitoring systemRippling · Software Engineer · Onsite · medium
- Design an ad-click aggregation and enrichment pipelineRippling · Software Engineer · Onsite · medium
- Design a real-time delivery dashboardRippling · Software Engineer · Technical Screen · hard
Related concepts
- High-Throughput Streams, Jobs, And ObservabilitySystem Design
- Real-Time Top-K And Streaming AnalyticsSystem Design
- Data Pipeline Reliability And Stream ProcessingData Manipulation (SQL/Python)
- SQL Analytics And Event Data ManipulationData Manipulation (SQL/Python)
- Streaming Aggregation And Top-K SelectionCoding & Algorithms
- Streaming, Large Inputs, And External MemorySoftware Engineering Fundamentals