Event Instrumentation And Data Quality
Asked of: Data Scientist
Last updated
What's being tested
Interviewers are testing whether you can turn ambiguous product behavior into reliable, analyzable data. This is not just about naming events; it is about defining what should be logged, where it should be logged, how to validate it, and how downstream metrics can break. Meta cares because product decisions, experimentation, ranking systems, integrity enforcement, and revenue measurement all depend on trustworthy behavioral data at massive scale. A strong Data Scientist should be able to reason about instrumentation as a measurement system: what is observed, what is missed, what is biased, and how failures would appear in metrics.
Core knowledge
-
Good instrumentation starts from the metric and decision, not from the UI component. Define the product question, numerator, denominator, unit of analysis, attribution window, and segmentation before choosing events. For example, “share rate” could be shares per viewer, per session, per creator, or per impression.
-
An event schema should include at minimum:
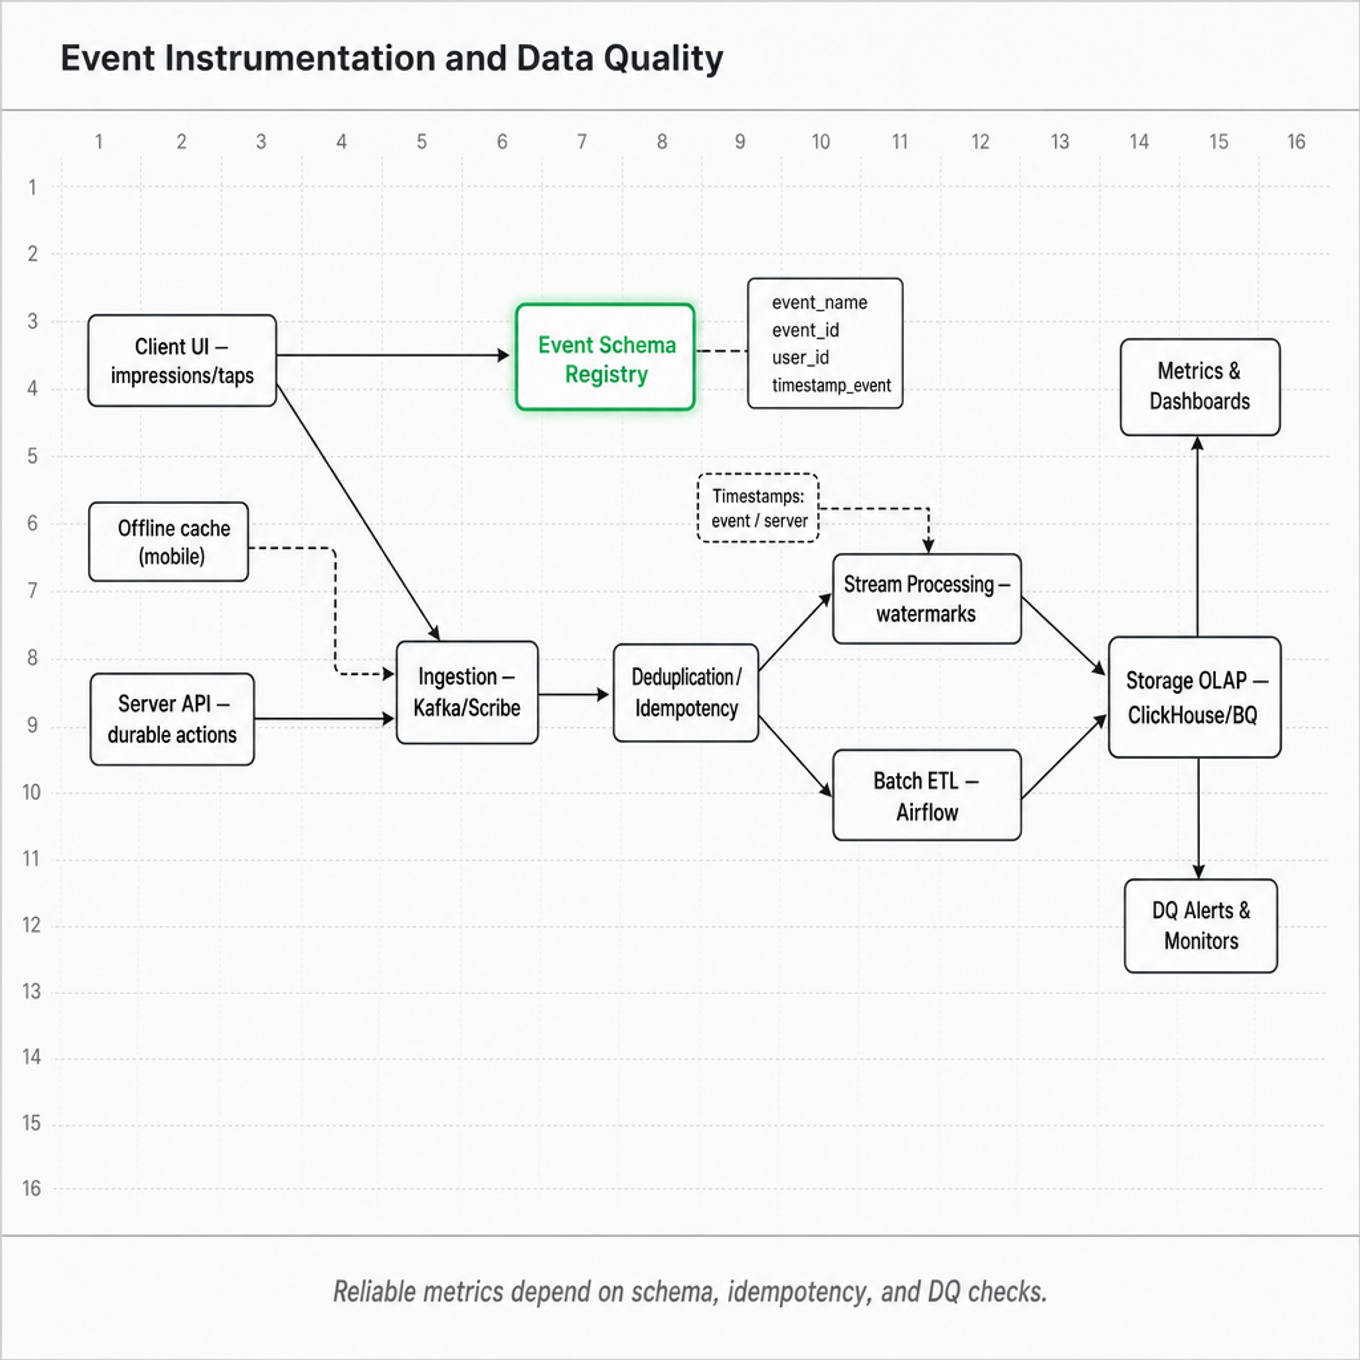
event_name,event_id,user_id,device_id,session_id,timestamp_event,timestamp_server,surface,app_version,platform,experiment_ids, and relevant object IDs. Avoid logging only display strings or client-local state that cannot be joined reliably downstream. -
Client-side and server-side logging have different biases. Client logs capture user-visible behavior such as impressions, taps, scroll depth, and dismissals, but suffer from offline usage, app crashes, ad blockers, clock skew, and dropped uploads. Server logs are more reliable for durable actions such as posts, payments, messages, and follows, but may miss exposure or intent.
-
Event time and processing time must be separated. For real-time pipelines using Kafka/Scribe-like append-only logs, Flink/Spark Streaming, or Scuba-style analytics, late-arriving events require watermarks and allowed lateness. Daily batch metrics often use windows like “include events received within 24–72 hours” to balance completeness and freshness.
-
Idempotency is essential. Retries, mobile reconnects, and duplicate producer sends can inflate counts unless every action has a stable
event_idor action-level key. Duplicate rate is commonly monitored as For critical actions, use server-generated IDs or Stripe-style idempotency keys. -
Data quality checks should cover freshness, volume, schema validity, null rates, uniqueness, referential integrity, distribution drift, and metric consistency. Practical tools include Great Expectations, Amazon Deequ, dbt tests, Airflow sensors, and custom anomaly detection on event counts by platform, app version, country, and experiment group.
-
Volume anomaly detection should account for seasonality and launch effects. A simple check is a rolling z-score: but better production systems use day-of-week baselines, holiday calendars, and segmented alerts. Always compare affected versus unaffected surfaces before declaring data loss.
-
Instrumentation changes can create metric discontinuities. Renaming an event, changing firing conditions, moving from client to server logging, or adding a new platform can mimic product growth or decline. For important metrics, run old and new logging in parallel for at least one release cycle and estimate a bridge ratio.
-
Impressions are especially tricky. You need a clear exposure definition: rendered on screen, at least 50% visible, visible for at least 1 second, or eligible to be shown. Ranking systems often log “candidate generated,” “ranked,” “delivered,” and “viewed” separately to diagnose where funnel loss occurs.
-
Missingness is rarely random. Low-end Android devices, poor-network geographies, logged-out users, privacy-restricted regions, or older app versions may be underrepresented. Before using logs for inference, check whether missingness correlates with outcomes or treatment assignment; otherwise A/B test estimates may be biased.
-
Privacy and policy constraints are part of instrumentation design. Avoid unnecessary PII, apply retention limits, honor consent and regional restrictions, and aggregate or hash identifiers where appropriate. A metric that cannot be safely retained, joined, or audited is not production-ready.
-
A good instrumentation plan includes validation before and after launch: unit tests in the client/server code path, QA with known test users, shadow logging, event count reconciliation, A/A tests, dashboard monitoring, and rollback criteria. The launch is not complete until the data is proven usable.
Worked example
Instrument a new Reels sharing feature
In the first 30 seconds, a strong candidate would clarify what “sharing” means: sharing to another Meta surface, copying a link, sending via DM, external share sheet, or all of the above. They would also ask what decision the data will support: adoption tracking, ranking optimization, creator analytics, experiment readout, or abuse monitoring. The answer can then be organized around four pillars: event definitions, schema and logging location, data quality validation, and downstream metrics. For events, they might propose logging share_button_impression, share_button_click, share_sheet_open, share_destination_select, share_submit, and share_success, separating intent from completion. For schema, they would include IDs for viewer, reel, creator, session, destination type, surface, app version, platform, experiment assignment, and stable event/action IDs.
They should explicitly flag the client-versus-server tradeoff: button impressions and clicks must be client-side, but successful share creation should be confirmed server-side to avoid counting failed network requests as completed shares. They would describe validation by comparing funnel ratios across iOS, Android, and web; checking duplicates; monitoring null rates on reel_id and destination_type; and reconciling server-confirmed share counts against client submit attempts. They would also mention edge cases such as offline retries, private or deleted reels, reshares, bot-like behavior, and multiple recipients per share. A strong close would be: “If I had more time, I would add shadow logging before launch, run an A/A test to ensure no treatment imbalance in logging, and create dashboards with alerts for volume, freshness, and schema drift.”
A second angle
Debug a sudden drop in daily active users
The same skill applies differently when the task is diagnosis rather than design. Here, the candidate should avoid assuming the product actually declined and first separate logging failure from real behavior change. They would check whether the drop is isolated by platform, app version, geography, logged-in status, or ingestion pipeline, and compare DAU against independent signals such as server requests, push opens, session starts, or ad impressions. If the metric depends on a user_active event, they should inspect recent schema deployments, client releases, timestamp handling, and late-arrival rates. The framing is less about proposing a perfect schema and more about narrowing the blast radius and identifying whether the denominator, numerator, or pipeline changed.
Common pitfalls
Analytical mistake: treating logged events as ground truth. A tempting answer is “just count the number of share events,” but logs are generated by fallible clients and pipelines. A better answer distinguishes user behavior from measurement, discusses duplicate and missing events, and proposes reconciliation against server-side durable records where possible.
Communication mistake: jumping into implementation before defining the metric. Candidates often start with “I would log click, impression, and success events” without clarifying the decision or unit of analysis. Interviewers want to hear you ask whether the goal is experimentation, monitoring, ranking, creator reporting, or fraud detection because each requires different granularity and guarantees.
Depth mistake: ignoring launch and maintenance. Instrumentation is not complete once the event names are listed. Strong answers include validation plans, alerting thresholds, ownership, versioning, backfills, schema evolution, and how to handle metric discontinuities when the product or logging changes.
Connections
This topic often leads into experimentation, especially whether instrumentation bias can invalidate treatment-control comparisons. Interviewers may also pivot to metric design, funnel analysis, anomaly detection, causal inference, or data pipeline architecture. If the discussion becomes more technical, expect follow-ups on event-time processing, deduplication, bot filtering, or privacy-preserving measurement.
Further reading
- Designing Data-Intensive Applications — Martin Kleppmann’s book is excellent for understanding logs, streams, exactly-once semantics, replication, and distributed data tradeoffs.
- Great Expectations Documentation — practical framework for data quality checks such as schema validation, null rates, freshness, and distribution expectations.
- The Data Warehouse Toolkit — classic reference for dimensional modeling, event facts, grain definition, and durable analytic schemas.