Growth Diagnostics, Metric Trees, Estimation, and A/B Testing
Asked of: Product Manager
Last updated
What's being tested
Interviewers are evaluating your ability to turn noisy product signals into actionable hypotheses and experiments. They want to see structured growth diagnostics (root-cause decomposition), crisp metric design (what to measure and why), and pragmatic experimentation/estimation decisions (sample size, power, guardrails). For DoorDash, this maps to prioritizing changes that move order volume, conversion, or customer retention while protecting marketplace health (driver supply, delivery times, and unit economics).
Core knowledge
-
Metric tree: decompose a high-level metric (e.g.,
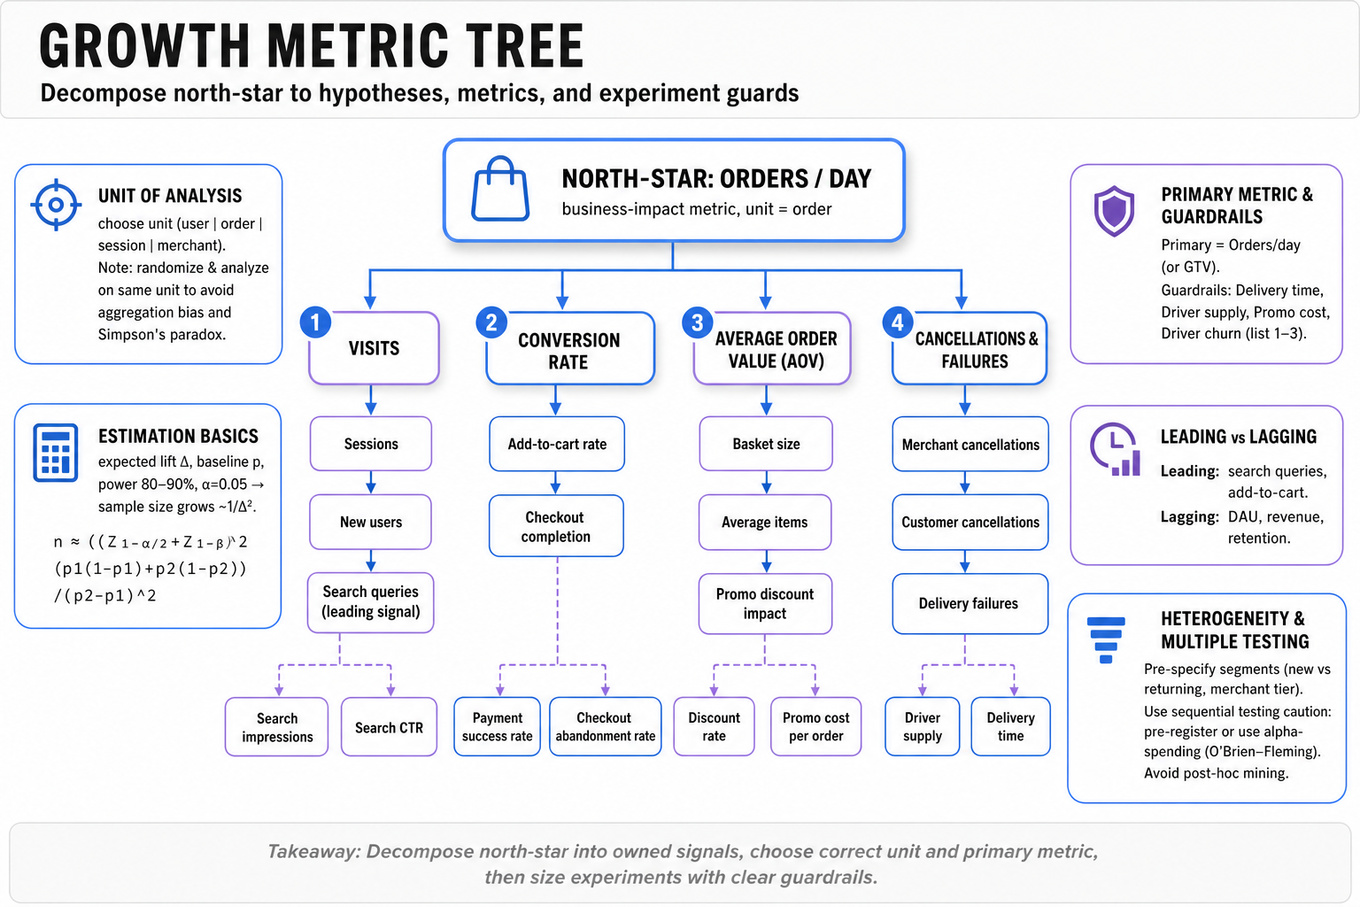
GTVororders/day) into upstream components (visits→conversion→AOV→cancellations) so each branch suggests a hypothesis and an owned signal to monitor. -
Unit of analysis: choose the correct unit (
user,order,session,merchant) and ensure experiment randomization and analysis use the same unit to avoid aggregation bias and Simpson's paradox. -
Leading vs lagging metrics: track short-term leading signals (
search queries,add-to-cart rate) for rapid diagnostics and lagging outcomes (DAU,revenue) for business impact and launch decisions. -
Primary vs guardrail metrics: pick one primary metric (business-impact) and 1–3 guardrails (
delivery time,driver churn,promo cost) that prevent local-optimizing decisions that harm the marketplace. -
Metric definition hygiene: specify numerator, denominator, time window, event dedup rules, and treatment of multi-touch (first order only vs all orders). Use stable event sources (e.g.,
`Postgres`OLAP tables or vetted event warehouse) and validate with sanity checks. -
Estimation basics: expected lift Δ, baseline rate p, desired power (1−β, commonly 80–90%), and significance α (commonly 0.05) drive sample-size: for proportions,
For small Δ you need exponentially more users.
-
Heterogeneity and segmentation: pre-specify key segments (
new vs returning,top-merchant vs long-tail) to detect heterogeneous treatment effects; avoid post-hoc mining unless adjusted for multiple comparisons. -
Multiple testing & peeking: sequential looks inflate false positives — use proper sequential testing (e.g.,
O’Brien–Fleming, alpha spending) or pre-register fixed-horizon analysis; at minimum, be conservative about early stops. -
Practical power tradeoffs: tests that target rare events (e.g.,
cancellations) or tiny lifts on core metrics (e.g., 0.5% lift in conversion) require massive samples or longer durations; consider targeting higher-variance leading indicators instead. -
Causality & externalities: for marketplace changes, consider supply-side responses:
driver incentives,merchant availability, and cross-day effects (e.g.,churn). Randomization should isolate direct effect; complement with quasi-experimental checks if rollout is staged. -
Sanity and instrumentation checks: always run pre-checks (
randomization balance,sample ratio test,metric incompleteness) before trusting experimental results to avoid faulty conclusions from telemetry bugs. -
Decision framework: weigh statistical significance, practical significance (impact on unit economics), risk to guardrails, implementation cost, and reversibility/operational complexity when recommending rollout.
Worked example — diagnosing a 7% drop in DAU in a single city
Framing (30s): ask which DAU definition is used (unique users with an order, active app opens), the measurement window, rollout history (code deploys, marketing stops), and whether the drop is absolute or relative to seasonal norms. Skeleton of approach: (1) build a metric tree to split DAU into acquisition vs retention vs recall; (2) run quick segmentation (new vs returning users, by OS, by neighborhood) to pinpoint cohorts; (3) check upstream telemetry (app crashes, payment failures, store closures) and downstream operational signals (delivery ETA, driver acceptance). Tradeoff flagged: prioritize fast, low-cost diagnostics (instrumentation checks, error logs, A/B sanity checks) before big experiments that assume causal change. Close: recommend short-term mitigations (e.g., rollback suspected release or apply targeted communication to affected segment), run a focused experiment if a UI change is suspected, and propose monitoring windows (immediate 24–72h for fix; 2–4 weeks for behavioral recovery).
A second angle — designing an A/B test for a new first-order discount for new users
This uses the same concepts but flips constraints: you must specify the primary uplift metric (incremental first-order conversion or incremental lifetime value), choose correct denominator (all new users exposed vs only those who reach checkout), and calculate sample size for expected incremental conversion (e.g., 3% absolute). Guardrails include AOV erosion and promo cost per incremental order. Because the treatment is financial, plan a post-hoc check for cannibalization (are returning-user orders reduced?) and monitor driver utilization and merchant acceptance. If the sample size to detect desired lift is too large, consider surrogate leading metrics (click-to-checkout) as a high-frequency signal, but pre-specify how that links to long-term revenue.
Common pitfalls
Pitfall: Confusing short-term signal noise for product impact. Small daily fluctuations or seasonalities (weekends, weather) can look like real effects; always compare against historical variance and run for a sensible duration (full weekly cycles).
Pitfall: Using the wrong unit of analysis. Randomizing by user but measuring orders as independent observations inflates significance; aggregate to the randomized unit or use clustered standard errors.
Pitfall: Hiding uncertainty in recommendations. Saying "launch — p<0.05" without discussing effect size, sample stability, and guardrail risk misses interviewer expectations; present both statistical and practical significance.
Connections
Interviewers may pivot to funnel optimization, pricing experiments, or metric telemetry (instrumentation and data quality). They may also ask about staging rollouts, rollback criteria, or multi-armed bandit tradeoffs for rapid learning.
Further reading
-
Trustworthy Online Controlled Experiments: A Practical Guide to A/B Testing (Kohavi et al.) — rigorous guide combining statistical and product lessons.
-
Evan Miller — A/B Testing: The Most Dangerous Game — practical pitfalls and sequential testing intuition.
Related concepts
- Diagnostics, A/B Testing, Estimation, and Growth Infrastructure Fundamentals
- Experimentation, Diagnostics, and Growth Infrastructure for Non-Technical PMs
- Growth Loops, Monetization, and Estimation
- A/B Testing And Product Metric DiagnosticsAnalytics & Experimentation
- A/B Testing and Growth Infrastructure for Non-Technical PMs
- Product Metric Design And Diagnostic Deep DivesAnalytics & Experimentation