Low-Latency Performance And Cache Locality
Asked of: Software Engineer
Last updated
What's being tested
The interviewer is testing whether you can reason from source code and hardware behavior to end-to-end latency, rather than treating algorithmic complexity as sufficient. You should connect cache locality, memory layout, branch behavior, allocation, synchronization, and measurement to tail latency in a latency-sensitive service. At Hudson River Trading, small and variable delays can affect the timeliness of market-data handling and order decisions, so a strong Software Engineer explains both the optimization and its correctness and maintainability costs.
Core knowledge
-
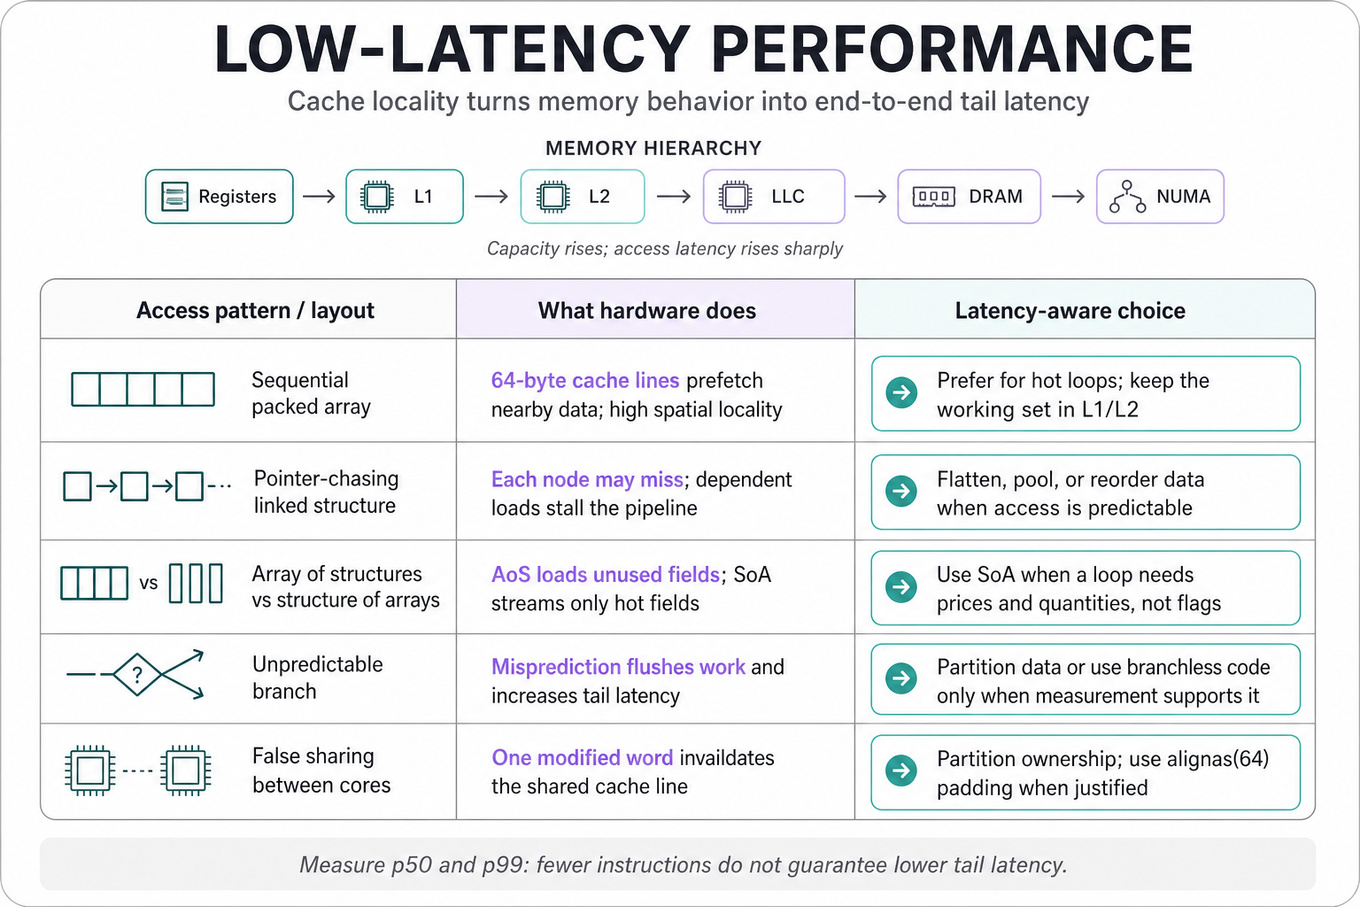
The memory hierarchy has different latency and capacity: registers and L1 are fastest, followed by L2, shared LLC, DRAM, and possibly another NUMA socket. A cache miss can cost tens to hundreds of nanoseconds, vastly more than an arithmetic instruction.
-
Spatial locality means nearby addresses are fetched together in a cache line, commonly 64 bytes; temporal locality means recently accessed data is likely to be reused. Sequential iteration over a packed array usually beats pointer-chasing through a linked structure.
-
Data-oriented layout often improves locality. An array of structures (
struct { price, quantity, flags }) is convenient, but a structure of arrays can avoid loading unused fields when a hot loop needs only prices and quantities. -
Working-set size matters more than nominal input size. Keep hot state within L1/L2 when practical; if a frequently accessed table exceeds cache capacity, reduce the footprint, improve access order, or replace random lookup with a denser representation.
-
Cache associativity can create conflict misses even when total data fits in cache. Power-of-two strides, poorly aligned buffers, or several hot arrays mapping to the same sets can cause pathological behavior; padding or changing layout can help.
-
False sharing occurs when independent threads modify different words on the same cache line. The line repeatedly invalidates and moves between cores; use ownership partitioning or cache-line padding such as
alignas(64)where justified. -
Branch prediction affects both average and tail latency. A predictable branch may be cheap, while an unpredictable branch can stall the pipeline; use data partitioning, branchless operations only when measured beneficial, and avoid assuming branchless code is automatically faster.
-
Allocation and indirection add latency and variability. Prefer preallocated storage, object pools, arenas, value types, and contiguous containers on hot paths; account for allocator locks, page faults, destructor work, and garbage-collection pauses where applicable.
-
NUMA locality matters on multi-socket machines. A thread accessing memory allocated on another socket can pay additional latency; pin threads, place memory near its owner, and avoid casually sharing mutable state across NUMA nodes.
-
Measurement must separate warm and cold behavior. Use representative distributions, warm caches and code paths when measuring steady state, and separately test startup or first-touch behavior. Report median,
p99,p99.9, maximum, throughput, and variance rather than only the mean. -
Hardware counters help validate hypotheses. Tools such as
`perf`can expose cache references, cache misses, branch misses, cycles, instructions, context switches, and migrations; compare counters before and after a change instead of inferring causality from wall-clock time alone. -
Algorithmic complexity still matters. A cache-friendly scan can beat an tree for realistic , but an operation on an unbounded hot path may eventually dominate. State the expected working set, access pattern, and latency budget before choosing.
Worked example
Representative prompt: “How would you optimize a latency-critical order-book data structure?” First, I would clarify the operations, update/read ratio, price-range assumptions, concurrency model, target latency percentile, and whether allocations are allowed on the hot path. I would organize the answer around data representation, access complexity, cache behavior, synchronization, and measurement. For dense bounded price levels, I might use a contiguous price-indexed array for direct lookup; for sparse or unbounded prices, I would compare a sorted array, flat hash table, or tree while considering update costs and locality. I would explicitly flag the tradeoff that a tree offers flexible sparse updates but incurs pointer chasing and poor cache locality, whereas a flat structure may require resizing or more expensive shifts. I would keep ownership with one thread where possible, batch or publish immutable snapshots for readers, and avoid false sharing between per-thread state. I would benchmark replayed production-like update sequences, collect p50 through p99.9, and inspect `perf` counters to confirm whether misses or branches changed. If I had more time, I would test NUMA placement, burst behavior, cancellation-heavy workloads, and correctness under crossed prices and empty levels.
A second angle
Representative prompt: “Why did a seemingly minor code change increase p99 latency?” The framing shifts from selecting a data structure to diagnosing a regression: first compare workload, compiler settings, CPU placement, and measurement methodology. Then inspect changes that enlarge the working set, introduce an allocation, alter alignment, create false sharing, or make a branch less predictable. Averages may remain unchanged while a small fraction of requests suffer cache misses, page faults, preemption, or lock contention, so tail metrics and hardware counters are essential. The best answer proposes a controlled benchmark, a minimal reproducer, and a rollback or targeted change rather than asserting that “cache is slower” without evidence.
Common pitfalls
Pitfall: Analytical mistake — claiming that a contiguous array is always faster or that lookup guarantees low latency ignores cache capacity, collisions, resizing, branch behavior, and actual access distributions. Explain the workload and validate the claim with measurements.
Pitfall: Communication mistake — listing L1, L2, NUMA, and
`perf`terminology without first stating the latency budget, hot operation, and bottleneck makes the answer sound memorized. Start with assumptions and a profiling plan, then connect each optimization to an observed cost.
Pitfall: Depth mistake — recommending padding or lock-free code as a universal fix can increase memory use, complexity, and correctness risk. Discuss ownership, memory ordering, alignment, and whether counters show false sharing or contention before introducing specialized techniques.
Connections
The interviewer may pivot to profiling, benchmark design, lock contention, memory ordering, NUMA, or wait-free and single-producer/single-consumer queues. Be ready to connect locality improvements to algorithmic complexity, concurrency semantics, and tail-latency measurement.
Further reading
-
What Every Programmer Should Know About Memory — Ulrich Drepper; detailed treatment of caches, memory hierarchy, NUMA, and locality.
-
Computer Architecture: A Quantitative Approach — Hennessy and Patterson; rigorous background on memory systems and performance measurement.
-
`perf`Linux manual — practical reference for collecting hardware performance counters and validating optimization hypotheses.
Related concepts
- Low-Level System Design For High-Throughput C++ Services
- Low-Latency/Batch Inference and GPU Resource Management
- LRU CacheCoding & Algorithms
- LRU Cache And O(1) Data StructuresCoding & Algorithms
- LRU Cache Design And PersistenceCoding & Algorithms
- Performance Profiling And Capacity Planning For C++ Services