Low-Level Performance Engineering
Asked of: Software Engineer
Last updated
What's being tested
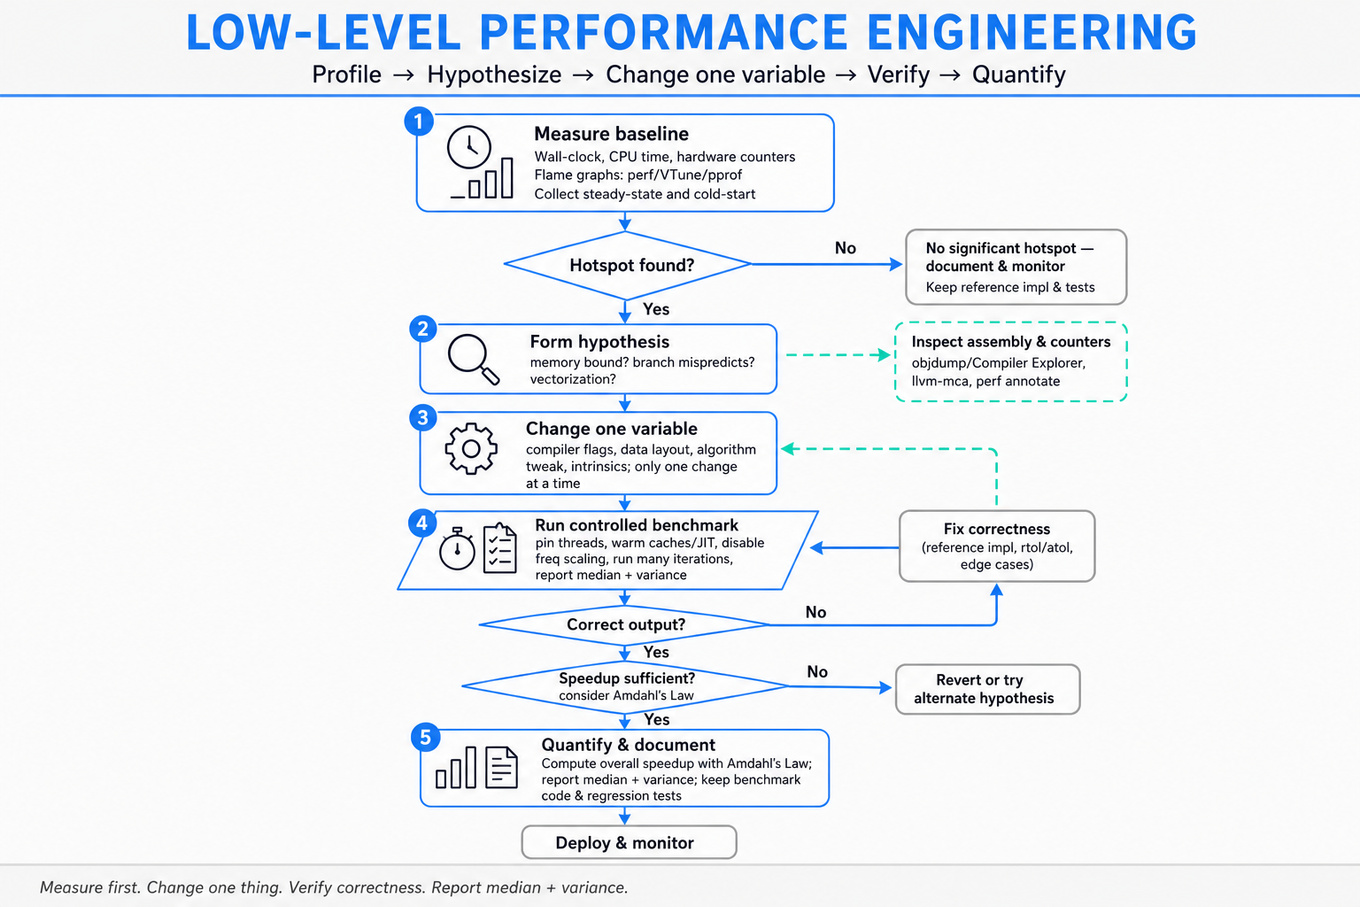
You’re being tested on low-level performance engineering: the ability to reason from source code down to compiler output, processor pipelines, memory hierarchy, and measurement methodology. The interviewer is probing whether you can improve a hot path without guessing: profile first, form hypotheses, change one variable, verify correctness, and quantify speedup. For Anthropic, this matters because software engineers often work near performance-critical infrastructure where small inefficiencies in kernels, serialization, scheduling, or memory movement can become expensive at scale. Strong answers show practical judgment: you know when to trust the compiler, when to guide it, when to rewrite code, and when an optimization is too clever to maintain.
Core knowledge
-
Profiling before optimization is non-negotiable. Start with wall-clock time, CPU time, hardware counters, and flame graphs using tools like
perf,VTune,Linux perf_events,pprof, or simulator traces. Optimize only a measured bottleneck, not code that “looks slow.” -
Speedup math should be explicit. Use Amdahl’s Law: if fraction is improved by factor , total speedup is A 10x improvement to 20% of runtime only gives overall.
-
Benchmark design must control noise. Pin threads with
taskset, warm caches/JITs if relevant, disable frequency scaling where possible, run enough iterations, report median plus variance, and separate cold-start from steady-state behavior. For tiny kernels, use batches to avoid timer overhead dominating the result. -
Correctness verification needs equal rigor to speed measurement. Keep a scalar reference implementation, compare outputs bit-for-bit for integer code, use tolerances for floating point such as
rtol/atol, and test edge cases: zero length, unaligned addresses, NaNs, overflow, negative values, and non-multiple vector widths. -
Compiler optimization control includes flags, pragmas, attributes, and source transformations. Know
-O2,-O3,-march=native,-ffast-math,restrict,inline,noinline,#pragma unroll,#pragma clang loop vectorize(enable), and intrinsics such asAVX2/AVX-512. Each can improve codegen or silently change semantics. -
Assembly inspection is often the fastest way to validate assumptions. Use
objdump,Compiler Explorer,llvm-mca, orperf annotateto check whether a loop vectorized, whether loads are hoisted, whether branches remain, and whether the compiler emitted expensive divisions, spills, or scalar fallback paths. -
Memory hierarchy usually dominates simple kernels. Reason about cache lines, spatial locality, temporal locality, prefetching, TLB misses, and bandwidth. A useful model is arithmetic intensity: operations per byte loaded. Low-intensity kernels are memory-bound; more ALU tricks will not help much.
-
Branchless programming can reduce misprediction penalties but is not free. Replacing
ifwith masks,cmov, bitwise operations, or table lookups helps when branches are unpredictable. If branches are highly predictable, branchless code may add instructions, increase register pressure, and perform worse. -
Bitwise tricks are useful when they clarify a machine-level operation: powers of two via
x & (x - 1), alignment via(x + a - 1) & ~(a - 1), modulo by power of two viax & (n - 1), and sign masks via shifts. Watch for signed overflow and implementation-defined shifts. -
Instruction-level parallelism depends on dependency chains, latency, and throughput. A loop with a serial accumulator may bottleneck on add latency; multiple accumulators can expose parallelism. The goal is to keep execution ports busy without exceeding register capacity or causing spills.
-
Pipeline hazards matter in scheduled architectures. Understand RAW read-after-write true dependencies, WAR write-after-read anti-dependencies, and WAW write-after-write output dependencies. VLIW machines expose scheduling to the compiler/programmer, so independent operations must be packed carefully into issue slots.
-
Data layout transformations often beat instruction tricks. Switching from array-of-structs to struct-of-arrays, blocking/tiling for cache, aligning buffers, and eliminating pointer aliasing can unlock vectorization. But layout changes affect APIs, memory footprint, and maintainability, so justify them with measured impact.
Worked example
For Design a profiling plan for kernels, a strong candidate starts by clarifying the kernel’s purpose, input sizes, target hardware, correctness requirements, and whether the goal is latency, throughput, cost, or energy. They should declare assumptions such as: “I’ll treat this as a deterministic CPU kernel in C++, with a scalar reference and representative production-sized inputs.” The answer can then be organized around four pillars: establish a reliable benchmark, gather coarse-to-fine profiles, form microarchitectural hypotheses, and validate each optimization against correctness and performance regressions.
The benchmark pillar should include warmup, repeated trials, pinned CPU affinity, fixed compiler flags, representative data distributions, and reporting of median, p95, and variance rather than a single best run. The profiling pillar should start with wall-clock attribution, then move to counters like cycles, instructions, IPC, branch misses, cache misses, and memory bandwidth. The hypothesis pillar connects observations to causes: high branch-miss rate suggests branchless rewrite; low IPC with many cache misses suggests layout or blocking; high instruction count suggests strength reduction or vectorization. The validation pillar keeps a golden implementation and randomized/property tests so optimizations do not change semantics.
A specific tradeoff to flag is using -ffast-math: it may enable vectorization and reassociation, but it can break IEEE behavior for NaNs, signed zero, infinities, and reproducibility. A good close is: “If I had more time, I’d inspect generated assembly, run the benchmark on a second CPU generation, and add a CI performance guardrail with a tolerance band to catch regressions.”
A second angle
For Schedule instructions on a VLIW pipeline, the same performance mindset applies, but the task shifts from measuring an opaque out-of-order CPU to explicitly arranging operations for a statically scheduled machine. Instead of asking “why is the CPU stalling?” you ask “which issue slots are unused, and which dependencies prevent filling them?” The candidate should identify RAW/WAR/WAW hazards, operation latencies, functional-unit constraints, and register pressure before proposing a schedule. The same tradeoff appears in a different form: unrolling or software pipelining can improve throughput, but it increases live values and may cause register spills. A strong answer explains both the optimized schedule and how they would validate it using a simulator trace or cycle count.
Common pitfalls
Pitfall: Treating optimization as a bag of tricks instead of an experimental process.
A tempting weak answer is “use SIMD, unroll loops, make it branchless.” That misses the core skill. A better answer says what metric would indicate each intervention, what downside it carries, and how you would prove the change helped.
Pitfall: Ignoring compiler and language semantics.
Low-level changes often cross semantic boundaries: signed integer overflow in C++ is undefined behavior, -ffast-math can alter floating-point results, and pointer aliasing can prevent vectorization unless restrict or layout changes are valid. Interviewers like to test whether you can optimize without making the program subtly wrong.
Pitfall: Over-indexing on microarchitecture while under-communicating the plan.
It is good to mention cache lines, ports, or pipeline hazards, but not as disconnected trivia. Structure the answer around a clear workflow: baseline, profile, diagnose, change, verify, measure again. That makes depth legible to the interviewer.
Connections
The interviewer may pivot from here into systems performance debugging, concurrency and lock contention, memory allocator behavior, or distributed-system tail latency. They may also connect kernel optimization to compiler design, CPU architecture, or GPU-style throughput programming, but for a software engineer the expected focus remains measurement, correctness, and practical tradeoffs.
Further reading
-
Computer Architecture: A Quantitative Approach, Hennessy and Patterson — canonical treatment of pipelines, memory hierarchy, ILP, and performance models.
-
What Every Programmer Should Know About Memory, Ulrich Drepper — detailed explanation of caches, TLBs, prefetching, and memory-access costs.
-
Agner Fog Optimization Manuals — practical references for instruction latency/throughput, calling conventions, vectorization, and assembly-level performance.
Featured in interview prep guides
Practice questions
- Optimize a compute kernel with a simulatorAnthropic · Software Engineer · Onsite · hard
- Schedule instructions on a VLIW pipelineAnthropic · Software Engineer · Onsite · hard
- Apply bitwise tricks for performanceAnthropic · Software Engineer · Onsite · medium
- Design high-throughput hashing for kernelsAnthropic · Software Engineer · Onsite · medium
- Guide and override compiler optimizationsAnthropic · Software Engineer · Onsite · hard
- Design a profiling plan for kernelsAnthropic · Software Engineer · Onsite · hard
Related concepts
- Performance Profiling And Capacity Planning For C++ Services
- Low-Level System Design For High-Throughput C++ Services
- Low-Latency Performance And Cache Locality
- Real-Time Edge Inference OptimizationML System Design
- Distributed GPU Computation And Parallel MLML System Design
- C++ Systems, Memory, Concurrency, And VirtualizationSoftware Engineering Fundamentals