Product Metric Frameworks And Diagnostic Analytics
Asked of: Data Scientist
Last updated
What's being tested
LinkedIn Data Scientist product cases test whether you can build a metric framework, diagnose metric movement, and design credible analyses without jumping to anecdotes or one-off SQL cuts. The interviewer is probing for structured reasoning: define the product goal, choose primary and guardrail metrics, segment the population, distinguish instrumentation issues from real behavior, and propose experiments or causal analyses. LinkedIn cares because products like the homepage feed, profile, video upload, and B2B offerings are multi-sided systems where short-term engagement, long-term member value, creator incentives, and customer value can diverge. A strong answer shows you can move from “metric went down” to a prioritized diagnostic plan and from “feature looks promising” to an evaluation design that leadership could trust.
Core knowledge
-
North Star metrics should reflect durable user or customer value, not just activity. For LinkedIn, examples include meaningful professional engagement, successful job or hiring outcomes, profile completeness that improves match quality, and
B2Baccount adoption. Pair them with input metrics that teams can actually move. -
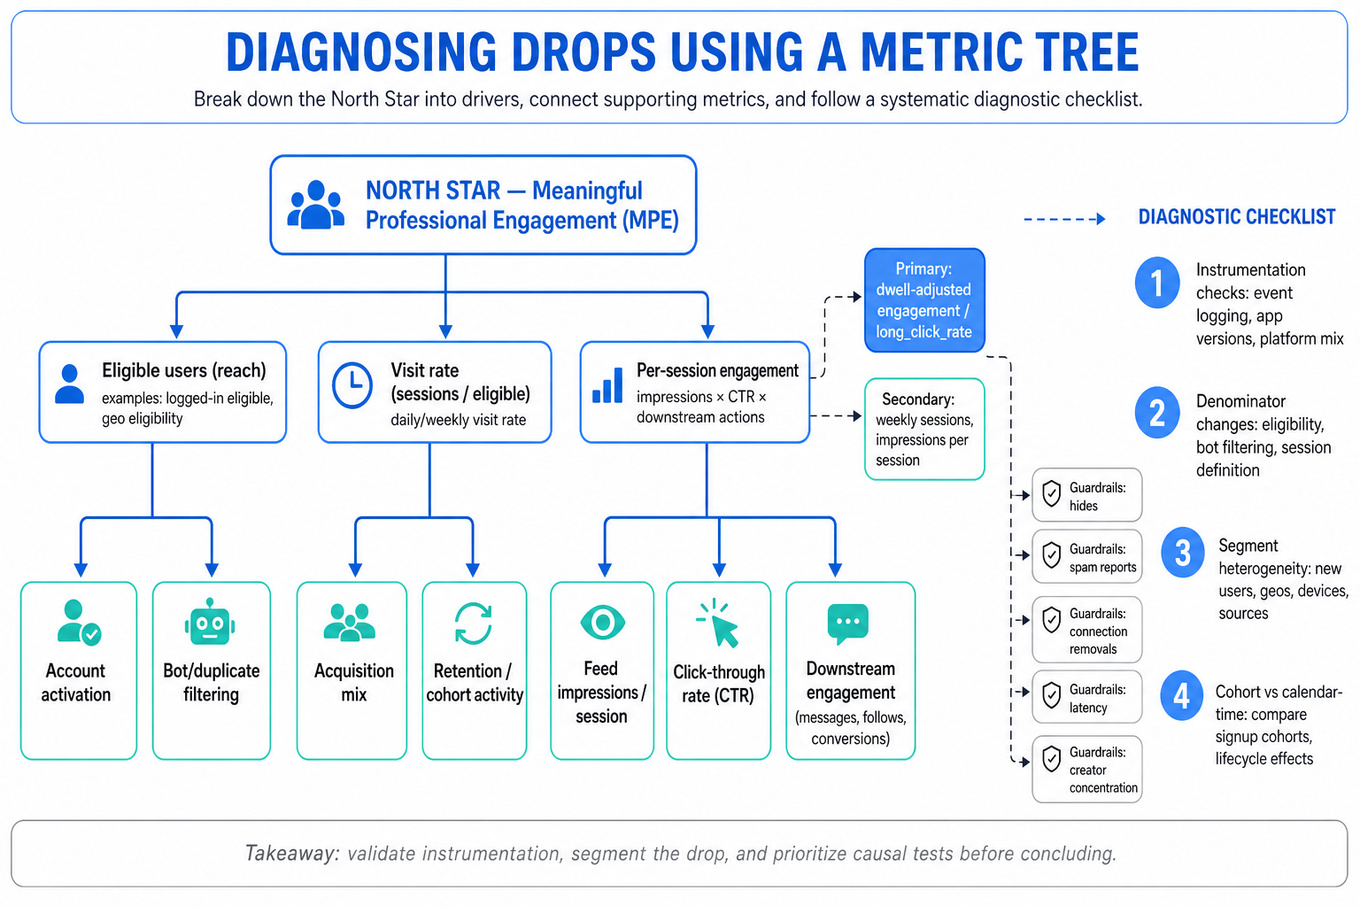
Metric trees decompose an outcome into drivers. For example,
homepage_sessionscan be broken into eligible users × visit rate × feed impressions per session × click-through rate × downstream engagement. This helps separate demand changes, ranking quality, UI changes, and content supply effects. -
Primary metrics, secondary metrics, and guardrails serve different purposes. A feed ranking experiment might optimize
long_click_rateor dwell-adjusted engagement while guarding against hides, spam reports, connection removals, latency, and creator concentration. Avoid optimizing a single engagement metric that can be gamed by low-quality viral content. -
Diagnostic analytics usually starts with three checks: instrumentation validity, denominator changes, and segment heterogeneity. Before explaining a
10%drop in homepage engagement, verify event logging, app versions, platform mix, bot filtering, logged-in eligibility, and whether the drop is concentrated in new users, geos, devices, or traffic sources. -
Cohort analysis separates lifecycle effects from calendar-time effects. A drop in profile completion may come from more low-intent new signups rather than worse onboarding. Compare signup cohorts by day or week and track completion by age, e.g., day-1, day-7, and day-28 completion rates.
-
Funnel metrics should be defined with precise eligibility and time windows. For profile completion: viewed prompt → clicked edit → added field → saved field → reached threshold. Use consistent denominators, such as eligible members exposed to the prompt, not all members, unless the business question is population-level impact.
-
Statistical inference depends on the estimand. For “initial video uploads are shorter than later ones,” a paired design compares each creator’s first upload with their own later uploads, reducing between-user variance. A simple estimand is , tested with a paired t-test, Wilcoxon signed-rank test, or regression with creator fixed effects.
-
Experiment design requires a clear unit of randomization. For member-facing feed or profile changes, randomize at member level when interference is limited. For
B2Bproducts, account-level randomization may be necessary because seats within an account influence each other; otherwise treatment contamination can bias adoption and collaboration metrics. -
Causal diagnosis distinguishes correlation from cause. If homepage engagement dropped after a ranking model launch, compare treated versus unaffected surfaces, pre/post trends, experiment holdouts if available, and segments with different exposure intensity. A difference-in-differences framing is useful when randomized evidence is unavailable:
-
Distributional analysis matters for marketplace and enterprise products. In a
B2Blaunch, average seats active per account can hide a few large accounts dominating usage. Inspect account-level adoption, seat-level activation, power-user concentration, retention curves, and percentiles such asp50,p90, andp99. -
Ranking and recommender metrics need both online and offline views. Offline metrics like
NDCG,AUC, calibration, and counterfactual replay can catch model regressions, but online metrics measure actual member response. A feed ranking diagnosis should include content inventory, candidate generation coverage, score distribution shifts, and downstream engagement quality. -
Multiple comparisons and peeking can create false discoveries during segmentation. If you inspect 100 segments, some will move by chance. Use pre-specified cuts, false discovery rate control such as Benjamini-Hochberg, or treat exploratory segments as hypotheses requiring validation in a follow-up test.
Worked example
For “Analyze homepage drop and feed ranking,” a strong candidate would first clarify the metric: “Are we seeing a drop in visits, feed impressions, clicks, dwell time, or a composite engagement score, and over what time window versus baseline?” They would also ask whether there were recent launches, logging changes, seasonality events, traffic acquisition shifts, or ranking model changes, while declaring that they will separate data quality from product behavior before diagnosing causality.
The answer should be organized into four pillars: first, validate the metric definition and event logging using raw event counts, platform versions, and comparison to stable metrics such as login_rate; second, decompose the homepage metric tree into user reach, session frequency, feed inventory, impression volume, engagement rate, and downstream quality; third, segment by app platform, geography, new versus existing members, connection graph density, content type, and exposure to the new ranking model; fourth, propose causal tests using experiment logs, launch ramp cohorts, or matched pre/post comparisons.
One tradeoff to flag explicitly is speed versus rigor: in the first few hours, you want high-signal cuts that identify whether the issue is global, platform-specific, or model-exposure-specific; for decision-making, you would prefer randomized holdout or ramp analysis over narrative correlation. A good candidate would avoid saying “the ranking model caused it” just because timing lines up. They would close by saying that if they had more time, they would examine long-term quality metrics such as hides, reports, return visits, and creator-side distribution to ensure any recovery plan does not simply inflate short-term clicks.
A second angle
For “Measure Success of New B2B Product,” the same framework applies, but the unit of analysis changes from individual member sessions to accounts, seats, admins, and buyer value. The metric framework should include acquisition or pilot conversion, account activation, seat adoption, repeated usage, feature depth, retention, and business outcomes such as renewal intent or expansion. Diagnostics must separate account mix from product performance because one large enterprise can dominate aggregate usage. Experimentation is also harder: randomizing individual seats may create spillovers, so account-level tests, phased rollouts, or quasi-experimental comparisons are often more appropriate. The same discipline still holds: define the success metric, decompose it, segment it, validate measurement, and choose the strongest feasible causal design.
Common pitfalls
Pitfall: Treating a metric drop as a single-cause debugging problem.
A tempting answer is “check if the ranking model changed, then roll it back.” That is too narrow for a Data Scientist. A better answer decomposes the metric, validates instrumentation, checks denominator shifts, segments exposure, and then evaluates whether the model change plausibly caused the movement.
Pitfall: Defining metrics that sound good but cannot guide action.
For profile completion, “increase user value” is directionally right but not operational. Stronger metrics include eligible prompt exposure rate, prompt click-through rate, save completion rate, percentage of members reaching all-star or threshold completeness, and downstream outcomes like recruiter profile views or connection acceptance.
Pitfall: Over-indexing on averages.
In B2B and creator/video analyses, averages can be misleading because distributions are skewed. Report medians, percentiles, account-weighted versus seat-weighted views, and cohort-level retention; then explain which weighting matches the decision, such as customer revenue impact versus typical user experience.
Connections
Interviewers may pivot from this topic into A/B testing, causal inference, ranking evaluation, funnel analysis, or statistical hypothesis testing. Be ready to discuss sample size, interference, novelty effects, guardrail metrics, and how you would communicate uncertainty to product and engineering partners.
Further reading
-
Trustworthy Online Controlled Experiments, Kohavi, Tang, and Xu — practical reference for experiment design, guardrails, novelty effects, and organizational decision-making.
-
Causal Inference: The Mixtape, Scott Cunningham — accessible treatment of difference-in-differences, fixed effects, matching, and causal assumptions.
-
Recommender Systems Handbook, Ricci, Rokach, and Shapira — deeper background on recommender evaluation, ranking metrics, and tradeoffs between relevance, diversity, and user value.
Featured in interview prep guides
Practice questions
- Do US members upload more videos than non-US?LinkedIn · Data Scientist · Technical Screen · easy
- Analyze homepage drop and feed rankingLinkedIn · Data Scientist · Technical Screen · hard
- Improve Profile Completion RateLinkedIn · Data Scientist · Onsite · medium
- Measure Success of New B2B ProductLinkedIn · Data Scientist · Onsite · medium
- Predict Impact of 'Online Indicator' FeatureLinkedIn · Data Scientist · Onsite · medium
- Assess LinkedIn Newsfeed HealthLinkedIn · Data Scientist · Onsite · hard
- Test If Initial Video Uploads Are Shorter Than Later OnesLinkedIn · Data Scientist · Technical Screen · medium
- One of the most comprehensive LinkedIn DS Product Cases!LinkedIn · Data Scientist · Onsite · hard
Related concepts
- Product Metric Design And Diagnostic Deep DivesAnalytics & Experimentation
- Product Metrics, Trade-Offs, And CommunicationAnalytics & Experimentation
- Product Metrics, Guardrails, And RetentionAnalytics & Experimentation
- Product Metrics, Guardrails, And Launch Decisions
- Product Metrics, Funnels, And KPI DiagnosisAnalytics & Experimentation
- Product Metrics, Root-Cause Analysis And VisualizationAnalytics & Experimentation