Root Cause Analysis And Segmentation
Asked of: Data Scientist
Last updated
What's being tested
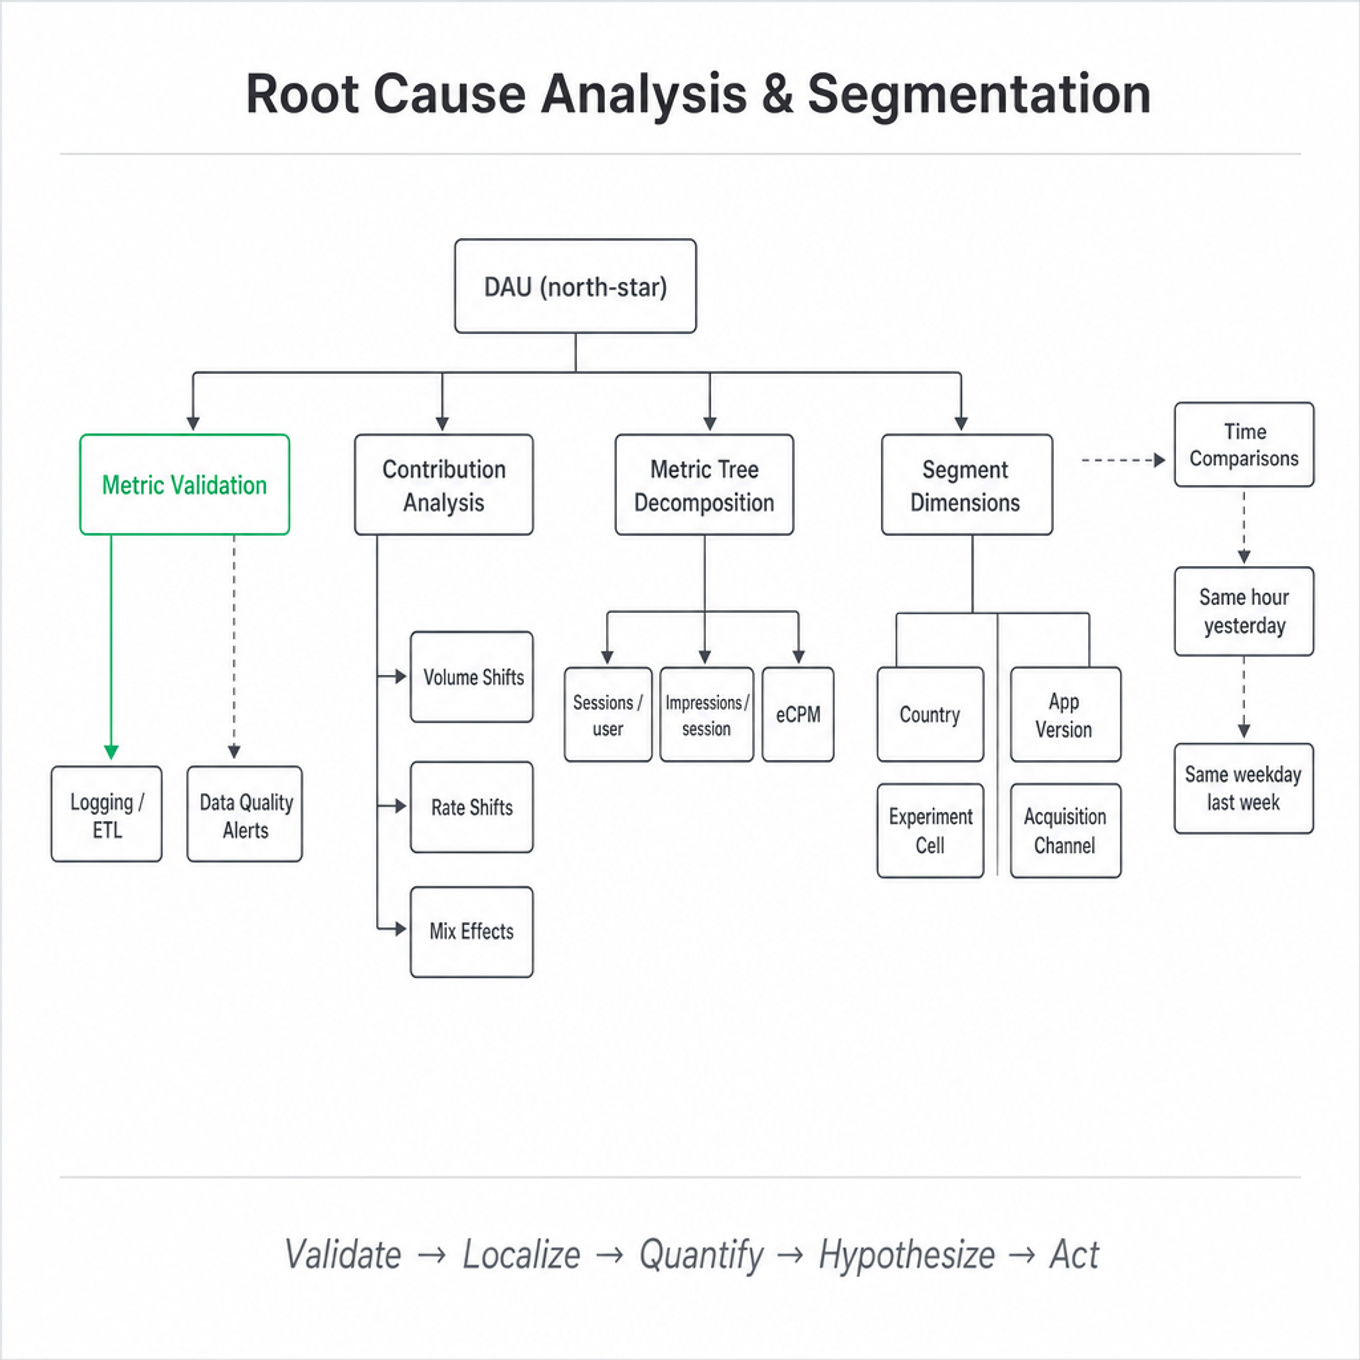
Interviewers are testing whether you can diagnose metric movement systematically rather than jumping to a favorite explanation. For a Meta Data Scientist, this means decomposing changes in product metrics like DAU, session length, feed engagement, ad revenue, message sends, or retention across dimensions such as platform, country, app version, acquisition channel, notification surface, and user cohort. The interviewer is probing whether you can separate real product/user behavior from logging issues, seasonality, experiment effects, denominator shifts, and mix changes. Strong answers show structured prioritization: validate the metric, localize the change, quantify contribution, form hypotheses, and recommend next actions.
Core knowledge
-
Start with metric validation before causal interpretation. Check whether the metric definition, logging pipeline, ETL job, backfill, bot filtering, deduplication, timezone cutoff, or identity resolution changed. A “drop in DAU” can be caused by event ingestion failure, not fewer users.
-
Decompose aggregate change using contribution analysis. For segments , total metric , where is segment size and is rate. Change can come from volume shifts, rate shifts, or mix effects:
-
Always distinguish absolute contribution from relative change. A small country with a 50% drop may matter less than the US with a 2% drop. Rank segments by contribution to total delta, not just percent change: .
-
Use a metric tree to avoid random slicing. For example, revenue can be decomposed as:
This narrows whether the issue is traffic, engagement, inventory, auction, or advertiser demand. -
Segment along dimensions tied to product and infrastructure: app version, OS, device class, country, language, network quality, logged-in state, new versus existing users, acquisition source, notification eligibility, experiment cell, and backend region. At Meta scale, many “product” drops are really version-specific, geography-specific, or experiment-triggered.
-
Account for time effects. Compare against same hour yesterday, same weekday last week, and seasonal baselines. A Monday-versus-Sunday comparison can falsely imply a drop. For high-frequency metrics, inspect hourly curves and cumulative day-to-date ratios to identify the exact onset.
-
Beware multiple comparisons when slicing many dimensions. If you inspect thousands of segment cuts, some will look anomalous by chance. Use holdout validation, pre-specified metric trees, false discovery rate controls such as Benjamini-Hochberg, or require both statistical significance and material impact.
-
Use statistical uncertainty, but do not hide behind it. For a proportion metric, approximate standard error is . For large Meta-scale samples, tiny changes will be statistically significant, so emphasize practical significance, confidence intervals, and business/user impact.
-
Separate correlation from root cause. If engagement dropped among Android users on version 450, version 450 is a suspect, not proof. Cross-check release timing, crash logs, latency, experiment exposure, feature flags, support tickets, and whether unaffected comparable cohorts exist.
-
Consider denominator changes. A rise in click-through rate may happen because low-intent impressions disappeared; a retention rate may change because acquisition mix shifted. Always inspect numerator, denominator, and eligible population separately.
-
Simpson’s paradox is common in segmentation. Overall conversion can decrease even if every major segment improves, due to mix shifting toward lower-converting segments. Normalize by segment weights or report within-segment changes plus mix contribution.
-
Root cause work should end in an action hierarchy. Classify findings into: instrumentation issue requiring data eng fix, product regression requiring rollback, experiment side effect requiring ramp-down, external shock requiring monitoring, or genuine behavior change requiring deeper research.
Worked example
“DAU dropped by 10% yesterday. How would you investigate?”
In the first 30 seconds, a strong candidate clarifies the exact DAU definition: logged-in unique users, app-specific or family-wide, timezone, whether it is final or partial-day, and whether the drop is relative to yesterday, last week, or forecast. They would state an assumption such as: “I’ll treat this as a finalized daily metric for one Meta app and focus first on distinguishing data quality from real user impact.” The answer should then be organized around four pillars: validate the metric pipeline, localize the drop in time and segment, decompose the metric into drivers, and connect the observed pattern to plausible causes.
For validation, they would check event volume, ingestion delays, deduplication, identity stitching, recent logging changes, and whether other top-line metrics such as sessions, feed loads, messages sent, or notification opens moved similarly. For localization, they would examine hourly DAU curves to find the onset, then rank cuts by contribution across country, platform, app version, OS, device, user age cohort, and experiment exposure. For decomposition, they might split DAU into retained users, resurrected users, and new users, since a drop in new-user activation suggests acquisition/onboarding while a drop in retained users suggests product availability, notifications, crashes, or login issues. A specific tradeoff to flag is breadth versus depth: broad slicing finds the affected population quickly, but uncontrolled slicing can produce false leads, so they should prioritize high-volume, operationally meaningful dimensions and validate patterns on independent metrics.
They would close with concrete next steps: if one Android app version in Brazil accounts for most of the decline, check release notes, crash rate, latency, login failures, feature flags, and experiment ramps, then recommend rollback or mitigation if corroborated. If they had more time, they would build a counterfactual forecast using several weeks of same-day baselines and run cohort-level retention analysis to quantify lasting impact.
A second angle
“Instagram Reels watch time is flat, but likes and shares dropped sharply. What is happening?”
The same diagnostic structure applies, but the framing shifts from top-line traffic loss to metric divergence inside a product funnel. The candidate should decompose Reels engagement into impressions, plays, watch time per play, completion rate, likes per view, shares per view, and creator/content mix. A flat watch-time metric suggests distribution and consumption may be stable, while explicit feedback actions changed because of UI placement, button logging, content type, audience mix, or reduced intent to interact. The investigation should segment by surface, app version, country, content category, creator type, and viewer cohort, then verify whether downstream metrics such as comments, follows, saves, and hides also moved. Unlike the DAU example, the key risk is assuming “users like the product less” when the issue could be a reaction affordance, ranking mix shift, or event instrumentation bug.
Common pitfalls
Analytical mistake: ranking by percent change instead of contribution.
A tempting answer is, “Country X is down 80%, so that must be the cause.” If Country X is 0.1% of users, it cannot explain a 10% global decline. A better answer ranks segments by absolute delta and contribution to the global movement, then uses relative change to understand severity within affected segments.
Communication mistake: giving a laundry list of cuts.
Saying “I’d check country, age, gender, device, platform, version, cohort, source, time, experiments…” sounds unprioritized. Interviewers want a decision process: first validate data, then locate onset, then segment by likely system boundaries, then quantify which segments explain the change. Structure matters more than naming every possible dimension.
Depth mistake: stopping at the first correlated segment.
Finding that Android users dropped after a release is not a complete root cause. A stronger answer triangulates with crash rate, latency, login errors, release ramp timing, experiment assignments, and unaffected control populations. The goal is not just “where did it happen?” but “what mechanism most likely caused it, and what should we do next?”
Connections
Interviewers may pivot from this topic into experimentation, especially if a metric drop overlaps with an A/B test or feature rollout. They may also probe causal inference, metric design, anomaly detection, logging/instrumentation, or product sense around choosing the right guardrail metrics. If they push deeper technically, expect discussion of counterfactual forecasting, cohort analysis, Simpson’s paradox, and multiple hypothesis testing.
Further reading
- Trustworthy Online Controlled Experiments — Kohavi, Tang, and Xu — Practical treatment of metric movement, guardrails, experiment interpretation, and debugging online systems.
- The Signal and the Noise by Nate Silver — Useful intuition for separating meaningful patterns from noisy observational data.
- Practical Statistics for Data Scientists — Bruce, Bruce, and Gedeck — Clear coverage of sampling variation, confidence intervals, regression, and resampling methods relevant to root-cause work.