Root Cause Analysis And Metric Debugging
Asked of: Data Scientist
Last updated
What's being tested
Interviewers are testing whether you can turn an ambiguous metric movement into a disciplined investigation, not whether you can brainstorm random causes. At Meta, Data Scientists are often the first line of defense when DAU, session length, retention, ads revenue, notifications, integrity metrics, or creator metrics move unexpectedly. The skill is separating real user behavior from logging artifacts, identifying the highest-probability root cause quickly, and communicating uncertainty clearly enough that product, engineering, and leadership can act. Strong answers show structured decomposition, causal skepticism, metric literacy, and practical knowledge of large-scale data systems.
Core knowledge
-
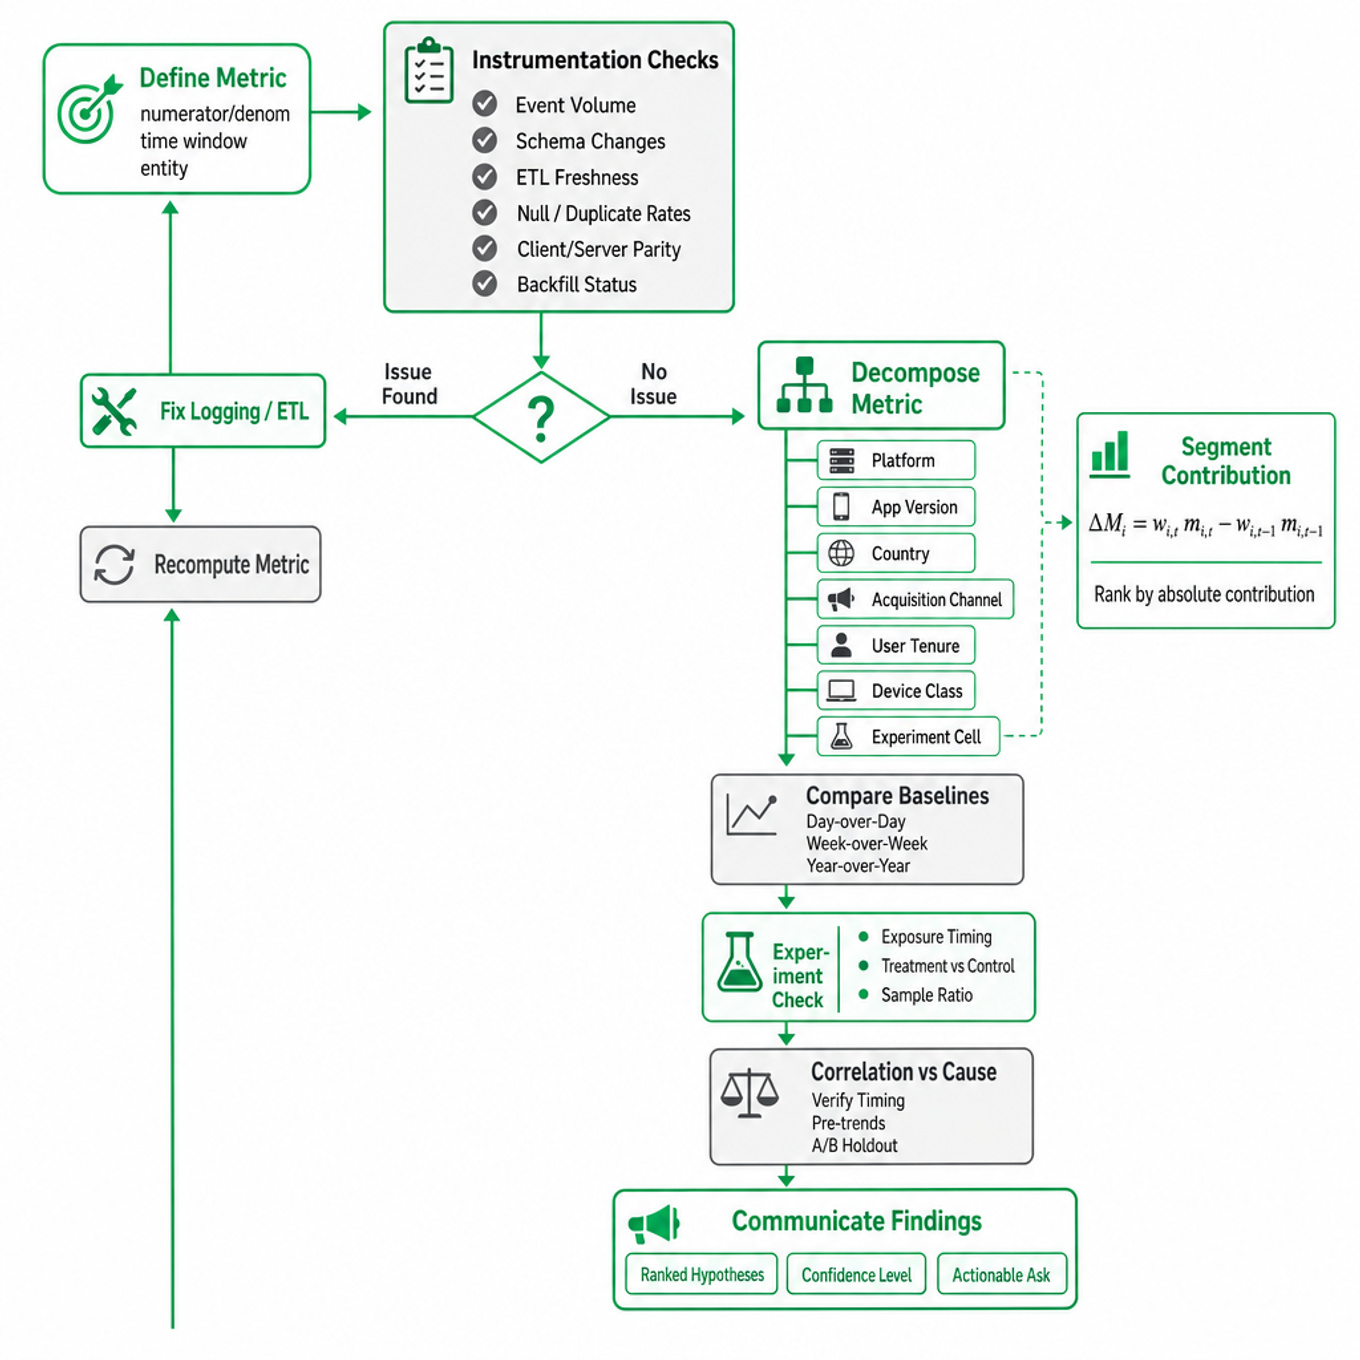
Start by defining the metric precisely: numerator, denominator, entity, time window, timezone, deduping rule, eligibility filters, and source table. “DAU dropped” could mean logged-in users, app opens, feed viewers, or users with server events; each has different failure modes.
-
Always separate instrumentation/data pipeline issues from real product/user behavior. Check event volume, schema changes, ETL freshness, null rates, duplicate rates, bot filters, client/server logging parity, and backfill status before proposing behavioral explanations.
-
Use decomposition before hypothesis testing. Break the delta by platform, app version, country, language, acquisition channel, user tenure, device class, network quality, experiment cell, and surface. For metric , inspect whether movement comes from segment performance or segment mix .
-
Quantify contribution, not just relative change. A segment with a 50% drop may be irrelevant if it is 0.1% of traffic. Use contribution:
and rank segments by absolute contribution to the global change. -
Compare against baselines that handle seasonality. Use day-over-day for sudden incidents, week-over-week for weekly seasonality, and year-over-year for holidays. For mature Meta metrics, compare to expected bands from historical variance, not just “yesterday looked lower.”
-
Distinguish correlation from cause. If a new launch coincides with a metric drop, verify exposure timing, treatment-control differences, ramp percentage, affected surfaces, and pre-trends. A clean A/B holdout is stronger than a time-series coincidence.
-
For experiment-related debugging, check sample ratio mismatch using a chi-square test:
SRM often indicates bucketing, eligibility, logging, or assignment bugs and invalidates naive treatment-control comparisons. -
Use guardrail and counter-metrics to understand mechanism. If feed likes dropped, inspect impressions, ranking scores, comments, hides, unfollows, session starts, latency, crash rate, and notification sends. A metric drop can be good if it coincides with reduced spam or harmful engagement.
-
Know common large-scale diagnostic tools: SQL/Presto/Hive for aggregation, Scuba-like real-time slicing, dashboards with anomaly alerts, experiment platforms, logging validation, and data lineage tools. Exact group-bys are fine for billions of rows in distributed warehouses, but high-cardinality user counts often use HyperLogLog-style approximations.
-
Beware Simpson’s paradox. A global metric can rise while every major segment falls if traffic shifts toward higher-performing segments. Always inspect both aggregate and segmented views, and explicitly distinguish within-segment movement from composition effects.
-
Check latency and reliability metrics when engagement changes. Higher p95 feed load time, app crash rate, notification delivery failures, ranking service timeouts, or media upload errors can cause downstream product metric drops. Latency effects are often nonlinear: p95 degradation can matter more than average latency.
-
Form hypotheses in descending likelihood and reversibility. A good incident workflow is: validate metric, localize segment/time, map to launches/incidents, test leading indicators, estimate impact, recommend mitigation, and define follow-up measurement. Avoid spending early time on exotic external explanations.
Worked example
“DAU dropped by 5% yesterday. How would you investigate?”
A strong candidate would first clarify what DAU means: unique logged-in users with at least one qualifying app event, for which app family, timezone, and whether the drop is day-over-day, week-over-week, or against forecast. They would state an initial assumption: “I’ll treat this as an unexpected global drop in a mature production metric and first rule out data quality before assuming user behavior changed.” The answer should be organized around four pillars: metric validation, segmentation/localization, linkage to known changes, and impact/next steps. For validation, they would check ETL freshness, event ingestion volume, schema changes, client/server event discrepancies, deduping, and whether other top-line metrics like sessions, feed impressions, and logins moved similarly. For localization, they would decompose by platform, country, app version, user tenure, device type, and hour of day to find whether the issue is global or concentrated, ranking segments by absolute contribution to the 5% drop. For causal investigation, they would compare the timing with app releases, ranking launches, login incidents, notification delivery problems, outages, experiments ramped yesterday, or external events such as holidays or network issues in a major region. One tradeoff to flag is speed versus certainty: in an incident setting, if 90% of the drop localizes to Android version X in two countries after a release, rollback may be justified before a perfect causal proof. They would close by saying they would quantify affected users and metric loss, recommend rollback or monitoring depending on confidence, and, if more time were available, build an alert or validation check to catch this failure mode earlier.
A second angle
“News Feed engagement is down, but time spent is up. What could be happening?”
Here the same debugging discipline applies, but the challenge is metric interpretation rather than a single top-line incident. The candidate should clarify whether “engagement” means likes, comments, shares, reactions, clicks, or meaningful social interactions, and whether time spent is total session duration, feed dwell time, or video watch time. A plausible explanation is mix shift: users may be consuming more passive video, increasing time spent while reducing likes/comments. Another possibility is ranking or UI changes that increase scrolling or loading friction, inflating time without improving value. The right framing is to inspect the engagement funnel—impressions, dwell, clicks, reactions, comments, hides, reports—and determine whether this is a product improvement, a degradation, or a metric tradeoff.
Common pitfalls
Analytical mistake: jumping directly to a favorite cause.
A weak answer says, “Maybe a recent launch caused it,” without first checking whether the metric is real, localized, or statistically unusual. A better answer validates logging and pipeline health, then uses segmentation and launch timelines to prioritize causal hypotheses.
Communication mistake: listing checks without a decision path.
Interviewers do not want a laundry list of every possible slice. Structure matters: validate, localize, explain, quantify, act. Say what you would do first, what evidence would change your mind, and what recommendation you would make under different confidence levels.
Depth mistake: ignoring metric construction.
Many candidates treat metrics as obvious, but production metrics often depend on eligibility filters, deduplication, bot removal, app version compatibility, timezone boundaries, and delayed events. If you debug “retention dropped” without clarifying cohort definition and observation window, your investigation can be directionally wrong.
Connections
Interviewers may pivot from root cause analysis into experiment validity, especially sample ratio mismatch, guardrail metrics, heterogeneous treatment effects, or launch decision-making. They may also ask about metric design, anomaly detection, causal inference, or tradeoffs between engagement, integrity, and long-term user value.
Further reading
- Trustworthy Online Controlled Experiments, Kohavi, Tang, and Xu — Practical reference for experiment diagnostics, guardrails, SRM, and metric interpretation at scale.
- Detecting and Diagnosing Change in a Metric, Meta Engineering-style incident thinking — Meta engineering posts are useful for understanding production-scale observability and metric monitoring patterns.
- Practical Statistics for Data Scientists, Bruce, Bruce, and Gedeck — Good refresher on sampling, confidence intervals, hypothesis testing, and regression concepts used in metric debugging.
Related concepts
- Product Diagnostics And Root Cause Analysis
- Root Cause Analysis And Segmentation
- Product Metrics, Root-Cause Analysis And VisualizationAnalytics & Experimentation
- Product Debugging And Funnel AnalysisProduct / Decision Making
- Product Metric Design And Diagnostic Deep DivesAnalytics & Experimentation
- A/B Testing And Product Metric DiagnosticsAnalytics & Experimentation