
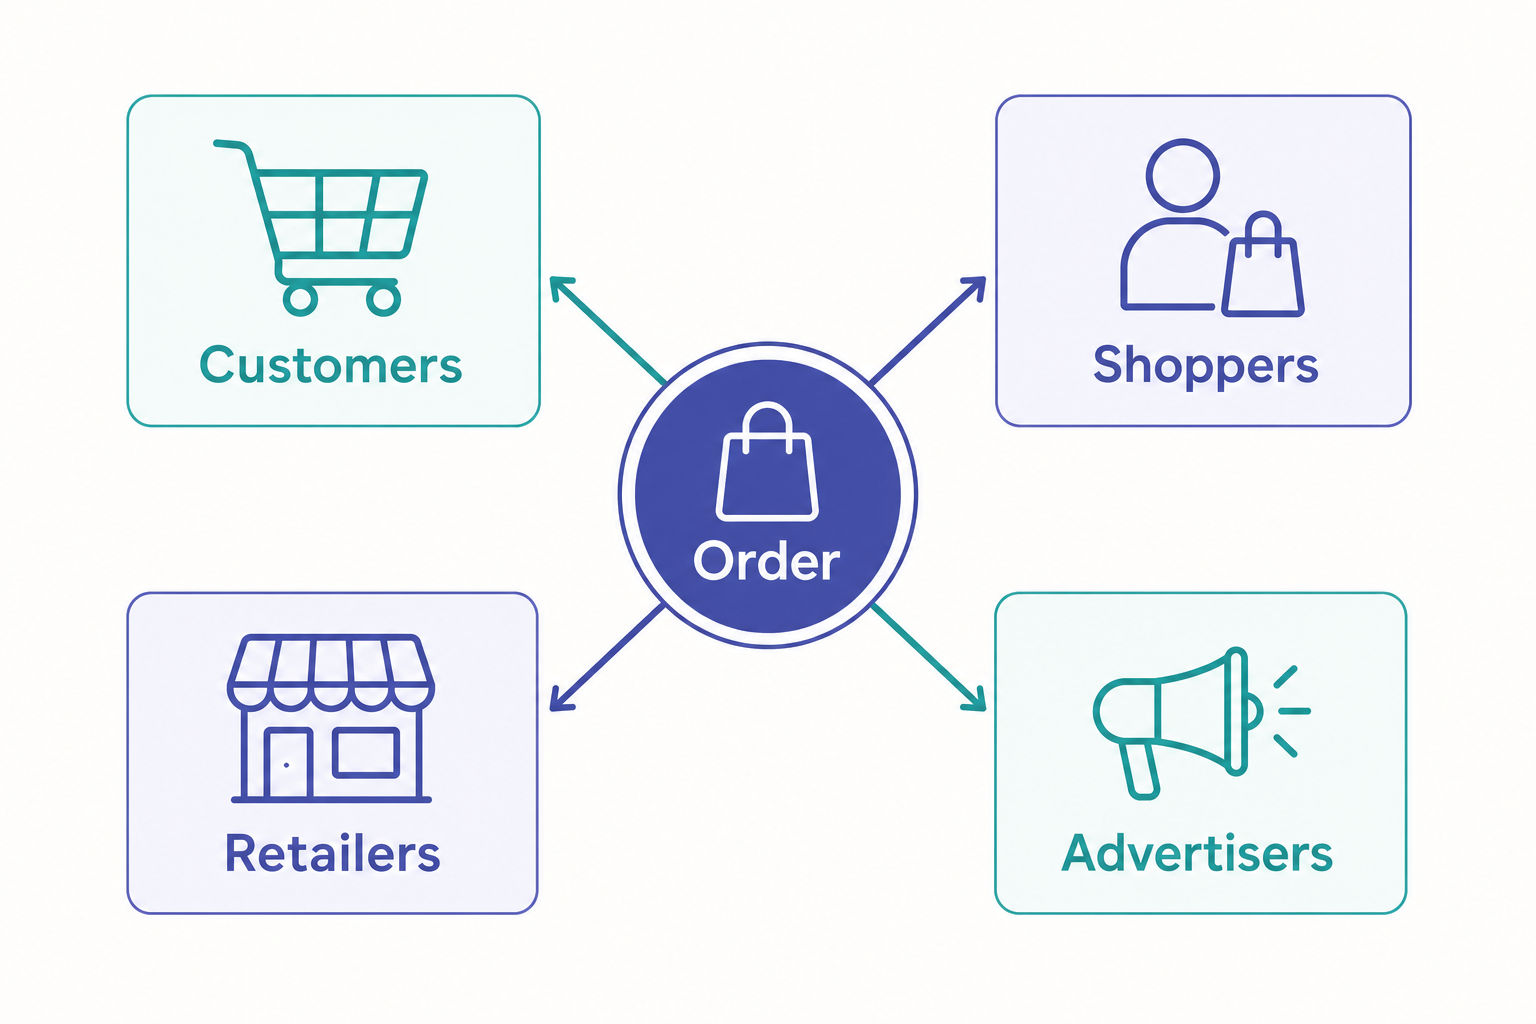
If you're interviewing for a Data Scientist role at Instacart, this guide walks you through the full loop - recruiter screen through final round - and what each stage actually tests. The thread that ties it all together is marketplace reasoning: Instacart is a four-sided market (customers, shoppers, retailers, advertisers), and the bar is whether you can make decisions that balance all four, not just optimize one number. Use this to prioritize your prep and to recognize what "good" looks like in each round.
What to expect
Instacart's Data Scientist interview goes beyond a generic analytics or machine learning loop and centers on product judgment in a marketplace. Across the process you're typically evaluated on five fronts:
- SQL and analytics execution
- Statistics and experimentation
- Product sense and metrics thinking
- Machine learning fundamentals
- Behavioral fit
Instacart tends to care less about isolated technical brilliance and more about whether you can make sound decisions across customers, shoppers, retailers, and advertisers at the same time. The emphasis leans toward practical product analytics and marketplace tradeoffs rather than textbook ML.
The process commonly runs several steps over a few weeks, though lighter or team-specific variants happen. Treat the round structure below as the usual shape, not a fixed script - exact rounds, length, and ordering vary by team and seniority.
Interview rounds
The table below maps the typical loop. Times are approximate and team-dependent.
| Round | Typical focus | What they're really checking |
|---|---|---|
| Recruiter screen | Background, motivation, role fit | Communication, genuine interest in the business |
| Hiring manager screen | Resume, a stats or product question | Can you frame ambiguity and show business judgment |
| SQL / analytics exercise | Live or timed query work | Fluency, handling messy data, narrating your approach |
| Statistics & experimentation | Inference, A/B test design | Careful reasoning about bias, power, confounders |
| Product sense & metrics | Feature evaluation, KPI diagnosis | Metric design and structured product thinking |
| ML & modeling | Model selection, validation, debugging | Practical modeling tied to a business goal |
| Behavioral | Collaboration, ownership, conflict | Objectivity, accountability, naming risks early |
| Presentation (sometimes) | Walkthrough of prior work | Executive communication, technical-to-business translation |
Recruiter screen
A short phone or video call covering your background, why Instacart, why the team, and how your experience maps to product analytics, experimentation, logistics, or marketplace work. The screen is about communication, role alignment, and genuine interest in the business.
Hiring manager or team screen
An interview focused on your resume and problem-solving style. Expect a project walkthrough plus a statistics or case/product question tied to the team's work. The goal is to see whether you can frame ambiguous problems, show business judgment, and collaborate well with cross-functional partners.
SQL and analytics exercise
Often around 60 minutes, though some candidates report longer coding or take-home challenges. The format may be live coding or a timed exercise. You're evaluated on:
- SQL fluency and data manipulation
- Analytical reasoning and handling messy data
- Clearly explaining your approach under time pressure
Statistics and experimentation
Usually an interview on inference and experiment design. Expect hypothesis testing, choosing the right statistical test, sample size and power, metric definition, and interpreting noisy or inconclusive results. This round probes whether you can reason carefully about bias, confounding, seasonality, and other marketplace-specific pitfalls.
Product sense, metrics, and case
Typically a case discussion. You might evaluate a new feature, define metrics across multiple stakeholders, diagnose a KPI movement, or recommend next steps from limited data. The emphasis is on product judgment, metric design, structured thinking, and communicating clearly with non-technical partners.
Machine learning and modeling
A round on practical modeling decisions: model selection, feature engineering, validation, regularization, and debugging underperformance. Common themes include forecasting, demand prediction, recommendations, ranking, and personalization - along with choosing an evaluation metric that fits the business problem.
Behavioral
Expect questions on collaboration, ownership, disagreement, failure, influence, and delivering difficult messages. Interviewers tend to look for objectivity, accountability for results, and the habit of naming risks early.
Presentation or case-study review (sometimes)
Some teams, especially for senior candidates, add a presentation or case review. You may walk through prior work or a take-home analysis - your methodology, tradeoffs, assumptions, and impact. This is where executive communication and the ability to connect technical work to business outcomes matter most.
What they test
Instacart's bar is broad but specific. It helps to think in four buckets.
SQL and analytics
- Joins, aggregations, CTEs, window functions, and edge cases
- Clear, readable queries
- Practical work with messy real-world data over algorithm-heavy coding
- Python or R for analysis (helpful, but secondary to analytical reasoning)
Statistics and experimentation
- Hypothesis testing, confidence intervals, and probability
- Experiment design, sample size, and power
- Causal thinking
- Reasoning about inconclusive tests, biased samples, and how seasonality or operational constraints distort results
Product and metrics
- Engagement and growth metrics: conversion, retention, reorder rate, basket size, order frequency, lifetime value
- Marketplace and operational metrics: shopper utilization, fulfillment time, supply-demand balance, retailer inventory constraints
Machine learning
- Practical fundamentals: regression, classification, clustering, and tree-based methods
- Validation, overfitting, and metric selection
- Applied to use cases like demand forecasting, recommendations, ranking, personalization, or sales prediction
Across every round, the deeper test is the same: can you make decisions that balance outcomes for customers, shoppers, retailers, and advertisers, rather than optimizing one metric in isolation?
You can drill the technical rounds against real Instacart interview questions and broaden across the full Data Scientist question bank on PracHub.
Marketplace thinking: the skill that decides your loop
The single biggest differentiator at Instacart is whether you instinctively check the other side of the market before you celebrate a metric win. A change that lifts customer conversion can quietly raise shopper workload, strain a retailer's inventory, or distort ad auction dynamics. Strong candidates name those tensions without being prompted.
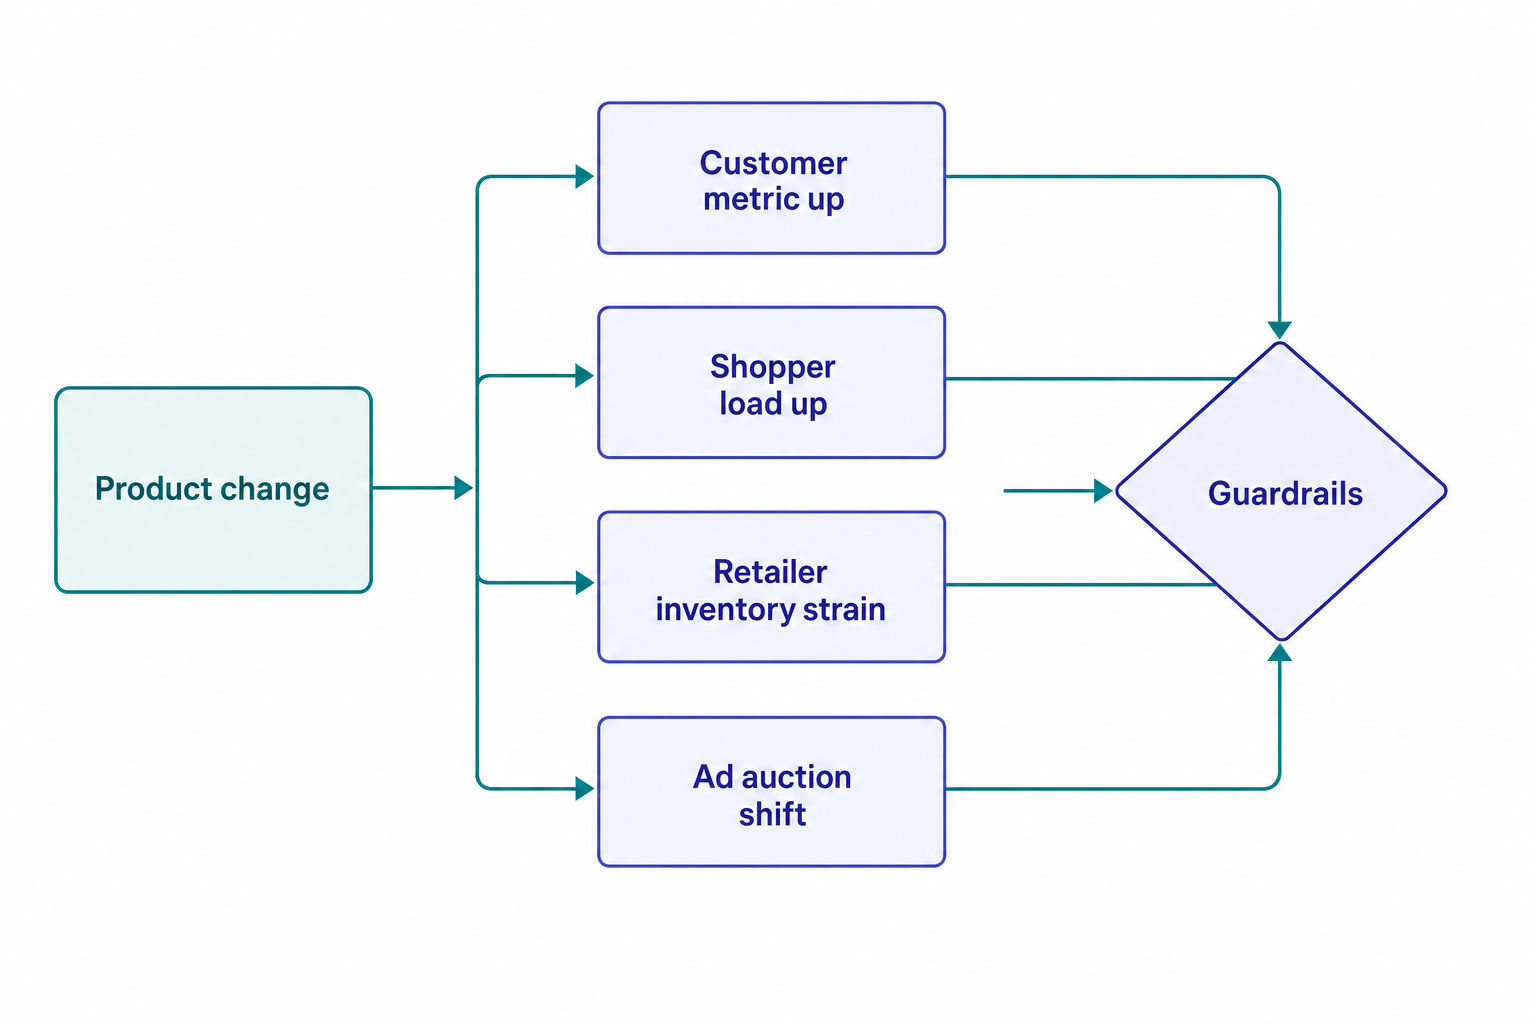
A useful habit for the product and experimentation rounds is the primary plus guardrails frame: name one success metric, then at least two guardrail metrics tied to different stakeholders.
Example: suppose you're asked to evaluate a feature that auto-adds frequently-bought items to the cart.
- Primary metric: average basket size per order.
- Customer guardrail: cart-removal rate or post-checkout refund/complaint rate (is the feature adding unwanted items?).
- Shopper guardrail: items-per-order and pick time (bigger baskets can slow fulfillment).
- Retailer guardrail: out-of-stock substitution rate (auto-added items you can't fulfill hurt trust).
That structure shows you optimize the system, not a single dial.
How to stand out
| Do | Don't |
|---|---|
| Check the other side of the market before declaring a win | Optimize one metric and ignore second-order effects |
| Narrate your SQL reasoning as you write it | Code silently and reveal only the final query |
| Surface confounders unprompted (seasonality, supply, selection bias) | Wait for the interviewer to point out the obvious bias |
| Define a primary metric plus stakeholder guardrails | List a dozen metrics with no priority |
| Tell stories where your analysis changed a decision | Recite what you built without the outcome |
| Quantify the business result and the risks you flagged | Take credit for the team with no specifics |
A few of these deserve detail:
- Understand the marketplace. Be ready to explain how one product change could help customers while hurting shopper efficiency, retailer operations, or advertiser performance.
- Narrate your SQL. Talk through your reasoning as you build the query, especially with window functions, CTEs, or retention and reorder logic.
- Surface confounders unprompted in experimentation rounds: seasonality, inventory availability, supply constraints, and selection bias.
- Show decisions, not just deliverables. Use project examples where your analysis changed a product or business decision, not just where you built a model or dashboard.
- Own the outcome in behavioral answers - be explicit about risks you identified, tradeoffs you surfaced, and the business result you delivered.
- Lead with relevant domain experience. If you've worked in e-commerce, logistics, recommendations, forecasting, or marketplace systems, make it central rather than a side detail.
A two-week prep plan
You don't need months, but you do need to cover all five fronts. A rough split:
- Days 1-4 - SQL. Drill window functions, CTEs, and retention/reorder/cohort patterns. Practice narrating out loud, not just getting the right answer.
- Days 5-7 - Statistics & experimentation. Review hypothesis testing, power and sample size, and the failure modes that bite marketplaces: novelty effects, network/interference effects between shoppers, seasonality, and dilution. PracHub's explainers on dilution in A/B testing and how it affects power and survivorship bias for data scientists are good warm-ups.
- Days 8-10 - Product & metrics. Practice the primary-plus-guardrails frame on grocery, logistics, and marketplace scenarios. Work through how to reason about metric tradeoffs when one metric goes up and another goes down.
- Days 11-12 - ML. Refresh validation, overfitting, and metric selection for forecasting/ranking/recommendation problems. Depth over breadth.
- Days 13-14 - Behavioral & mock. Prepare 6-8 stories in a structured format, each ending with a measurable outcome. Do at least one full mock loop.
How to Use This Page as a Prep Plan
Do not treat this as passive reading. Convert the ideas in this page into a short weekly loop: learn one idea, practice it under interview conditions, then write down what changed. That is the fastest way to turn advice into visible interview behavior.
| Prep area | What you need to prove | Practice artifact |
|---|---|---|
| Metric framing | Define the unit, window, and denominator. | One clear metric contract. |
| SQL execution | Use readable CTEs and test row counts. | A query with checks after each join. |
| Statistics | Connect methods to decision risk. | Assumptions, confidence, and caveats. |
| Communication | Turn findings into a recommendation. | One concise business interpretation. |
For Instacart Data Scientist Interview Guide 2026, the strongest candidates usually do three things well: they make their assumptions explicit, they use concrete examples instead of vague claims, and they review mistakes quickly enough that the next practice rep is better than the last one.
Video Walkthrough
This verified YouTube video gives a second pass on the same preparation area. Use it after reading the guide, then come back and turn the advice into a practice artifact.
FAQ
How many rounds is the Instacart Data Scientist interview?
It commonly runs several stages over a few weeks - recruiter screen, hiring manager screen, then technical rounds covering SQL, statistics/experimentation, product sense, and ML, plus a behavioral round. Senior loops sometimes add a presentation. The exact count and ordering vary by team and level, so confirm your specific schedule with your recruiter.
Is the SQL round hard?
The emphasis is practical, not algorithmic. Expect joins, aggregations, CTEs, and window functions applied to messy, realistic data - retention, reorder rate, cohort, and funnel logic show up often. Writing correct queries matters, but narrating your reasoning and handling edge cases clearly matters just as much.
How much machine learning do I need?
Enough to make sound applied decisions: model selection, feature engineering, validation, regularization, and choosing an evaluation metric that fits the business problem. Instacart leans toward practical product analytics over deep theory, so prioritize being able to debug an underperforming model and justify tradeoffs over reciting algorithm internals.
What makes Instacart's interview different from other companies?
Marketplace reasoning. Instacart serves customers, shoppers, retailers, and advertisers at once, so the strongest answers show you can balance competing outcomes rather than maximize a single metric. Surfacing second-order effects and stakeholder guardrails unprompted is the clearest signal of a strong candidate.
How should I prepare for the experimentation round?
Be fluent in hypothesis testing, power, and sample size, and be ready to name marketplace-specific pitfalls: seasonality, supply constraints, selection bias, novelty effects, and interference between units (one shopper's behavior affecting another). Practice explaining what you'd do with an inconclusive or noisy result, not just a clean significant one.
Where can I practice real questions?
Work through Instacart's question set and the broader Data Scientist question bank on PracHub, then round out your prep with the full question bank and other interview guides.