
What to expect
This guide is for data scientists and analysts preparing for an Intuit DS loop (TurboTax, QuickBooks, Credit Karma, Mailchimp). It covers the rounds you're likely to face, what each one tests, the question themes that recur, and how to prepare so your answers read as product judgment, not just correct code.
Intuit's Data Scientist interview is, as of 2026, typically an applied, product-facing process rather than a research-heavy ML gauntlet. Expect a multi-stage loop that often spans a few weeks, usually starting with a recruiter conversation, moving into SQL/Python/statistics screening, and then testing how you frame business problems, choose metrics, and communicate decisions.
A distinctive feature of many Intuit data science loops is a "craft" or presentation component, where you walk a panel through a case, take-home, or prior project and defend your assumptions. The exact number of rounds and the timeline vary by team, level, and location, so treat any specific count as typical rather than guaranteed.
The clearest throughline across rounds: Intuit wants evidence that you can connect analysis to customer and business outcomes. Correct code and model knowledge are table stakes. What separates candidates is judgment - explaining tradeoffs clearly and staying grounded in product questions like retention, conversion, subscription behavior, and experimentation.
Interview rounds
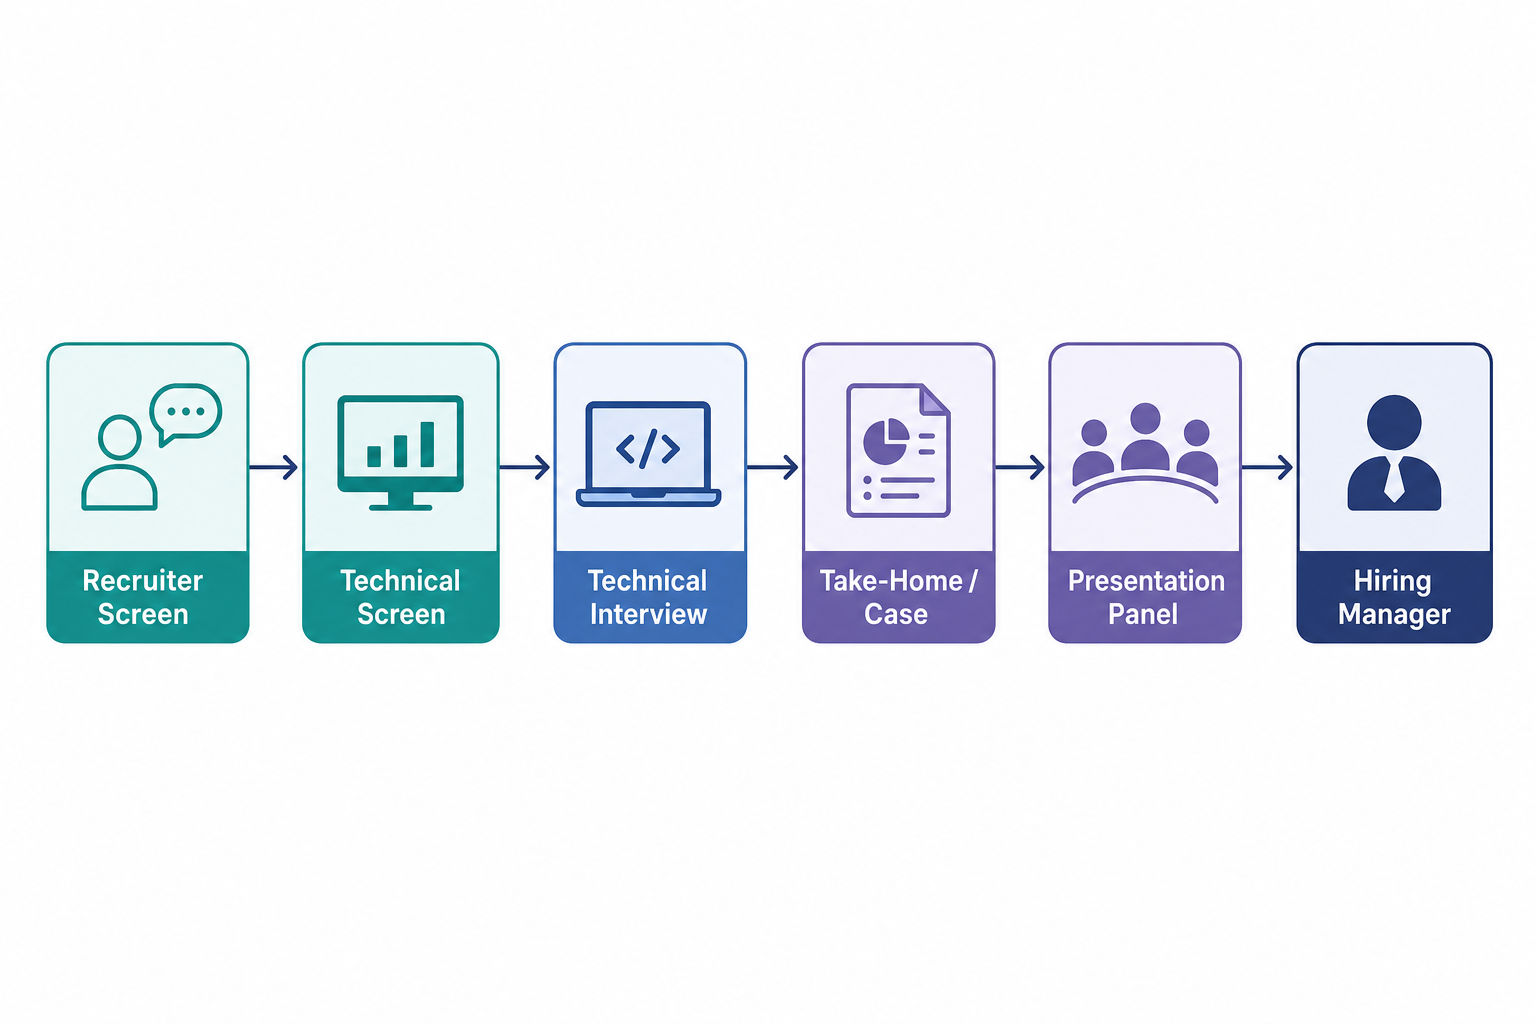
The stages below reflect the components Intuit data science loops commonly include. Not every loop has all of them, and the order can shift.
Recruiter screen
A short phone or video call focused on fit. Expect questions about your background, your motivation for Intuit, which products interest you, and the business impact of your past work. The recruiter is assessing role and level alignment, communication, and whether your experience maps to the team's needs.
Online assessment or initial technical screen
An early technical filter that may be a proctored assessment or a live screen. It typically covers Python, SQL, practical analytics, and core statistics or ML fundamentals rather than software-engineering algorithms. You might write SQL, solve short timed tasks, define metrics, or reason through what data you'd use to answer a product question.
Technical interview
A one-on-one conversation that goes deeper on modeling, statistical reasoning, product analytics, probability, and experimentation - and on your ability to explain why one approach beats another. Be ready for ML follow-ups, retention/churn framing, SQL follow-ups, and questions about how you deployed or evaluated a model in practice.
Take-home, case, or problem-statement round
Many teams include a case-based step. You may analyze a dataset, tackle a classification or business problem, design features, recommend metrics, or structure an experiment under ambiguity. This round carries weight because it shows whether you can run an end-to-end data science workflow, not just answer isolated technical questions.
Presentation, craft demo, or panel
One of the most distinctive parts of the Intuit process. You present a solution, prior project, or case analysis to a panel and then defend your metrics, modeling choices, assumptions, edge cases, and business recommendations. Interviewers focus on stakeholder communication, technical judgment, and whether you can translate analysis into action.
Hiring manager or behavioral closeout
A closing round, often led by a hiring manager, centered on values fit, collaboration, customer focus, ownership, and decision-making under ambiguity. Expect behavioral questions about influencing product decisions, handling stakeholder conflict, balancing speed with rigor, and delivering customer impact with integrity.
What they test
Intuit consistently tests applied data science fundamentals through a strong product-analytics lens. The table below maps the core areas to what interviewers actually want to see.
| Area | Typical focus | What "strong" looks like |
|---|---|---|
| SQL | Joins, CTEs, window functions, cohorting, retention, date logic | You define the business metric first, then write clean logic that handles edge cases |
| Python | Data manipulation, scripting, practical analytics | You reason through the problem rather than reaching for a black-box library |
| Statistics & experimentation | Hypothesis testing, CIs, power, A/B design, bias | You spot pitfalls (peeking, novelty effect) and interpret noisy results in business terms |
| Machine learning | Regression, trees, feature engineering, evaluation, deployment | You justify model choice and tie evaluation metrics to a real decision |
| Product reasoning | Metric definition, KPI diagnosis, churn, funnels, segmentation | You connect the analysis to retention, conversion, or trust |
A few specifics worth internalizing:
- SQL is one of the most important areas: joins, aggregations, CTEs, window functions, cohorting, retention analysis, subscription metrics, and date logic.
- Python centers on data manipulation, scripting, and practical analytics tasks. Be comfortable reasoning through a problem yourself rather than leaning on high-level libraries to do the thinking. The coding bar is real, but for this role it favors clean applied problem-solving over hard algorithm puzzles.
- Statistics and experimentation matter a lot: hypothesis testing, confidence intervals, p-values, bias, sampling, statistical power, and A/B test design. Expect to spot experiment pitfalls, choose sensible outcome metrics, and interpret noisy or incomplete results in business terms.
- Machine learning focuses on practical modeling: regression, classification, tree-based methods, feature engineering, evaluation metrics, overfitting, interpretability, and deployment tradeoffs.
- Product reasoning is where many candidates separate themselves: defining metrics, diagnosing KPI changes, reasoning about churn and retention, analyzing conversion funnels, and segmenting users to support decisions.
Because Intuit builds finance, tax, and accounting products, your answers land harder when you frame problems around subscription behavior, customer journeys, trust, risk, and measurable business impact. As of 2026, you should also be prepared for some AI-related discussion - applied AI use cases, explainability, or how AI features would be evaluated - even though the core loop is still primarily SQL, statistics, and product reasoning.
You can pull real questions across these areas from the Intuit company page and the broader Data Scientist role hub to practice the exact themes interviewers favor.
Worked example: a product-metric question
Interviewers love open-ended diagnosis prompts. Here is how to structure one without rambling.
Example prompt: "Subscription renewals for a QuickBooks plan dropped 8% month over month. How would you investigate?"
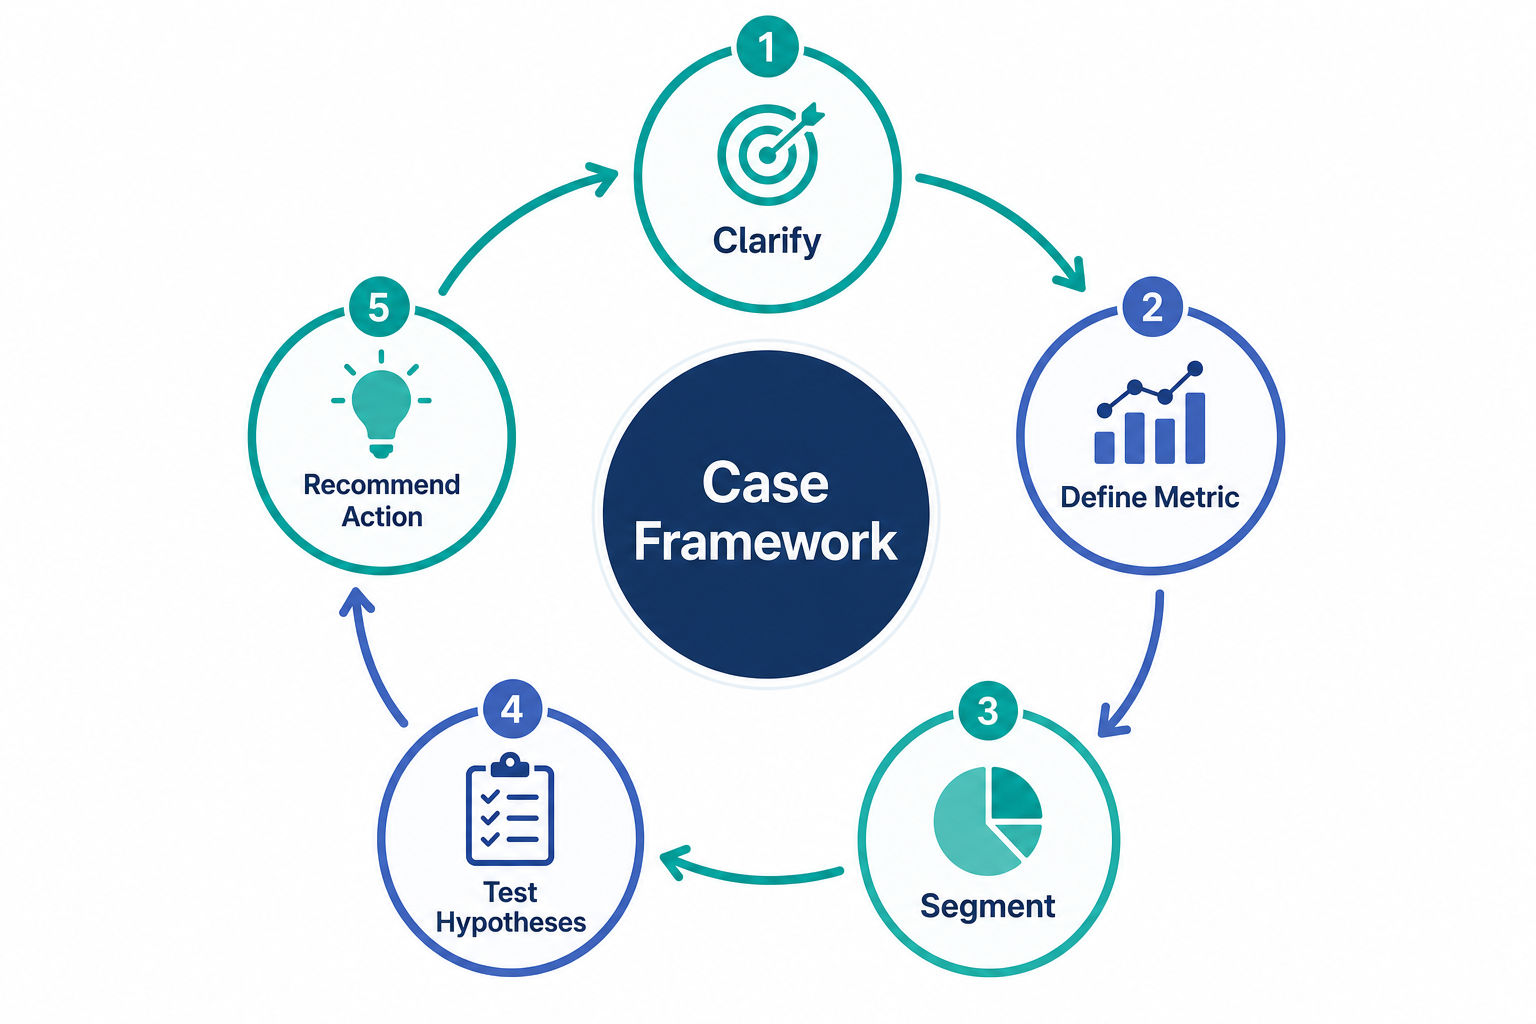
Example answer (structured out loud):
- Clarify scope. "Is the drop in a single plan tier, region, or acquisition cohort, or across the board? Did anything change - pricing, UI, a billing migration?"
- Confirm the metric. "Is 'renewals' counting attempted renewals, successful charges, or active subscriptions on day 30? A billing-failure spike looks like churn but isn't a demand problem."
- Segment before concluding. "I'd break the drop down by tenure, plan, payment method, and signup channel to see whether it's concentrated. A uniform drop suggests a systemic cause; a concentrated one points to a segment or a bug."
- Form and test hypotheses. "If failed payments rose, I'd check card-decline and dunning data. If voluntary cancels rose, I'd look at recent product or pricing changes and read cancellation reasons."
- Recommend an action. "Based on what the data shows, I'd propose a fix - for instance, a dunning-retry change for involuntary churn, or a re-engagement flow for a specific at-risk cohort - and define how we'd measure whether it worked."
Notice the answer never jumps straight to a model. It clarifies, segments, then connects to a business action. That sequence is what the craft round rewards.
How to stand out
- Treat SQL as a product-analytics tool, not a syntax quiz. State the tables you'd use, define the business metric first, then write the logic.
- Prepare one case or project presentation with a tight structure: problem, metric, method, result, limitation, recommendation. The craft round rewards concise, defensible storytelling.
- Know one ML model in depth - why you chose it, what alternatives you rejected, how you evaluated it, and how it changed a real decision.
- Practice retention, churn, conversion, and subscription problems. These themes recur and map closely to Intuit's product environment.
- Handle ambiguity out loud. Say what additional data you'd want and what assumptions you're making. Intuit looks for judgment under uncertainty, not fake certainty.
- Tie every technical answer back to the customer. When you discuss a model, metric, or experiment, explain how it improves user experience, trust, adoption, or business outcomes.
- Map behavioral stories to Intuit's values - customer obsession, integrity, courage, and collaboration. Cross-functional influence and honest tradeoff discussions land better than solo technical wins.
A 3-week prep plan
If you have about three weeks, this sequencing front-loads the highest-leverage areas.
| Week | Focus | Concrete actions |
|---|---|---|
| 1 | SQL + statistics fundamentals | Drill window functions, cohort retention, and CTEs; review hypothesis testing, power, and A/B pitfalls |
| 2 | Product analytics + ML depth | Practice metric-definition and KPI-diagnosis cases; prepare one ML model you can defend end to end |
| 3 | Craft round + behavioral | Build and rehearse one project/case presentation; write 4-6 behavioral stories mapped to Intuit's values |
For hands-on reps, work through the SQL and statistics sets in the PracHub question bank, and skim the wider interview guide library for company-agnostic frameworks on case structure and behavioral storytelling.
How to Use This Page as a Prep Plan
Do not treat this as passive reading. Convert the ideas in this page into a short weekly loop: learn one idea, practice it under interview conditions, then write down what changed. That is the fastest way to turn advice into visible interview behavior.
| Prep area | What you need to prove | Practice artifact |
|---|---|---|
| Metric framing | Define the unit, window, and denominator. | One clear metric contract. |
| SQL execution | Use readable CTEs and test row counts. | A query with checks after each join. |
| Statistics | Connect methods to decision risk. | Assumptions, confidence, and caveats. |
| Communication | Turn findings into a recommendation. | One concise business interpretation. |
For Intuit Data Scientist Interview Guide 2026, the strongest candidates usually do three things well: they make their assumptions explicit, they use concrete examples instead of vague claims, and they review mistakes quickly enough that the next practice rep is better than the last one.
Video Walkthrough
This verified YouTube video gives a second pass on the same preparation area. Use it after reading the guide, then come back and turn the advice into a practice artifact.
FAQ
Is the Intuit data scientist interview more SQL or machine learning?
For most product-facing DS roles, SQL and product analytics carry more weight than heavy ML theory. You should be fluent in window functions, cohorting, and retention logic, and able to discuss one ML model in depth - but you generally won't face algorithm-contest puzzles or research-grade modeling.
What is the "craft" or presentation round?
It's a round where you present a case analysis, take-home, or prior project to a panel and defend your metrics, assumptions, and recommendations. Interviewers care less about a flashy model and more about clear stakeholder communication and whether your analysis leads to a sound business action.
How long does the process take?
It commonly spans a few weeks across several stages, but the count and timeline vary by team, level, and location. Treat any specific number of rounds as typical rather than guaranteed, and ask your recruiter for the exact loop.
Do I need to prepare for AI-specific questions?
It helps. As of 2026, be ready to discuss applied AI use cases, explainability, and how you'd evaluate an AI feature. The core loop is still primarily SQL, statistics, and product reasoning, so don't let AI prep crowd out the fundamentals.
What's the single best way to stand out?
Tie every technical answer back to the customer and the business. When you discuss a metric, model, or experiment, explain how it improves user experience, trust, adoption, or measurable outcomes - that judgment is what separates strong candidates from technically-correct ones.