
This guide is for data scientists preparing for Stripe's interview loop - product, growth, fraud/risk, finance, or forecasting roles. It walks through each stage you'll likely face, what interviewers actually score, the SQL and experimentation patterns that come up most, and a preparation checklist you can work through in the weeks before your onsite. For hands-on reps, PracHub has practice questions for the Data Scientist role and a Stripe question bank.
What to expect
Stripe's Data Scientist interview typically runs as a multi-stage process: an initial screen, a technical assessment or take-home, and a virtual onsite loop. What makes it distinctive is the blend of analytics depth and business judgment. You are not just proving you can query data or recite statistical methods - you are showing that you can turn messy, ambiguous payments or growth problems into decisions that matter for product, risk, finance, or merchant outcomes.
Compared with more textbook data science loops, Stripe tends to weight SQL, experimentation, decision quality, and communication heavily. Take-home assignments and presentation-based evaluation come up often, so be ready to write or present executive-ready recommendations, defend your assumptions, and tie every analysis back to user and business impact.
Typical interview rounds
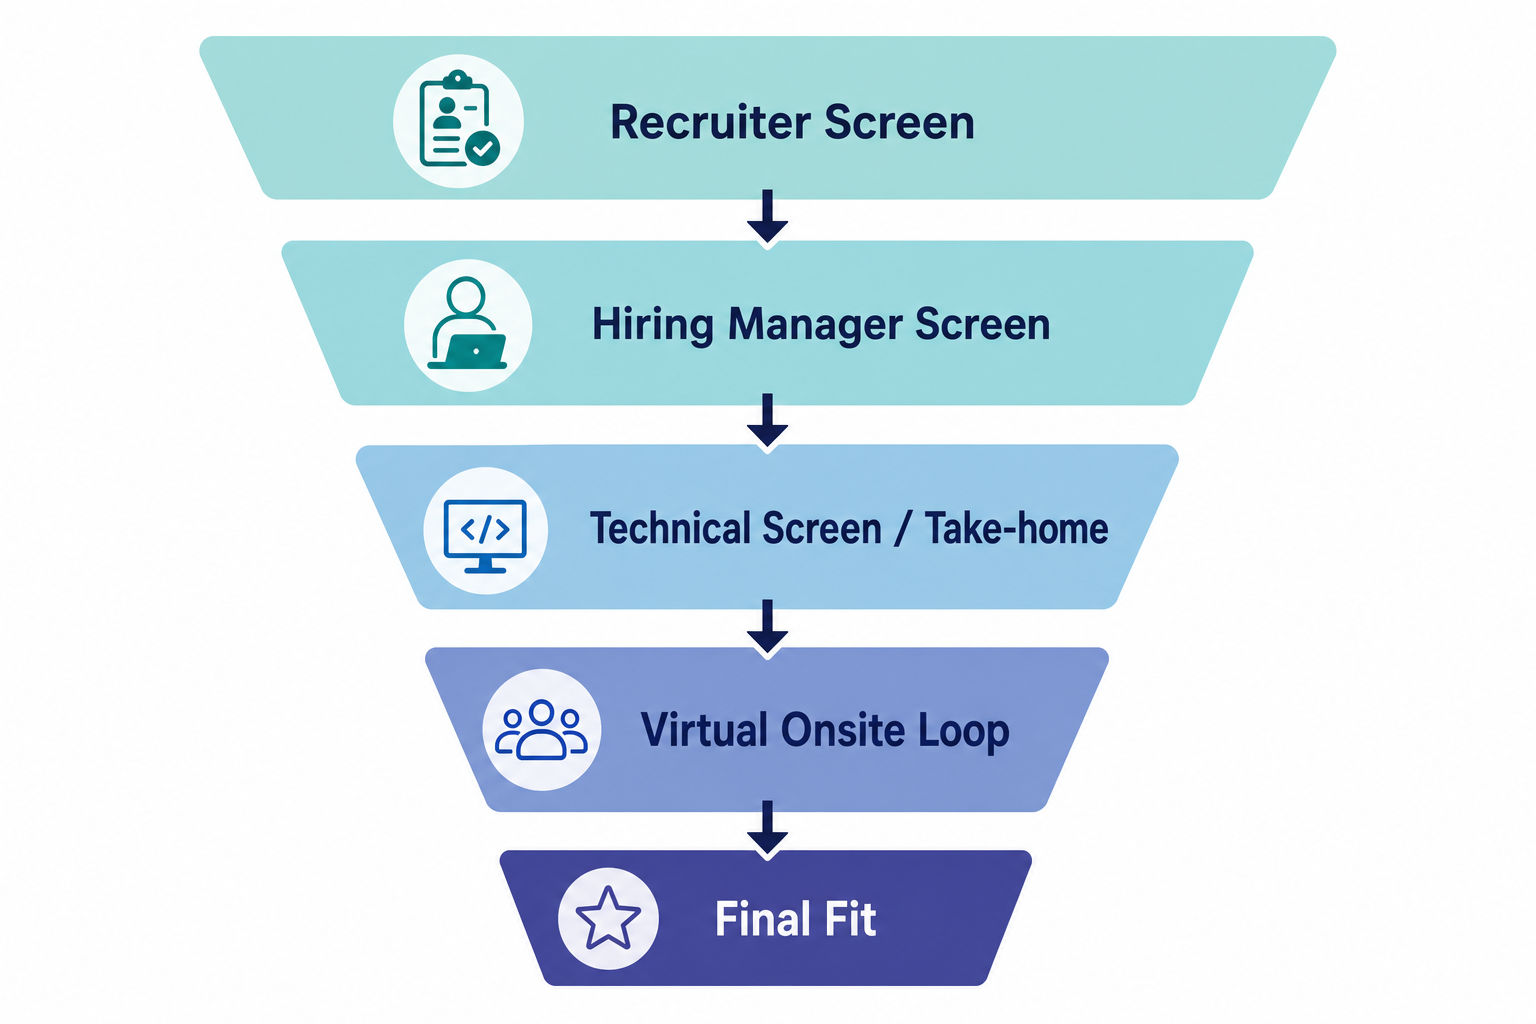
The exact loop varies by team and level, but most candidates encounter some version of the stages below. Treat this as a guide to the types of conversations you'll have, not a fixed sequence.
| Stage | Rough length | Primary focus | How to win it |
|---|---|---|---|
| Recruiter screen | ~30 min | Background, motivation, role fit | Crisp "why Stripe / why this domain" narrative |
| Hiring manager / senior IC screen | ~30–45 min | Project ownership, impact, level | One or two stories with metric + decision |
| Technical screen or take-home | ~45–60 min live, or multi-day | SQL, stats, ambiguous business reasoning | Narrate metric logic before coding |
| Virtual onsite loop | 4–6 rounds, ~45–60 min each | SQL, experimentation, product sense, behavioral | Structured thinking, action-oriented answers |
| Final fit | ~30 min | Team calibration, enthusiasm | Be specific about problems you want to own |
Recruiter screen
A phone or video conversation covering your background, why Stripe, why this specific role, and which problem domains fit you best - product, fraud, growth, finance, or forecasting. The recruiter is checking communication clarity, motivation, and whether your experience maps to the role's scope and level.
Hiring manager or senior IC screen
More substantive than the recruiter call. You'll usually walk through one or two projects in detail, with emphasis on your ownership, how you measured success, the tradeoffs you made, and how the work influenced a business decision. The goal is to assess team fit, level, and whether you connect technical work to outcomes.
Technical screen or take-home
At this stage Stripe uses either a live technical screen or a take-home, depending on team and level:
- Live screen: focused on SQL, statistics, analytical reasoning, and working through ambiguous business questions under time pressure.
- Take-home: analyze a realistic business problem with imperfect data, then produce a concise deck or memo with recommendations and next steps.
Virtual onsite
The onsite is a loop of several back-to-back interviews. Common components include:
- SQL or coding round - solving analytical data problems live, primarily in SQL (sometimes Python or R). Interviewers care about correctness, edge cases, structured decomposition, and patterns like cohort analysis, funnel analysis, and latest-record logic on precision-sensitive financial or fraud data.
- Statistics or experimentation round - designing an A/B test, defining guardrails, reasoning about bias and confounding, and interpreting results where statistical and practical significance diverge. The emphasis is sound recommendations under uncertainty, not reciting formulas.
- Analytics, product sense, or business case - an open-ended problem where you define metrics, segment users, evaluate a launch, diagnose a funnel issue, or prioritize investigations. Evaluated on structured thinking and whether your analysis would lead to action.
- Take-home presentation (if you completed one) - presenting your work followed by Q&A. Expect probing on metric choice, assumptions, alternative explanations, limitations, and how to operationalize your recommendation.
- Behavioral or leadership round - stories about cross-functional work, ambiguity, stakeholder conflict, failed experiments, and changing direction based on data.
Some loops close with a brief hiring-manager conversation that pulls the prior rounds together and focuses on team fit, level calibration, and enthusiasm rather than a new technical problem.
What they test
SQL and analytical correctness
SQL is the most common technical filter. Be comfortable with joins, aggregations, window functions, subqueries, time-based metrics, cohort and funnel analysis, and top-1-per-group / latest-record patterns. The bar is not just valid queries - it's queries that reflect careful metric logic, handle edge cases, and support real decisions in payments, growth, fraud, or merchant operations.
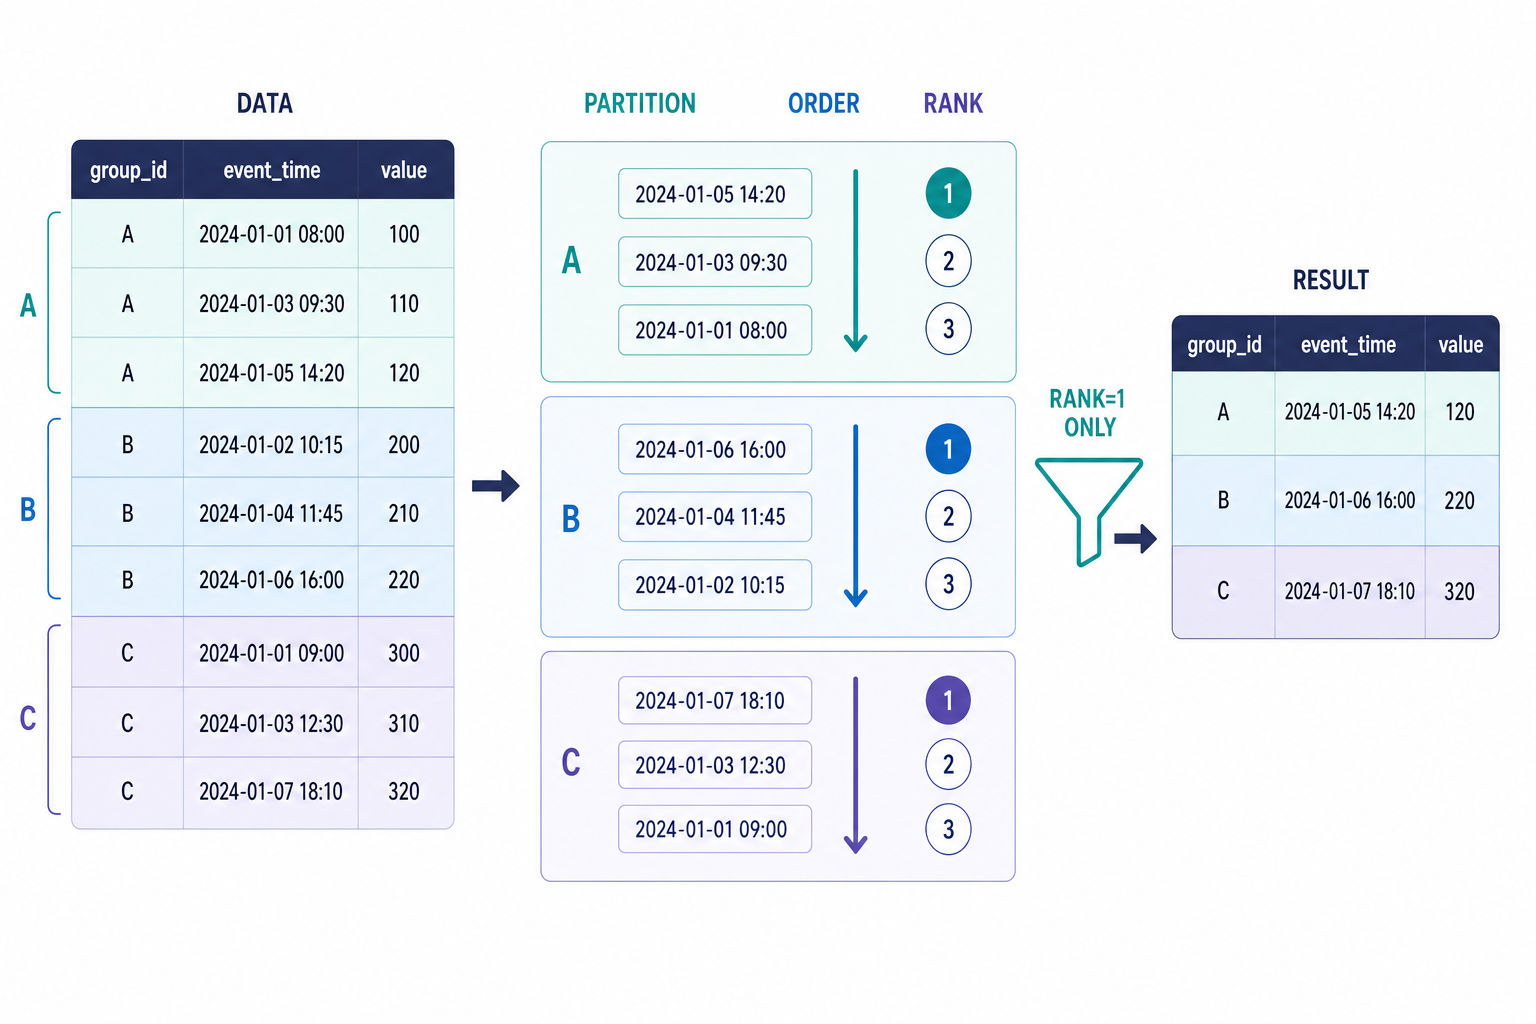
A pattern that shows up constantly in payments data is "get the latest record per entity" - for example, the most recent status of each charge or the latest plan for each subscription. The window-function idiom for that:
-- Example: latest status row per charge
SELECT charge_id, status, event_ts
FROM (
 SELECT
 charge_id,
 status,
 event_ts,
 ROW_NUMBER() OVER (
 PARTITION BY charge_id
 ORDER BY event_ts DESC
 ) AS rn
 FROM charge_events
) ranked
WHERE rn = 1;
When you write something like this in an interview, say the quiet part out loud: "I'm partitioning by charge so each charge is ranked independently, ordering by event time descending so the newest event gets rank 1, then keeping only rank 1." That narration is often worth as much as the query itself.
Statistics and experimentation
Expect hypothesis testing, confidence and uncertainty, A/B test design, guardrail metrics, sample-size intuition, and causal inference - including how to reason when randomization is unavailable or imperfect. Stripe also values practical modeling over abstract ML: churn, spend-frequency prediction, customer value, thresholding, sparse-label classification or ranking, and forecasting business outcomes.
A reliable structure for any experimentation prompt:
- State the decision. What action does this experiment inform? Ship, roll back, or iterate.
- Define the primary metric and why it captures the goal, plus 1–2 guardrails (e.g. fraud rate, latency, refund rate) you refuse to harm.
- Choose the unit of randomization (user, merchant, session) and justify it against interference and dilution.
- Size it. Talk through minimum detectable effect, baseline rate, variance, and roughly how long to run.
- Plan the readout. How you'll handle statistical vs practical significance, novelty effects, and segment heterogeneity.
Example answer (conversion experiment): "I'd randomize at the merchant level to avoid spillover between a merchant's own customers. Primary metric is checkout conversion rate; guardrails are dispute rate and p95 checkout latency. With a baseline near our current conversion and a minimum detectable effect we'd actually act on, I'd estimate the sample and run for at least one full business cycle to absorb weekly seasonality before reading results."
Product and business judgment
A major theme. You may be asked how to evaluate a launch, diagnose a conversion drop, identify users for a new product without labeled data, assess merchant health, or choose metrics for payments, subscriptions, fraud, or retention. Show that you understand the tradeoffs between growth, user experience, fraud loss, operational complexity, and revenue quality - and that you can move from data to action quickly.
Example answer (diagnosing a conversion drop): "First I'd confirm the drop is real and not an instrumentation or reporting artifact. Then I'd decompose: is it concentrated in a region, payment method, device, merchant segment, or time window? I'd check whether a release, a pricing change, or an upstream provider issue lines up with the start. The goal is to narrow from 'conversion is down' to a specific, actionable cause, then quantify the impact so we can prioritize a fix."
Communication
Because take-homes and presentation rounds are common, communication is a core test area in its own right. Strong candidates explain their assumptions, tell a tight story, defend their methods, and present recommendations that work for both technical and non-technical partners. They show judgment about what decision should be made, what risk remains, and what next step would reduce uncertainty.
What "strong" vs "weak" looks like
Interviewers are calibrating you against a bar. Here's how the same prompt reads from the two sides of it:
| Dimension | Weak signal | Strong signal |
|---|---|---|
| SQL | Jumps to syntax, ignores edge cases | Defines the metric first, handles ties/nulls/dedupe |
| Experimentation | Recites a t-test, fixates on p < 0.05 | Anchors on the decision, sets guardrails, sizes it |
| Product sense | Lists every possible metric | Picks the few metrics tied to the decision and defends them |
| Causal reasoning | Assumes correlation is causation | Names likely confounders and a mitigation |
| Communication | Buries the answer in detail | Leads with the recommendation, then supports it |
| Behavioral | Vague "we" stories | Specific "I" ownership, metric, and what changed |
How to stand out
- Speak Stripe's domains, not generic analytics. Be ready to talk concretely about payments flows, fraud tradeoffs, merchant conversion, subscriptions, growth experiments, or financial operations.
- Prepare two sharp project stories. For each, know the exact metric you optimized, the alternatives you considered, and the business decision your work changed.
- Narrate metric definitions before writing SQL. Spell out your logic for cohorts, funnels, time windows, and deduping - analytical correctness matters as much as syntax.
- Treat every case like a decision memo. State the business objective, define success and guardrails, lay out the analysis plan, and end with a recommendation plus a next step.
- Keep take-home presentations tight: context, key insight, recommendation, risk, operationalization. Expect pushback on assumptions and prepare your answers in advance.
- Show causal judgment in messy settings. When randomization is imperfect or impossible, explain the likely biases, how you'd mitigate them, and what confidence level is good enough to act.
- Be explicit about cross-functional influence. Stripe values people who partner with product, engineering, finance, risk, and go-to-market teams without relying on authority.
- Demonstrate urgency without sloppiness. Emphasize how you balanced speed with rigor and shipped analysis that was actually used.
- Know where you fit. If your strength is risk, growth, forecasting, or product analytics, say so clearly and tie it to Stripe problems you want to solve.
A 3-week prep plan
You don't need months if you focus. A workable cadence:
- Week 1 - SQL fluency. Drill window functions, funnels, cohorts, and latest-record patterns until they're automatic. Work through the SQL interview questions and time yourself.
- Week 2 - Experimentation and product sense. Practice framing A/B tests end to end and diagnosing metric movements. Rehearse the decision-first structure above out loud.
- Week 3 - Stories and mock loops. Polish two project narratives, do full mock rounds, and pressure-test your take-home presentation against tough Q&A.
For broader preparation across stages, browse the full interview-guide library and additional resources.
How to Use This Page as a Prep Plan
Do not treat this as passive reading. Convert the ideas in this page into a short weekly loop: learn one idea, practice it under interview conditions, then write down what changed. That is the fastest way to turn advice into visible interview behavior.
| Prep area | What you need to prove | Practice artifact |
|---|---|---|
| Metric framing | Define the unit, window, and denominator. | One clear metric contract. |
| SQL execution | Use readable CTEs and test row counts. | A query with checks after each join. |
| Statistics | Connect methods to decision risk. | Assumptions, confidence, and caveats. |
| Communication | Turn findings into a recommendation. | One concise business interpretation. |
For Stripe Data Scientist Interview Guide 2026, the strongest candidates usually do three things well: they make their assumptions explicit, they use concrete examples instead of vague claims, and they review mistakes quickly enough that the next practice rep is better than the last one.
Video Walkthrough
This verified YouTube video gives a second pass on the same preparation area. Use it after reading the guide, then come back and turn the advice into a practice artifact.
FAQ
How hard is the Stripe Data Scientist interview?
It is rigorous, but predictable if you prepare for the right things. The difficulty is less about exotic algorithms and more about combining clean SQL, sound experimentation, and clear business judgment under time pressure. Candidates who practice narrating their reasoning - not just producing answers - tend to do well.
Do I need to know Python, or is SQL enough?
SQL is the most common technical filter and you should be very strong in it. Python (or sometimes R) shows up in coding and analysis rounds, and a take-home may expect it for modeling or data wrangling. Treat SQL as non-negotiable and Python as expected for most roles.
How important is the take-home?
When a take-home is part of your loop, it carries real weight - both the analysis and how you present it. Interviewers probe your metric choices, assumptions, alternative explanations, and how you'd operationalize the recommendation. Prepare your defense of every decision before the presentation, not during it.
How much does domain knowledge of payments matter?
You don't need to be a payments expert on day one, but speaking fluently about conversion, fraud tradeoffs, subscriptions, and merchant outcomes signals fit. Frame your analytical answers in Stripe's terms rather than generic e-commerce examples where you can.
What's the most common reason strong candidates get rejected?
Two patterns recur: writing technically correct SQL without defining the metric logic first, and producing analysis that stops at "here's what the data shows" instead of "here's what we should do and why." Stripe weights decision quality heavily, so always close the loop to a recommendation.
How long does the full process take?
It varies by team, level, and scheduling, but candidates commonly move through the loop over a few weeks. Use that runway to drill the highest-leverage areas: SQL patterns, experimentation framing, and two well-rehearsed project stories.