Go pprof Interview Exercises: CPU Hotspots, Retained Memory, and Lock Contention
Quick Overview
Interpret synthetic Go CPU, heap, and mutex profiles by matching sample units to symptoms and verifying one correctness-preserving optimization.
A pprof screenshot does not answer “why is my Go service slow?” until you know which profile was collected and what its samples mean. CPU samples describe active execution; an in-use heap view emphasizes currently retained allocations; an alloc-space view emphasizes allocation churn; mutex samples describe contention associated with lock holders. They can point to different functions in the same service.
The interview skill is to choose the profile that matches the symptom, interpret one call path, propose a minimal change, and measure the same workload afterward. The three short excerpts below are synthetic teaching fixtures, not measured output from a running service. For adjacent practice, use PracHub's Go software engineer questions; those records are not promised pprof questions.

Quick answer: match symptom to sample unit
Go's diagnostics guide lists CPU, heap, block, and mutex profiling as distinct tools. CPU profiling samples where the program spends time actively consuming CPU. Heap profiles can report allocation sites for live objects and historical allocations, depending on the selected sample value. Block profiling records time blocked on synchronization primitives; mutex profiling reports lock contention.
| Symptom | First profile to consider | What not to infer |
|---|---|---|
| High CPU during representative traffic | CPU profile | The top function is necessarily the root cause. |
| Resident memory grows after traffic settles | Heap in-use view, repeated over time | A high all-time allocation total is a leak. |
| Heavy allocations and GC pressure | alloc-space or allocs view | Every allocation remains live. |
| Requests wait behind a shared lock | Mutex and possibly block profile | A CPU profile must expose waiting time. |
The runtime/pprof documentation describes heap's inuse_space, inuse_objects, alloc_space, and alloc_objects views. Select the one matching the question. The label “memory profile” is too vague to support a diagnosis.
Before profiling: define the workload and boundary
Ask whether the issue is throughput, p99 latency, CPU utilization, memory growth, or an intermittent stall. Record the Go version, process build, traffic shape, input sizes, and whether profiling is in a benchmark or a live service. A ten-second profile of an idle server is not evidence about a busy endpoint.
For a controlled test, Go benchmarks can produce CPU and memory profiles. For an HTTP service, net/http/pprof exposes endpoints such as /debug/pprof/profile and /debug/pprof/heap when registered. The documentation shows a 30-second CPU profile URL with a seconds query. If the service uses a custom ServeMux, registration needs attention. Protect profiling endpoints: they can expose internal function names and runtime state, and capturing them imposes cost. Do not place an unrestricted debug listener on the public Internet for interview convenience.
Collect profiles for the same steady traffic window as the observed symptom. Pair them with request counts, latency percentiles, CPU and memory metrics, and a baseline before modification. The profiler observes samples, not an oracle about causality.
Exercise 1: interpret flat and cumulative CPU cost
Imagine this simplified synthetic CPU report from a 30-second load test:
flat     flat%    cum      function
6.0s     30%      6.0s     hashBlock
1.0s      5%     12.0s     buildIndex
0.2s      1%     18.0s     handleRequest
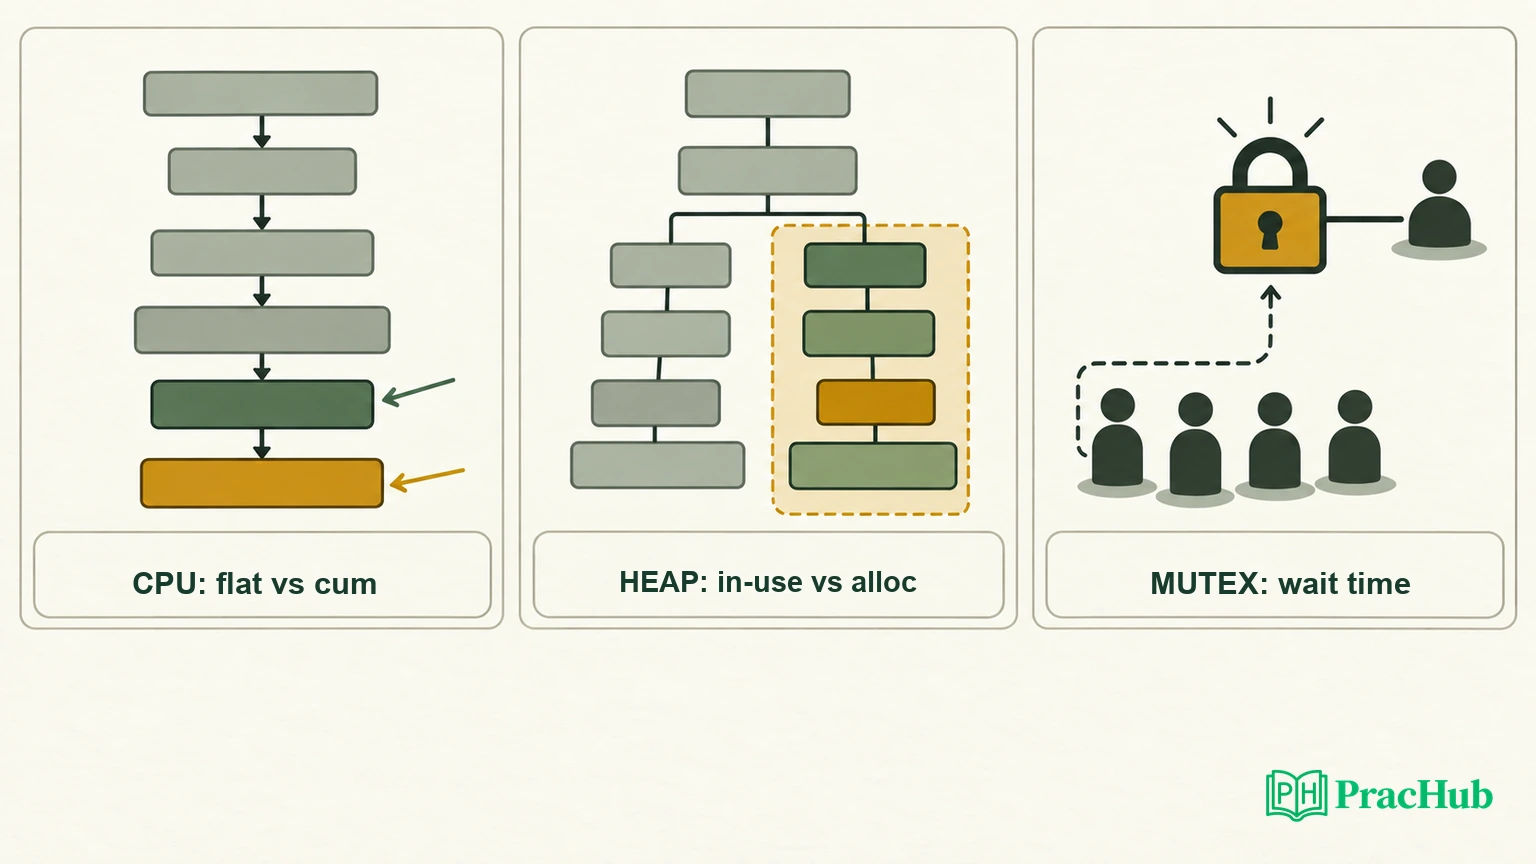
The flat value is time sampled in the function itself; cumulative includes time in descendants on its call path. The Go pprof article walks through that distinction with top and cumulative views. buildIndex may be a useful ownership boundary even though only a small fraction is flat in that function. Optimizing the wrapper's few instructions would miss expensive children such as hashBlock.
State what the report cannot prove. A high flat percentage in hashBlock does not yet say the hash algorithm is poor. It may be called too often because of duplicate work, excessive retries, or a bad input distribution. Inspect call graph and source lines, count calls or requests, and compare expected work per request. Then choose a change: reduce repeated hashing, change data structure, cache a safely reusable result, or accept the cost if it is the necessary core computation.
If the service has high p99 latency but low CPU use, a CPU profile alone may be the wrong instrument. Waiting on I/O or locks need a different view. A strong candidate says that rather than manufacturing a CPU optimization from an irrelevant chart.
Exercise 2: distinguish retained heap from churn
Consider a service that allocates 2 GB over an hour but has a stable 80 MB live heap after garbage collection. The high alloc_space value is a churn signal: those bytes were allocated, but many may already be collectible. Now consider a service whose inuse_space rises from 80 MB to 600 MB after traffic returns to idle. That is a different question about retained objects and their references.
Go's runtime/pprof description says the heap profile normally reports statistics as of the most recently completed garbage collection, and its sample-value flags select live versus historical views. A single heap snapshot is therefore insufficient to claim a leak. Collect comparable profiles at defined points, align with traffic and GC, and identify whether the same allocation site continues to retain more objects.
An interview response might examine a cache keyed by user ID. If entries never expire, retained memory can grow with distinct users. But a profile naming the allocation site does not reveal every owner of those objects or prove that cache policy is wrong. Inspect cache cardinality, eviction behavior, and lifetime requirements. Add a bounded policy only after determining which entries may safely disappear.
For an allocation-heavy serializer, reducing temporary copies might lower alloc_space and GC work even if inuse_space was already stable. Verify both allocation count and throughput after the change. “We fixed a memory leak” would be inaccurate if the main improvement was lower transient allocation churn.
Exercise 3: interpret mutex contention
Imagine a mutex profile pointing to an unlock in updateStats with high cumulative wait time, while the CPU profile gives that function little attention. A mutex profile is about contention experienced by goroutines waiting for locks; the runtime/pprof docs note that stacks correspond to the end of the critical section causing contention, such as an unlock. Do not conclude that Unlock itself burns that CPU time.
Your first hypothesis should be about the critical section: Does it hold the lock across I/O? Does it perform serialization or a long loop while other requests wait? Does one global lock protect unrelated keys? Inspect the code and the traffic distribution. Then choose the smallest safe experiment: move nonshared computation outside the lock, shorten the protected update, or shard state when semantics permit.
Keep correctness visible. Replacing a mutex with atomics can break a multi-field invariant. Sharding can change exact ordering or snapshot semantics. If the interviewer asks for a fix, explain which invariant the lock currently protects and how the proposed design maintains it.
Mutex and block profiles are not automatically populated at the sensitivity you need. Go's net/http/pprof guide shows runtime.SetBlockProfileRate and runtime.SetMutexProfileFraction for enabling relevant sampling; the runtime reference documents the controls. Configure them deliberately for a bounded diagnostic, record the rate, and account for profiling overhead.
Which profile would you open next?
Suppose high request latency coincides with little CPU activity but a long queue. You might inspect a block or mutex profile and service queue metrics. Suppose CPU is saturated and the mutex profile is small: start with CPU call paths. Suppose memory rises only under bursts then returns after GC: compare in-use and allocation views before asserting retention.
This is the second article-specific asset: a counterfactual decision tree. Each branch says what result would make you change direction. If a mutex fix makes the profile hotspot disappear but p99 latency stays high, the original hypothesis was incomplete. Return to the measured request path, not the pleasing chart.
You can also use a goroutine profile for a large number of blocked goroutines. But a count of goroutines alone does not prove a leak: servers intentionally hold many idle goroutines under some architectures. Compare counts and stack patterns before and after load, and check whether they should terminate.
Read the report without overclaiming
The top command ranks samples, while list and call-graph views help locate source lines and caller relationships. A high cumulative percentage can appear in a parent that merely owns the path; a high flat percentage can appear in a leaf called for avoidable reasons. Inspect both. The Google pprof documentation explains report and sample-value selection.
Profile percentages are relative to the samples collected. A function can occupy a larger percentage after an optimization elsewhere even if its own absolute cost did not increase. Compare absolute sample values, wall time, workload, and user-visible metrics. Likewise, do not compare a CPU profile from a cold build with one from a warm production load and call the difference a code win.
Sampling also means small functions and rare events can be underrepresented. If a rare p99 spike is the problem, correlate with traces or targeted metrics; a 30-second aggregate may dilute the event. Select an observation window that actually contains the symptom.
Verify one proposed optimization
Write down the hypothesis before changing code: “A single mutex held while formatting responses causes wait time; moving formatting outside the protected section should reduce mutex contention without changing response contents.” Record baseline request rate, p50 and p99 latency, CPU, heap, allocation, and mutex samples under fixed input. Then make one change.
Re-run correctness and race tests, plus the same load. Compare both pprof samples and service outcomes. If contention falls but allocation explodes, the trade-off may be unacceptable. If throughput rises but p99 worsens, state which objective governs the decision. A profile is a guide to an experiment; success is measured at the workload boundary.
Do not claim a local Go run when the exercise only supplies synthetic data. In a real interview, clearly distinguish “I observed” from “I would collect.” This precision is itself a technical strength.
Five PracHub questions for related practice
These verified records support concurrency and performance reasoning, not a claim that they contain these exact pprof exercises.
| PracHub question | Profiling transfer |
|---|---|
| Identify and handle race conditions | Keep correctness after a lock change. |
| Improve concurrency beyond a single lock | Evaluate state partitioning under contention. |
| Diagnose I/O, Memory, and CPU Constraints | Match instrument to bottleneck. |
| Debug a slow concurrent network server under load | Relate profile samples to end-to-end latency. |
| Implement a thread-safe rate limiter | Benchmark shared-state design without breaking invariants. |
A one-minute interview answer
“I would first name the symptom and select the matching profile. In CPU pprof I would compare flat and cumulative paths; for memory I would separate in-use bytes from allocation churn; for lock waits I would inspect mutex and block samples and the protected critical section. I would collect a representative baseline, make one correctness-preserving change, then repeat the same load and compare both profile data and request-level outcomes.”
Practise that answer with one PracHub software engineer question: explain which profile you would request and which observation would disprove your first hypothesis.
Sources and Further Reading
- Go diagnostics guide
- net/http/pprof package documentation
- runtime/pprof package documentation
- Go runtime profiling controls
- Go blog: Profiling Go Programs
- Google pprof report documentation
Research note: Checked September 28, 2026. The profile excerpts are synthetic; actual sample units, overhead, and runtime behavior should be checked against the Go version and workload used in the exercise.
Comments (0)