Ads Ranking And Monetization Analytics
Asked of: Data Scientist
Last updated
What's being tested
Meta ad ranking analytics tests whether a Data Scientist can reason about monetization, user experience, and causal measurement in the same system. Interviewers are probing for more than “revenue went up”: they want to see if you can define metrics, design a valid experiment, identify tradeoffs between ad load and engagement, and diagnose whether ranking changes improved the auction or merely shifted impressions. A strong answer connects ranking model quality, auction outcomes, advertiser value, and user retention without drifting into model-serving or data-pipeline implementation. Meta cares because small ranking or insertion changes can move billions of impressions while creating subtle harms: ad fatigue, advertiser budget cannibalization, short-term revenue spikes, or long-term feed engagement loss.
Core knowledge
-
Ads ranking objective is usually some form of expected value:
For click campaigns this resembles`eCPM` = bid_CPC × pCTR × 1000; for conversion campaigns it may use`pCVR`, predicted conversion value, and advertiser constraints. -
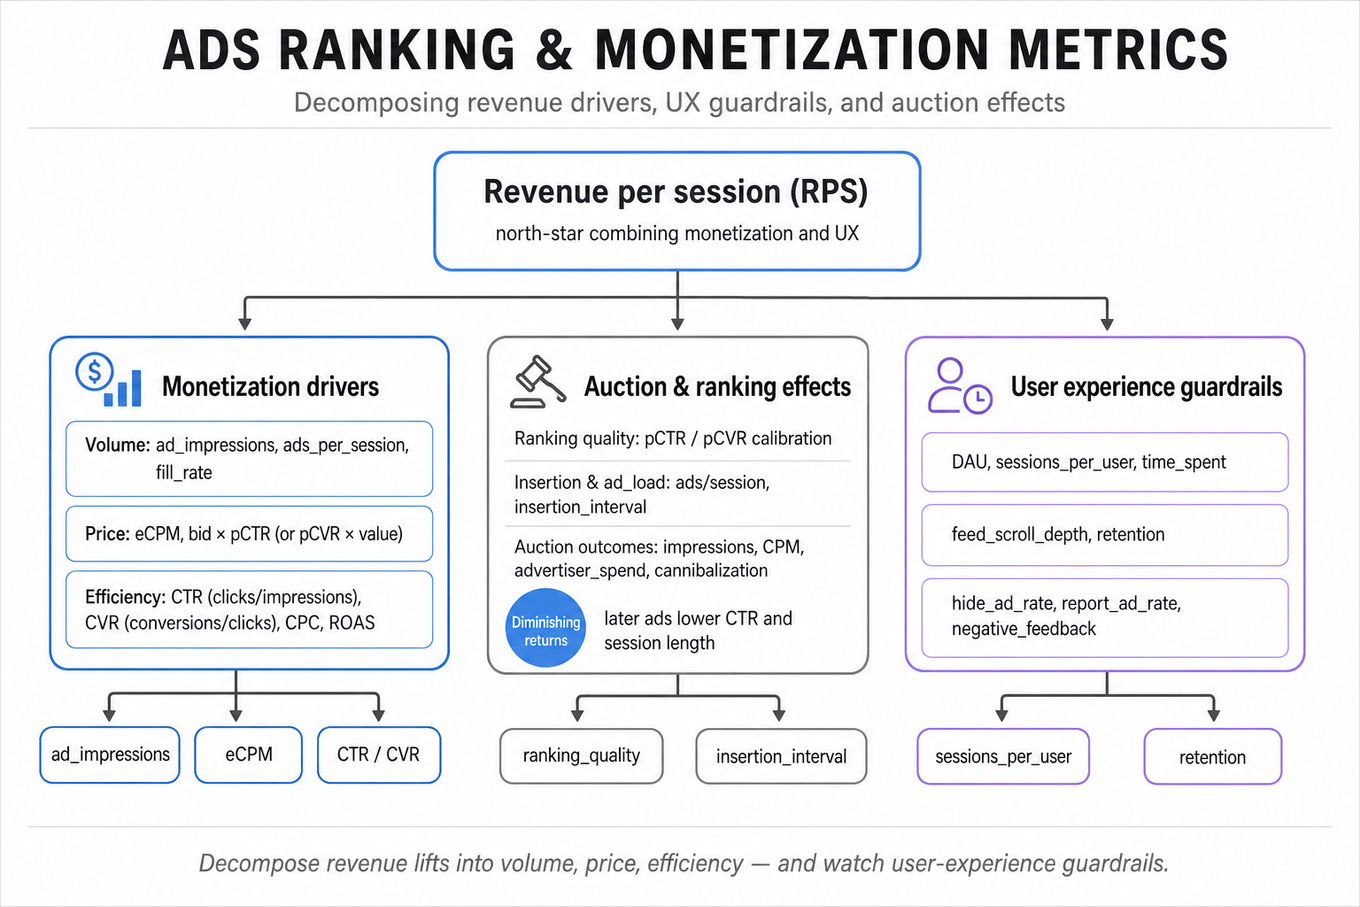
Primary monetization metrics should distinguish volume, price, and efficiency:
`ad_impressions`,`clicks`,`conversions`,`CTR` = clicks / impressions,`CVR` = conversions / clicksor conversions/impressions,`CPC`,`CPM`,`eCPM`,`revenue_per_user`,`revenue_per_session`, and advertiser-side`ROAS`. A revenue lift alone is ambiguous without decomposing these drivers. -
User experience guardrails are essential because ads compete with organic feed content. Common guardrails include
`DAU`,`sessions_per_user`,`time_spent`,`feed_scroll_depth`,`hide_ad_rate`,`report_ad_rate`, negative feedback, retention, and long-term engagement. A ranking change that increases`revenue_per_session`while reducing sessions can be value-destroying. -
Ad load is the number or density of ads shown per feed session, often expressed as
`ads / feed_stories`,`ads / session`, or insertion interval. Revenue often has diminishing returns: the first extra ad may monetize well, but later ads can lower`CTR`, increase fatigue, reduce session length, or cannibalize higher-quality impressions. -
Auction and ranking effects must be separated from pure inventory effects. If revenue rises because users saw more ads, that is different from higher auction efficiency. Analyze normalized metrics such as
`revenue_per_impression`,`eCPM`,`CTR`,`conversion_rate`, and user-level revenue, not just total revenue. -
Experiment unit choice is usually the user, not the impression, because impressions within a user are correlated and treatment changes future behavior. Randomizing at impression level can cause interference within a session and contaminate user experience metrics. Analyze at the user level when estimating standard errors.
-
Power and minimum detectable effect matter because monetization metrics are often heavy-tailed. For a two-sample test, an approximate per-arm sample size is
where is the detectable lift. Revenue may need winsorization, CUPED, or bootstrap confidence intervals. -
CUPED variance reduction uses pre-experiment covariates, often prior revenue or engagement, to improve precision:
This is especially useful for ads because users have persistent monetization propensities. -
Attribution windows must be explicit for conversion metrics. A click-through conversion metric might count purchases within 1, 7, or 28 days after a click; view-through conversions are more vulnerable to correlation bias. State whether you measure same-session, same-day, or delayed outcomes.
-
Heterogeneous treatment effects are central in ads. Segment by country, device, new versus mature users, session depth, advertiser vertical, campaign objective, and baseline ad engagement. A global average can hide harm to low-engagement users or over-monetization in sensitive markets.
-
Interference and marketplace effects complicate experimentation. Changing ranking for treated users can alter advertiser budget pacing, auction prices, and availability for control users. For large marketplace changes, consider budget-aware analysis, geo-level tests, or limiting exposure to avoid cross-arm contamination.
-
Tail and run analysis matters for insertion methods. Two systems with the same expected ad count can differ in the probability of consecutive ads, long gaps, or clusters. Metrics like probability of
`2+`ads within`k`feed units, max run length, and distribution of inter-ad distance capture experience harms averages miss.
Worked example
For “Determine Key Metrics and Design A/B Test for Ad Ranking,” a strong first 30 seconds would clarify: what ranking change is being tested, whether the goal is advertiser value, Meta revenue, user experience, or a weighted objective, and whether the experiment affects ad selection, ad ordering, or ad load. I would state assumptions: randomize at the user level, keep ad load policy fixed unless explicitly part of the treatment, and evaluate both short-term monetization and engagement guardrails. The answer skeleton should have four pillars: define the objective and metrics, design the experiment, analyze heterogeneous effects, and make a launch recommendation.
For metrics, I would propose a primary business metric such as `revenue_per_user` or `revenue_per_session`, advertiser value metrics like `conversions_per_impression` and `ROAS`, and user guardrails such as `session_length`, `ad_hide_rate`, and retention. For design, I would use a randomized A/B test with pre-period balance checks, sample-size calculation, an experiment duration that covers weekday effects and delayed conversions, and user-level clustered standard errors. I would explicitly monitor `SRM`, pre-treatment covariate balance, and novelty effects, because ranking changes can cause early behavior shifts that do not persist.
One tradeoff I would flag is choosing `revenue_per_user` versus `revenue_per_impression` as the primary metric. `Revenue_per_user` captures total business impact, but it can rise from showing more or worse-timed ads; `revenue_per_impression` isolates auction efficiency but can miss user-level inventory changes. I would close by saying that if I had more time, I would estimate longer-term retention and advertiser budget effects, then run segment-level analyses to ensure the lift is not concentrated in a small high-monetization cohort while harming broader feed health.
A second angle
For “Determining the optimal ad load in News Feed,” the same concepts apply, but the treatment is not just ranking quality; it directly changes the quantity and spacing of ads. The key framing becomes marginal value: what is the incremental revenue from the next ad, and what is the incremental cost in engagement, retention, and advertiser performance? Instead of a single A/B test, I would consider multiple ad-load arms or a dose-response design, then estimate curves for `revenue_per_user`, `time_spent`, `hide_ad_rate`, and retention. The important constraint is nonlinearity: moving from 1 to 2 ads per session may be very different from moving from 6 to 7. I would also look for personalization opportunities because high-intent users may tolerate more ads while low-engagement users may churn.
Common pitfalls
Pitfall: Treating impressions as independent observations.
A tempting but wrong approach is to say, “We have billions of impressions, so the test will be powered immediately.” Impressions from the same user, session, advertiser, and auction are correlated, so standard errors can be severely underestimated. A better answer aggregates or clusters at the user level and discusses marketplace interference when advertiser budgets are affected.
Pitfall: Optimizing only for short-term revenue.
Saying “launch if `revenue` is statistically significantly positive” is incomplete. Ads ranking changes can increase near-term revenue by lowering relevance, increasing fatigue, or shifting spend from future auctions. A stronger recommendation balances `revenue_per_user`, advertiser outcomes, negative feedback, and retention, with a plan for longer-term monitoring.
Pitfall: Listing metrics without a decision framework.
Candidates often name ten metrics but never say which one decides launch, which are diagnostics, and which are guardrails. Interviewers want prioritization: one primary metric, a small set of guardrails with acceptable degradation thresholds, and diagnostic cuts that explain why the result happened.
Connections
Interviewers may pivot from ads ranking into incrementality measurement, uplift modeling, marketplace experimentation, or recommender-system evaluation. They may also ask SQL-style metric computation, but the Data Scientist expectation is usually to define attribution logic, denominators, and interpretation rather than design the underlying pipelines.
Further reading
-
Trustworthy Online Controlled Experiments — Kohavi, Tang, Xu — Practical reference for experiment design, guardrails, variance reduction, and launch decision-making.
-
The Unfavorable Economics of Measuring the Returns to Advertising — Lewis and Rao, 2015 — Explains why ad effects are hard to measure precisely, even with large samples.
-
Position Auctions — Varian, 2007 — Useful background on auction mechanics and why ranking, bids, and predicted action rates interact.
Featured in interview prep guides
Practice questions
- Compute ad impression conversion ratesMeta · Data Scientist · Onsite · medium
- Write SQL for Pixel Signal MetricsMeta · Data Scientist · Technical Screen · medium
- How investigate a brand-ad spend drop?Meta · Data Scientist · Technical Screen · medium
- Write SQL for CTR and revenueMeta · Data Scientist · Technical Screen · medium
- Compute ad revenue metrics by geography in SQLMeta · Data Scientist · Technical Screen · medium
- Write SQL for revenue and advertiser analysesMeta · Data Scientist · Onsite · medium
- Estimate CTR lift with binomial tests and errorsMeta · Data Scientist · Onsite · hard
- Determine Key Metrics and Design A/B Test for Ad RankingMeta · Data Scientist · Onsite · hard
- Explain Algorithm's Disproportionate Impact on Demographic SegmentsMeta · Data Scientist · Onsite · medium
- Determining the optimal ad load in News FeedMeta · Data Scientist · Technical Screen · hard
- Diagnosing a drop in total ads revenueMeta · Data Scientist · Onsite · medium
- [Analytical Reasoning] Comparing Two Newsfeed Ad Insertion MethodsMeta · Data Scientist · Onsite · medium
Related concepts
- Ads, Revenue, And Monetization Analytics
- Ads Revenue, Auction, And Business TradeoffsAnalytics & Experimentation
- Ads, Revenue, And Marketplace Analytics
- Shop Ads And Shopping MeasurementAnalytics & Experimentation
- Shop Ads And Social Commerce Analytics
- CTR And Engagement MetricsAnalytics & Experimentation