Causal Inference And Incrementality
Asked of: Data Scientist
Last updated
What's being tested
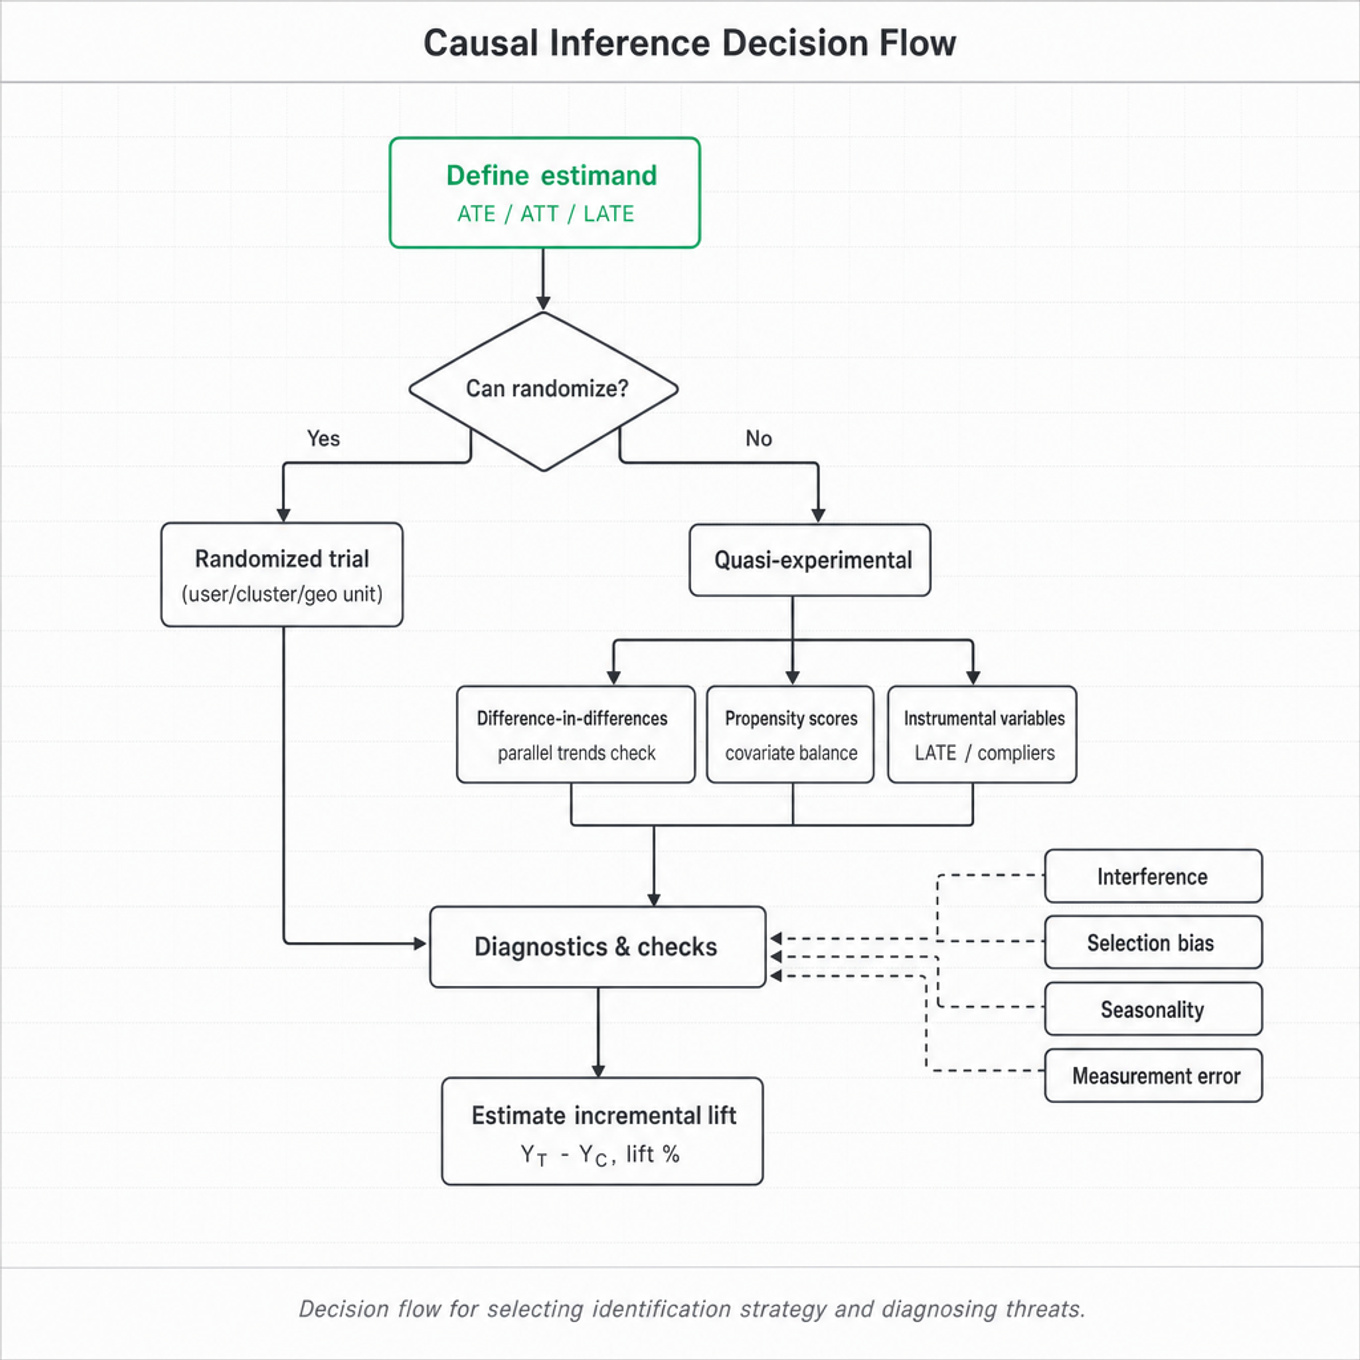
Interviewers are testing whether you can separate correlation from causation and estimate the incremental effect of a product, ranking, ads, or growth intervention under real-world constraints. At Meta, many decisions affect billions of users, advertisers, creators, and social graph interactions, so naive before/after analysis can lead to expensive false positives. The interviewer is probing whether you can choose an identification strategy, articulate assumptions, define the right estimand, and diagnose threats like interference, selection bias, seasonality, and measurement error. They care less about reciting causal inference definitions and more about whether you can design a credible decision-making analysis when experimentation is imperfect.
Core knowledge
-
Start by defining the estimand: average treatment effect , treatment effect on treated , or local average treatment effect for compliers. Many Meta questions hinge on whether the business needs user-level, advertiser-level, marketplace-level, or ecosystem-level incrementality.
-
Randomized controlled trials are the gold standard because treatment assignment is independent of potential outcomes: . For user-facing products, randomize at user, device, session, cluster, geo, advertiser, or market level depending on spillovers, logging feasibility, and decision unit.
-
Incrementality means the causal lift relative to a counterfactual, not total observed volume. If an ads campaign drove 10,000 conversions but 8,000 would have happened anyway, incremental conversions are 2,000 and incrementality is often reported as or lift .
-
Interference is common in social products: one user’s treatment can affect another user’s outcome through messaging, Feed content, groups, Marketplace supply, or auction competition. When SUTVA fails, use cluster randomization, ego-network holdouts, geo experiments, switchbacks, or graph-cluster methods rather than simple user-level A/B tests.
-
Difference-in-differences estimates causal impact using pre/post changes in treated versus control groups: Its key assumption is parallel trends; validate with pre-period trend plots, placebo tests, event studies, and sensitivity checks.
-
Propensity score methods adjust for observed confounding: estimate , then match, stratify, or weight by inverse probability weights. They do not fix unobserved confounding, and they fail when overlap is poor, e.g. high-value advertisers almost always receive treatment.
-
Regression adjustment estimates and can improve precision, but causal validity comes from identification, not the regression itself. Include pre-treatment covariates only; controlling for post-treatment mediators like clicks or time spent can block part of the causal effect.
-
CUPED and covariate adjustment reduce experiment variance using pre-treatment metrics: , where . This is powerful for stable metrics like revenue, sessions, or historical conversions, often reducing sample size by 10–50% if correlation is high.
-
Geo experiments and conversion lift studies are common for ads incrementality when user-level randomization is impossible or privacy-constrained. Randomize geographies or audience cells, hold out exposure, compare conversions or revenue, and watch for geo imbalance, cross-geo spillover, seasonality, and insufficient power.
-
Switchback experiments randomize treatment over time windows, useful for marketplace, ranking, or infrastructure changes where simultaneous treatment/control contamination is high. They require stable short-term carryover, enough alternating periods, and careful handling of weekday/hour effects; common units are hour, day, or market-hour.
-
Instrumental variables handle unobserved confounding when there is a valid instrument affecting treatment but not outcome except through treatment. The Wald estimator is for binary/simple settings; at Meta, plausible instruments might include randomized eligibility, latency-induced exposure variation, or auction throttles, but exclusion restrictions are hard.
-
Power and MDE matter for incrementality: Rare outcomes like purchases or long-term retention need larger samples, longer duration, covariate adjustment, or aggregate designs; otherwise a “null” result may simply be underpowered.
Worked example
How would you measure the incrementality of a new ads ranking model?
A strong candidate would first clarify the decision: are we estimating incremental advertiser conversions, Meta revenue, user experience impact, or marketplace welfare, and is the rollout eligible for randomization? They would also ask whether the model changes auction allocation, bid prices, delivery volume, or only ranking quality, because those choices determine the right unit of randomization. The answer should be organized around four pillars: define the estimand and primary metrics, choose the experimental or quasi-experimental design, identify threats to validity, and describe analysis plus launch criteria. The cleanest design might be a randomized advertiser- or user-level holdout, but if the ranking model changes auction competition, user-level randomization could contaminate prices and delivery, making geo-level or auction-cell randomization more credible. They would flag the tradeoff between precision and interference: user-level A/B has high power but may violate SUTVA; geo experiments reduce spillover but require more time and careful matching. The analysis would compare incremental conversions or value using intent-to-treat, include guardrails like ad load, hide/report rates, session time, advertiser ROI, and possibly CUPED using pre-period spend or conversions. They should explicitly distinguish total conversions attributed by last-click models from incremental conversions caused by the model. To close, they could say: “If I had more time, I’d run heterogeneity analyses by advertiser size, vertical, and conversion lag, and I’d validate the result with a longer-term holdout to detect cannibalization or learning effects.”
A second angle
How would you estimate the effect of push notifications on user retention if an experiment was not run?
The same causal toolkit applies, but the constraint shifts from experiment design to observational identification. The tempting analysis is to compare retained users who received notifications versus those who did not, but that is biased because more active users may be more likely to be eligible, logged in, or reachable. A stronger framing would define treatment as notification receipt or randomized eligibility, then look for quasi-random variation such as notification system outages, throttling rules, eligibility thresholds, or regional rollout timing. If using difference-in-differences, the candidate should test parallel pre-trends and avoid controlling for post-treatment engagement. If no credible exogenous variation exists, they should present propensity weighting or matching as descriptive and explicitly caveat that unobserved confounding remains.
Common pitfalls
Analytical mistake: treating attribution as causality. A wrong-but-tempting answer is “we can use click-through conversions or last-touch attribution to measure lift.” That measures associated conversions, not incremental conversions; a better answer proposes a holdout or causal design and explains the counterfactual.
Communication mistake: jumping into methods before defining the business estimand. Saying “I’d run DiD” or “I’d use propensity scores” without clarifying outcome, unit, and treatment makes the answer sound mechanical. Start with “what decision are we making, for whom, over what time horizon, and what counterfactual matters?”
Depth mistake: ignoring interference and equilibrium effects. Many Meta systems are networked or marketplace-based, so user-level independence may be false. Strong candidates proactively discuss spillovers, auction effects, creator supply responses, notification fatigue, and whether cluster, geo, or switchback designs are needed.
Connections
Interviewers may pivot from here into A/B testing, experimental power, metric design, marketplace dynamics, or ads measurement. If they push on causal validity, expect follow-ups on difference-in-differences, instrumental variables, propensity scores, synthetic controls, or heterogeneous treatment effects. If they push on implementation, be ready to discuss logging, randomization units, guardrail metrics, and launch decision frameworks.
Further reading
- Mostly Harmless Econometrics — Clear treatment of regression, IV, DiD, and causal identification assumptions.
- Causal Inference for the Brave and True — Practical Python-oriented explanations of matching, DiD, IV, synthetic controls, and uplift modeling.
- Trustworthy Online Controlled Experiments — Industry-focused guide to experiment design, metrics, power, and online experimentation pitfalls.
Related concepts
- Causal Inference And Quasi-Experiments
- Causal Inference, Difference-In-Differences, And Cannibalization
- Causal InferenceAnalytics & Experimentation
- Causal Inference And Difference-In-DifferencesAnalytics & Experimentation
- Causal Inference And IdentificationStatistics & Math
- Causal Inference, Confounding, And MatchingAnalytics & Experimentation