Causal Inference
Asked of: Data Scientist
Last updated
What's being tested
DoorDash causal inference interviews test whether you can move from “a metric changed” to “what caused it, how would we prove it, and what decision should we make?” The interviewer is probing for marketplace experimentation, counterfactual reasoning, metric design, and structured diagnosis across consumers, merchants, and Dashers. DoorDash cares because small operational changes—pay models, batching, merchant selection, grocery substitution flows, ETA promises—can shift multiple sides of the marketplace at once. A strong Data Scientist distinguishes correlation from causation, chooses the right unit of analysis, anticipates interference, and translates evidence into a launch or rollback recommendation.
Core knowledge
-
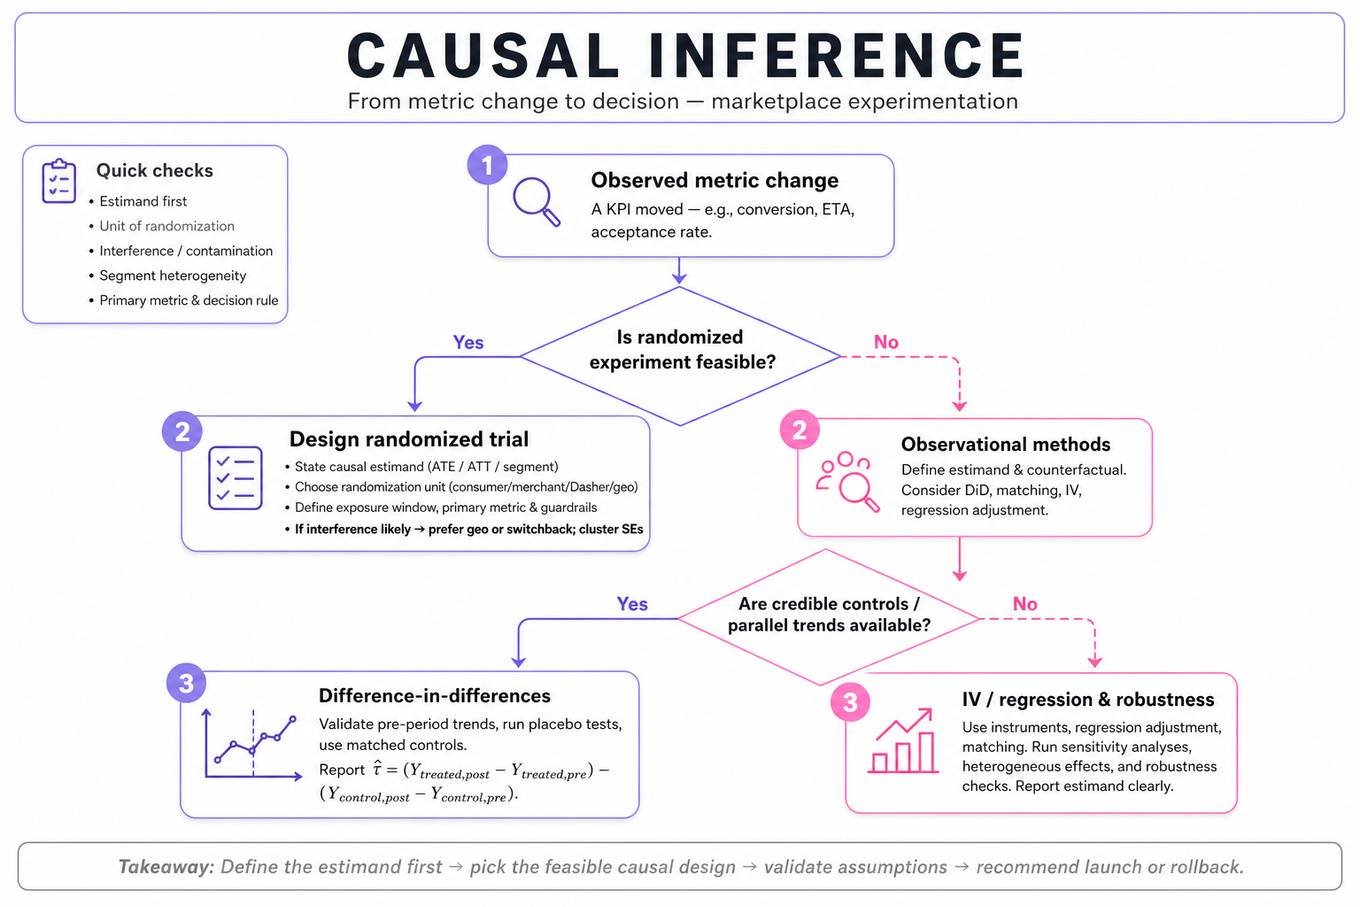
Causal estimand comes before method. State whether you need the average treatment effect: , treatment effect on treated, local effect, or segment-specific effect. For DoorDash, effects often differ by market, daypart, merchant type, weather, and order distance.
-
Randomized controlled trials are the gold standard when feasible. Define treatment, control, randomization unit, exposure window, primary metric, guardrails, and decision rule upfront. Common units include consumer, merchant, Dasher, delivery, store, or geo-market; the wrong unit can create contamination.
-
Interference is central in marketplaces. One Dasher’s incentive treatment can affect untreated consumers through supply reallocation, batching, and ETA changes, violating SUTVA. If spillovers are likely, prefer geo-level randomization, switchback designs, or explicit network/market-level analysis over naive user-level randomization.
-
Switchback experiments work well for operational levers that affect a market in real time, such as Dasher pay, dispatch logic, or batching. Randomize market-time blocks, for example city-hour or zone-daypart, and analyze with clustered standard errors. Watch for carryover effects if incentives alter Dasher positioning after the treatment block.
-
Difference-in-differences estimates causal effects when randomization is unavailable:
Its key assumption is parallel trends. Validate with pre-period trend plots, placebo tests, and matched controls before trusting the estimate. -
Regression adjustment improves precision but does not magically remove bias. A model like is credible when treatment assignment is as-good-as-random conditional on covariates. Include pre-treatment variables only; controlling for post-treatment mediators like actual delivery time can block part of the causal effect.
-
Instrumental variables can help when treatment exposure is endogenous, but the bar is high. A valid instrument must affect the outcome only through treatment and be correlated with treatment. In delivery settings, examples are rare; randomized eligibility or phased rollout timing can sometimes serve, while raw distance or demand level usually fails exclusion restrictions.
-
Metric hierarchy should separate primary outcomes, guardrails, and diagnostics. For late deliveries, primary metrics might be
% deliveries > promised ETA + 10 minandconsumer reorder rate; guardrails include Dasher earnings per active hour, merchant cancellations, refunds, and contribution profit. Diagnostics include pickup wait, travel time, batching rate, and prep-time error. -
Unit of analysis must match the causal question. For cold food complaints, order-level outcomes are natural, but consumer-level repeat behavior needs consumer aggregation. For merchant variety, treatment may be market-level because adding merchants changes the choice set for many consumers simultaneously.
-
Power and minimum detectable effect should be discussed quantitatively. For a binary metric, approximate standard error is . Rare events like cold-food complaints or grocery out-of-stock substitutions may need larger samples, longer tests, CUPED-style variance reduction, or a more frequent proxy metric.
-
Heterogeneous treatment effects matter operationally but should be planned. Segment by market density, distance band, merchant category, new versus existing consumers, and daypart. Avoid fishing across dozens of cuts without correction; use pre-specified segments, hierarchical modeling, or false discovery rate controls when many comparisons are explored.
-
Causal diagnosis is not only “run an experiment.” Start with metric validation, decomposition, temporal and geographic localization, cohort cuts, and funnel breakdowns. Then generate hypotheses and choose evidence: experiment if controllable, quasi-experiment if not, observational analysis for prioritization, and deep dives into logs or support labels as signal sources.
Worked example
For Diagnose and experiment to reduce late deliveries, a strong candidate would start by clarifying the definition of “late”: late relative to quoted ETA, promised delivery window, or actual food-ready time, and whether the business cares about order-level lateness, consumer experience, or merchant SLA. They would state assumptions such as “I’ll treat late delivery rate as the primary metric, with cancellation, refund rate, Dasher earnings, and reorder rate as guardrails.” The answer should be organized around four pillars: validate the metric and instrumentation, decompose the delivery lifecycle, identify causal hypotheses, and design experiments or quasi-experiments.
The diagnostic decomposition might split total delivery time into merchant prep time, Dasher assignment latency, travel-to-merchant, pickup wait, travel-to-consumer, and batching delay. The candidate should compare affected versus unaffected markets, dayparts, merchant types, weather conditions, and distance bands to isolate where the spike originates. If the leading hypothesis is inaccurate prep-time estimates, an experiment could adjust quoted prep-time buffers or merchant-facing prep prompts at the merchant or market level. If the hypothesis is Dasher supply shortage, a switchback test of incentives by zone-hour may be more appropriate than consumer-level randomization. A key tradeoff is that geo or switchback tests reduce interference but require more careful power calculations and clustered analysis. The close should be decision-oriented: “If the test reduces late rate without hurting Dasher earnings, merchant wait, or contribution margin, I’d recommend rollout; if I had more time, I’d estimate heterogeneous effects by market density and build a monitoring dashboard for recurrence.”
A second angle
For Define and Measure Merchant Variety's Impact on Consumers, the same causal toolkit applies, but the treatment is less like a single operational toggle and more like a change to the consumer choice set. The first task is defining merchant variety: count of available merchants, cuisine/category diversity, price-band coverage, distance-adjusted availability, or entropy of impressions/orders. A naive correlation between higher variety and higher order frequency is confounded because dense, high-demand markets naturally attract more merchants. Strong designs include geo-level expansion tests, phased merchant onboarding, matched market difference-in-differences, or synthetic controls for markets receiving new categories. The causal outcome should include consumer conversion and retention, but also merchant cannibalization, Dasher efficiency, and marketplace liquidity.
Common pitfalls
Pitfall: Treating correlation as causation.
A tempting answer is “markets with more merchants have higher retention, so variety improves retention.” That ignores demand density, income, urbanicity, marketing, and pre-existing consumer intent. A better answer states the counterfactual problem, proposes randomization or a quasi-experiment, and uses observational cuts only to prioritize hypotheses.
Pitfall: Optimizing one side of the marketplace in isolation.
For a Dasher compensation change, focusing only on delivery speed or acceptance rate is incomplete. Higher pay could improve fulfillment while hurting contribution margin, consumer fees, or merchant throughput; lower pay could preserve margin while creating supply shortages. DoorDash interviewers expect a balanced metric suite across consumers, merchants, Dashers, and business health.
Pitfall: Giving an experiment design without discussing interference and unit choice.
User-level A/B testing is often wrong for dispatch, pricing, selection, and operational levers because treated and control users share Dashers, merchants, and market capacity. Call out spillovers explicitly and choose market-level, store-level, cluster-level, or switchback randomization when marketplace equilibrium effects are likely.
Connections
Interviewers may pivot from causal inference into metric design, A/B testing and power analysis, root-cause analysis, marketplace dynamics, or ML model evaluation for ETA, ranking, and dispatch models. Be ready to discuss guardrail metrics, segmentation, novelty effects, multiple comparisons, and how offline model quality connects to online marketplace outcomes.
Further reading
-
Mostly Harmless Econometrics — rigorous intuition for regression, IV, difference-in-differences, and causal identification.
-
Trustworthy Online Controlled Experiments — practical experimentation guidance from large-scale product settings.
-
Causal Inference: The Mixtape — accessible treatment of matching, synthetic controls, DiD, and modern causal designs.
Featured in interview prep guides
Practice questions
- Diagnose completed orders drop in Los AngelesDoorDash · Data Scientist · Onsite · medium
- Diagnose and experiment to reduce late deliveriesDoorDash · Data Scientist · Technical Screen · hard
- Diagnose cold-food spike and design experimentsDoorDash · Data Scientist · Onsite · hard
- Diagnose LA completed-order drop and design experimentDoorDash · Data Scientist · Technical Screen · hard
- Diagnose Causes of High Out-of-Stock Rate in GroceriesDoorDash · Data Scientist · Onsite · hard
- Measure Impact of Merchant Variety on Consumer ExperienceDoorDash · Data Scientist · Onsite · medium
- Investigate Pop-up Impact on Partner Referral ConversionsDoorDash · Data Scientist · Onsite · medium
- Evaluate Account-Partner Onboarding with Success MetricsDoorDash · Data Scientist · Onsite · hard
- Identify Key Drivers of Delivery Decline in Los AngelesDoorDash · Data Scientist · Technical Screen · hard
- Determine Optimal Dasher Compensation Model and Diagnose Metric DropsDoorDash · Data Scientist · Onsite · hard
Related concepts
- Causal Inference And ConfoundingStatistics & Math
- Causal Inference, Confounding, And MatchingAnalytics & Experimentation
- Causal Inference And IdentificationStatistics & Math
- Causal Inference And Quasi-ExperimentsAnalytics & Experimentation
- Causal Inference, Difference-In-Differences, And Cannibalization
- Causal Inference And Difference-In-DifferencesAnalytics & Experimentation