Causal Inference And Confounding
Asked of: Data Scientist
Last updated
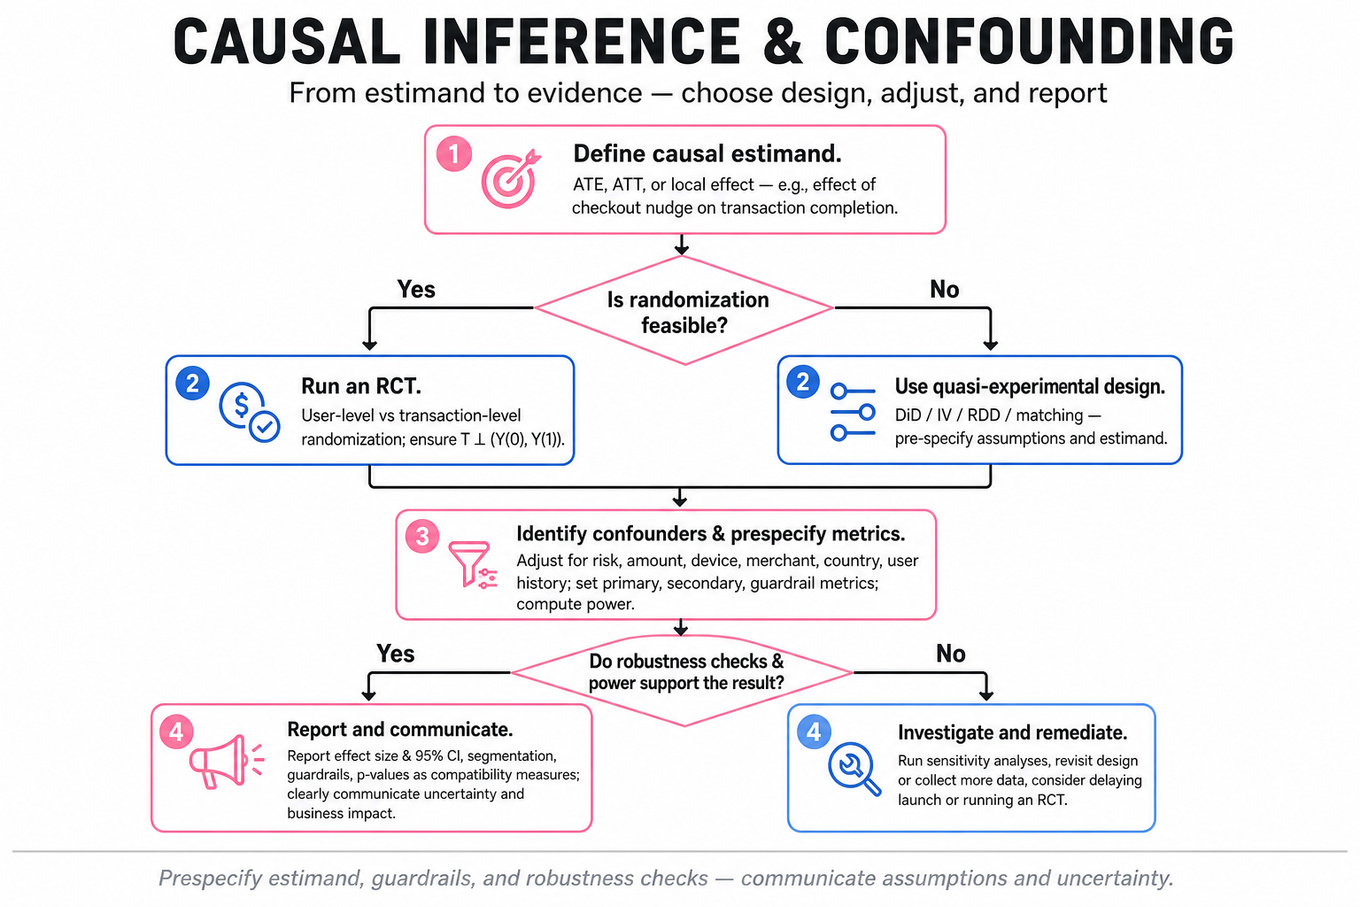
What's being tested
Interviewers are probing whether you can separate correlation from causation when product, marketplace, and risk metrics move together. For a PayPal Data Scientist, this matters because changes to checkout flows, fraud controls, merchant policies, incentives, or customer support interventions can appear beneficial while actually reflecting selection bias, seasonality, or user mix changes. You need to define a causal estimand, choose an experiment or quasi-experimental design, identify confounders, interpret statistical evidence, and communicate uncertainty clearly. The strongest answers combine rigorous inference with practical metric thinking: primary outcome, guardrails, segmentation, power, and threats to validity.
Core knowledge
-
Causal estimand comes before method choice. State whether you want ATE, ATT, or a local effect: For PayPal, that could be “effect of a checkout nudge on transaction completion” versus “effect among users who actually saw the nudge.”
-
Confounding occurs when a variable affects both treatment assignment and outcome. If high-risk transactions receive extra verification and also have lower completion, the raw association between verification and completion is biased unless you adjust for risk, amount, device, merchant, country, and user history.
-
Randomized controlled trials are the cleanest design when feasible because treatment is independent of potential outcomes: . Use user-level randomization for persistent product changes, transaction-level randomization only if repeated exposure or learning effects are not major concerns.
-
Primary, secondary, and guardrail metrics prevent cherry-picking. A checkout experiment might use
payment_success_rateas primary,TPVandrevenue_per_useras secondary, andfraud_loss_rate,chargeback_rate,latency_ms, and support contacts as guardrails. -
P-values measure compatibility with the null, not business importance. A p-value of 0.03 means that, assuming no true effect and valid assumptions, results at least this extreme occur about 3% of the time. It does not mean a 97% probability the treatment works.
-
Type I and Type II errors map to launch risk. Type I error is falsely shipping a harmful or useless change; Type II error is missing a real improvement. Power is , commonly targeted at 80% or 90%, but practical significance and guardrail risk matter too.
-
Omitted variable bias in regression is directional when an omitted factor affects both treatment and outcome. In a simple model , excluding biases if and .
-
Regression adjustment can reduce variance and handle observed imbalance, but it does not magically create causality. In observational data, controls must be pre-treatment variables; controlling for mediators, colliders, or post-treatment behavior can introduce bias.
-
Propensity score methods estimate to balance observed covariates. Matching or inverse probability weighting can work well with rich pre-treatment data, but breaks down under unobserved confounding or poor overlap where treated users have no comparable controls.
-
Difference-in-differences compares treated and control groups before and after an intervention: The key assumption is parallel trends; always inspect pre-period trends and seasonality.
-
Interference violates SUTVA when one unit’s treatment affects another unit’s outcome. Marketplace settings are especially vulnerable: changing queue rules, incentives, or risk throttles for one group can affect wait times, prices, fraud pressure, or availability for others.
-
Simpson’s Paradox appears when aggregate effects reverse within segments. A payment method may seem to reduce success overall because it is overrepresented in high-risk countries, while within each country it improves success. Always segment by major assignment and outcome drivers.
Tip: In causal interviews, say the estimand, assignment mechanism, assumptions, metrics, and validity threats before discussing model details.
Worked example
For “Design causal study for airport cancellation reduction,” a strong candidate would first clarify the intervention, unit of analysis, and outcome: are we changing incentives, pickup instructions, matching logic, or messaging, and is cancellation measured per request, rider, driver, or airport queue session? They would define a primary metric such as cancellation_rate within a fixed pickup window, with guardrails like ETA, driver_utilization, rider_wait_time, completed_trips, and complaint rate. The first pillar would be causal design: prefer an RCT if operationally feasible, randomizing at a level that avoids spillovers, such as airport-time blocks or driver cohorts rather than individual riders if queue dynamics create interference. The second pillar would be measurement: establish eligibility, exposure logging, pre-treatment covariates, and consistent definitions for rider-cancel versus driver-cancel. The third pillar would be inference: power the test for a minimum detectable effect, use clustered standard errors if randomization is by airport or time block, and analyze heterogeneous effects by terminal, time of day, flight delay status, and demand-supply imbalance. The fourth pillar would be causal threats: spillovers, seasonality, special events, queue rebalancing, and changes in driver behavior after learning the treatment. A key tradeoff is internal validity versus operational feasibility: individual-level randomization gives more power but may contaminate the queue, while cluster randomization reduces interference but needs larger sample size. They would close by saying that, if more time were available, they would validate mechanisms using leading indicators like driver_arrival_rate, pickup_match_time, and rider message engagement.
A second angle
For “Explain confounding with an Uber example,” the same causal logic applies, but the task is more diagnostic than design-heavy. A tempting claim might be “surge pricing causes cancellations because trips with surge have higher cancellation rates.” A strong answer would identify demand spikes, bad weather, long pickup times, airport congestion, and driver scarcity as confounders because they influence both surge exposure and cancellation probability. The candidate should explain that controlling for pre-treatment context or using an experiment is necessary before attributing the effect to surge itself. The framing difference is that this question tests whether you can recognize biased observational comparisons, not whether you can fully operationalize an experiment.
Common pitfalls
Pitfall: Treating regression coefficients as automatically causal.
A wrong-but-tempting answer is “I’ll regress cancellation on treatment and controls, then interpret the treatment coefficient as impact.” A better answer states the identifying assumption: after conditioning on pre-treatment covariates, treatment assignment is as-good-as-random, then discusses what unobserved factors could still violate that assumption.
Pitfall: Explaining p-values in stakeholder-hostile language.
Saying “p < 0.05 proves the feature works” is both statistically wrong and risky for launch decisions. Say instead: “The observed lift is unlikely under the null given our design assumptions, but I’d also check effect size, confidence interval, guardrails, multiple testing, and practical significance.”
Pitfall: Ignoring interference in marketplace or networked settings.
Randomizing individual users sounds clean, but it can fail when treatment changes shared resources like queue length, driver availability, fraud review capacity, or merchant routing. Mention cluster randomization, switchback tests, or saturation designs when one user’s treatment can affect another user’s outcome.
Connections
Interviewers may pivot from here into A/B testing, power analysis, metric design, regression interpretation, heterogeneous treatment effects, or quasi-experimental methods such as difference-in-differences and instrumental variables. They may also test whether you can connect causal inference to business decisions: launch, rollback, segment-specific rollout, or further experimentation.
Further reading
-
Trustworthy Online Controlled Experiments — Practical reference by Kohavi, Tang, and Xu on experimentation design, metrics, and interpretation.
-
Causal Inference: The Mixtape — Accessible treatment of experiments, difference-in-differences, regression discontinuity, and instrumental variables.
-
Mostly Harmless Econometrics — Deeper econometric grounding for identification assumptions and quasi-experimental designs.
Featured in interview prep guides
Practice questions
- Explain confounding with an Uber examplePayPal · Data Scientist · Onsite · easy
- Reduce airport ride cancellations under causal constraintsPayPal · Data Scientist · Onsite · easy
- Explain p-values and interpret regressionsPayPal · Data Scientist · Onsite · easy
- Diagnose drop in shopper order acceptancePayPal · Data Scientist · Onsite · easy
- Explain P-Value and Errors in A/B TestingPayPal · Data Scientist · Onsite · medium
Related concepts
- Causal Inference, Confounding, And MatchingAnalytics & Experimentation
- Causal InferenceAnalytics & Experimentation
- Causal Inference And IdentificationStatistics & Math
- Causal Inference And Quasi-ExperimentsAnalytics & Experimentation
- Causal Inference, Difference-In-Differences, And Cannibalization
- Causal Inference And Difference-In-DifferencesAnalytics & Experimentation