PayPal Data Scientist Interview Prep Guide
Everything PayPal actually asks Data Scientist candidates — concept walkthroughs, worked examples, and the real interview questions, drawn from candidate reports. Free to read.
Last updated
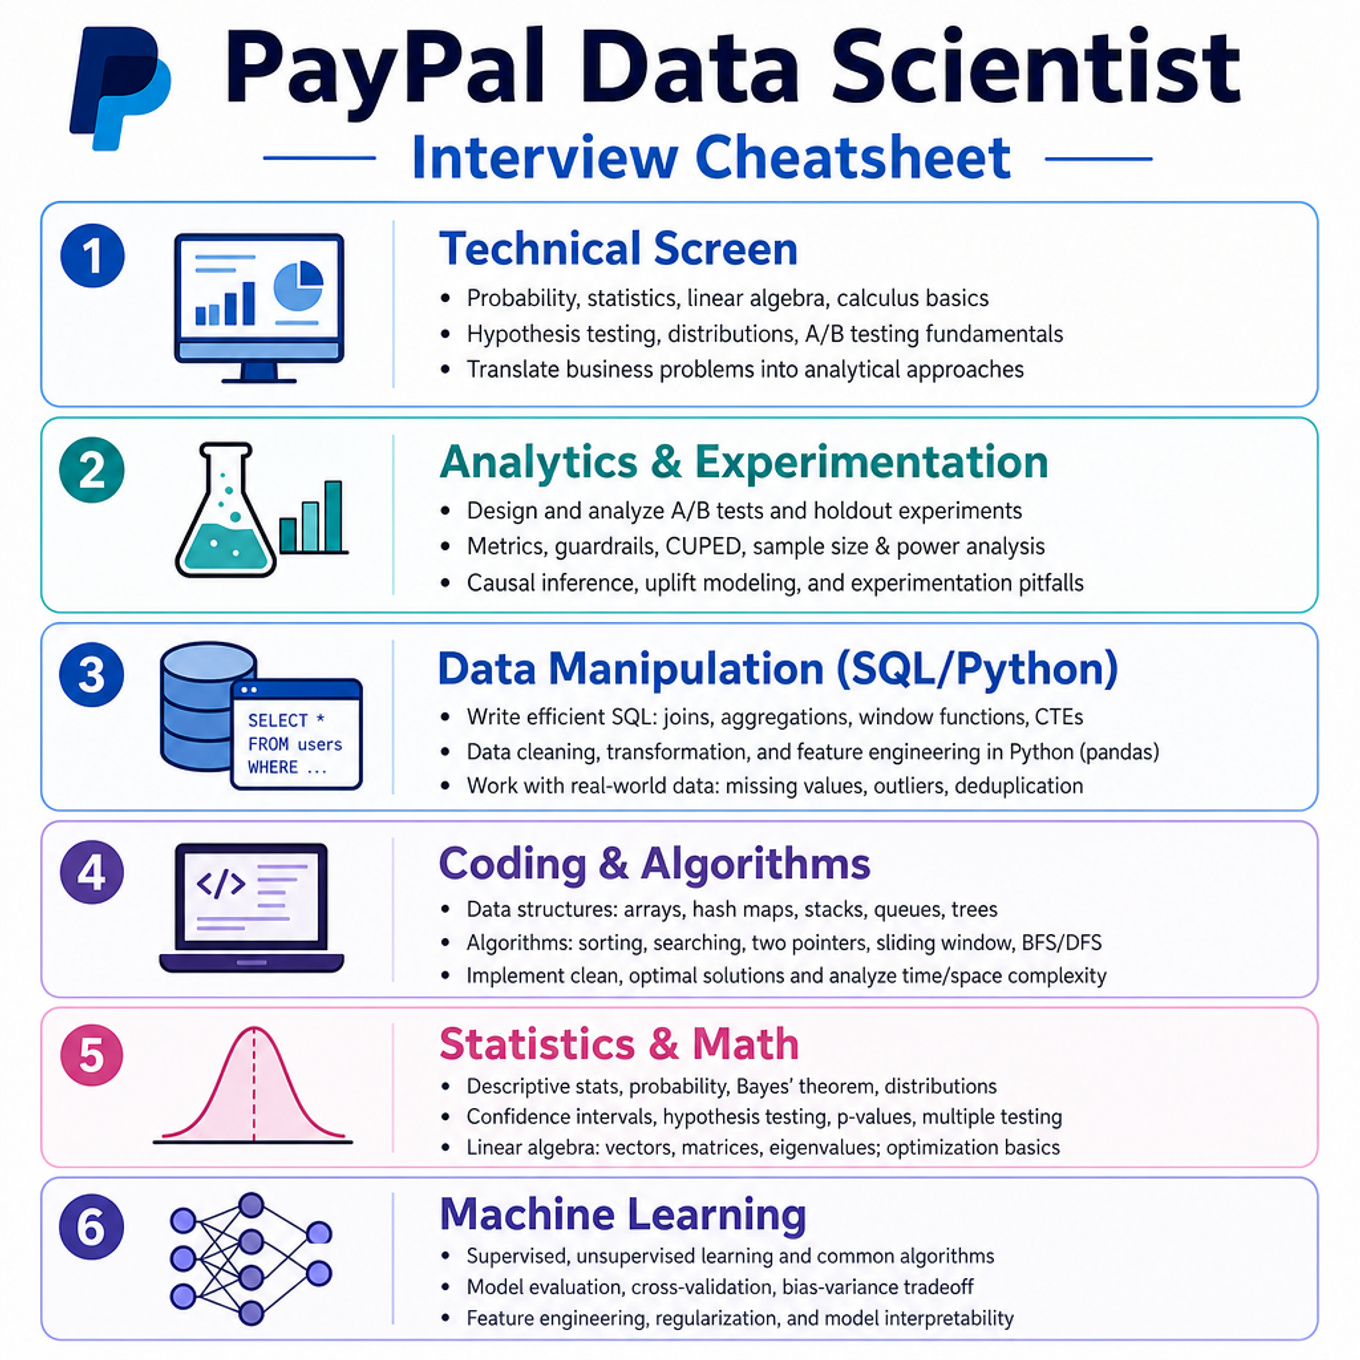
Technical Screen
Analytics & Experimentation
-
A/B Testing And Experiment Design — covered in depth under Onsite below.
-
Product Metrics, Funnels, And KPI Diagnosis — covered in depth under Onsite below.
Data Manipulation (SQL/Python)
- SQL Window Functions And Temporal Joins — covered in depth under Onsite below.
Coding & Algorithms
- Python Data Manipulation And Core Coding — covered in depth under Onsite below.
Statistics & Math
- Cost-Sensitive Threshold Optimization — covered in depth under Onsite below.
Machine Learning
- Account Takeover ATO Detection — covered in depth under Onsite below.
Behavioral & Leadership
- Behavioral Leadership And Stakeholder Communication — covered in depth under Onsite below.
Onsite
Analytics & Experimentation
What's being tested
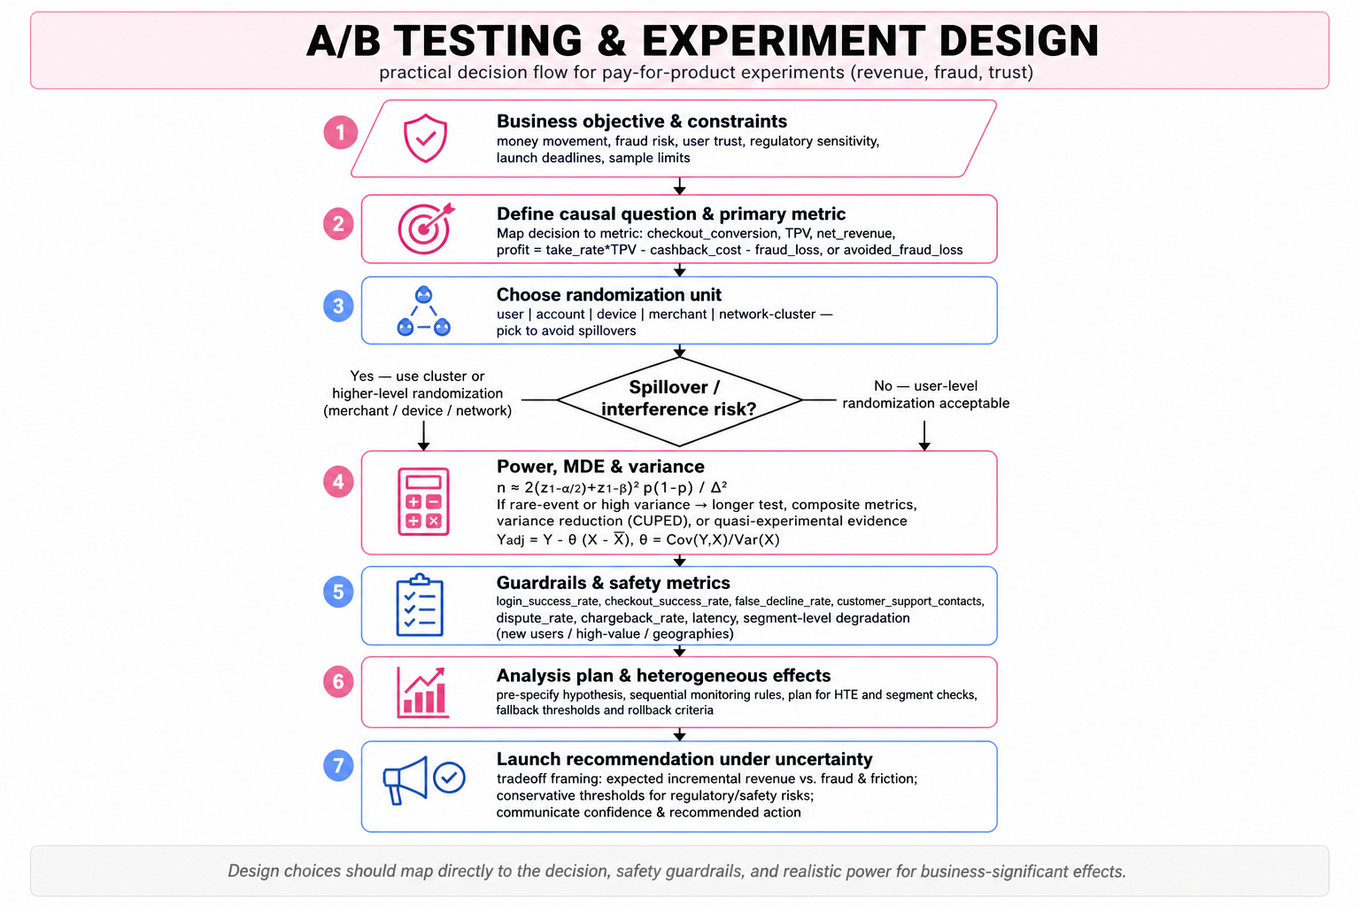
PayPal is testing whether you can design, diagnose, and communicate online experiments where the business outcome is not just clicks, but money movement, fraud risk, user trust, and regulatory sensitivity. A strong Data Scientist should define the causal question, choose the right randomization unit, select primary and guardrail metrics, estimate power, analyze heterogeneous effects, and make a launch recommendation under uncertainty. Interviewers are probing whether you can move beyond “compare treatment vs. control p-value” into real product experimentation: interference, rare-event metrics, sequential monitoring, noisy revenue outcomes, and stakeholder-ready tradeoff framing. For PayPal specifically, experiment mistakes can mean lost checkout conversion, increased account-takeover exposure, false declines, promotional overspend, or biased treatment of customer segments.
Core knowledge
-
Randomization unit is often the most important design choice. For checkout cashback, user-level randomization may work; for an
ATOrule, account-, device-, merchant-, or network-cluster randomization may be needed to avoid spillovers where fraudsters adapt across accounts or merchants. -
Primary metric should map to the decision. For cashback, candidates might choose incremental
checkout_conversion,TPV,net_revenue, orprofit = take_rate * TPV - cashback_cost - fraud_loss. For anATOrule, use avoided fraud loss or confirmed takeover rate, but include false-positive friction. -
Guardrail metrics protect against local optimization. At PayPal, likely guardrails include
login_success_rate,checkout_success_rate,false_decline_rate,customer_support_contacts,dispute_rate,chargeback_rate,latency, and segment-level degradation for new users, high-value users, or specific geographies. -
Power and minimum detectable effect connect statistics to business stakes. For a two-sample proportion test, an approximation is:
where is the absolute detectable lift. For rare fraud outcomes, required sample size can become impractically large, pushing you toward longer tests, composite metrics, variance reduction, or quasi-experimental evidence. -
Variance reduction can materially improve sensitivity. CUPED uses pre-period behavior as a covariate:
This works well for stable user-level metrics like historicalTPV, prior checkout activity, or baseline fraud-risk score, but less well for brand-new users. -
Sequential monitoring must be planned before launch. Repeatedly checking p-values inflates Type I error. Use pre-specified looks with alpha spending, group sequential testing, or a Bayesian decision framework; do not say “we will stop when p < 0.05” unless you explicitly control false positives.
-
Sample ratio mismatch is a mandatory integrity check. If the intended split is 50/50, test observed assignment counts using a chi-square test before interpreting outcomes. SRM can indicate assignment bugs, eligibility drift, bot filtering asymmetry, or post-treatment exclusion bias.
-
Intent-to-treat analysis preserves causal validity. Analyze users based on assigned variant, not only those who saw or used the feature. A “cashback exposed users only” analysis can be biased because exposure is often affected by treatment, checkout behavior, device, or merchant routing.
-
Treatment effect estimation should include uncertainty and business magnitude. Report absolute lift, relative lift, confidence interval, p-value or posterior probability, and translated dollars. “Conversion increased 0.12 pp” is weaker than “+0.4M, $3.2M], with no guardrail breach.”
-
Heterogeneous treatment effects matter, but subgroup analysis is dangerous if unplanned. Segment by risk score, tenure, geography, platform, merchant category, transaction size, or new vs. returning users, but control multiple comparisons using Benjamini-Hochberg, Bonferroni, hierarchical modeling, or treat segments as directional unless pre-registered.
-
Interference and network effects are common in payments. Merchant-level promotions can affect both treatment and control users through shared checkout pages; fraud rules can change attacker behavior across accounts. If SUTVA is violated, consider cluster randomization, geo-level rollout, switchback designs, or difference-in-differences.
-
Decision quality is not identical to statistical significance. A small p-value on gross conversion may still be a bad launch if cashback cost exceeds margin. Conversely, a non-significant but directionally strong fraud reduction with low downside may justify a ramp, especially if the cost of waiting is high and guardrails are clean.
Worked example
For “Design an A/B for ATO rule”, start by clarifying what the new rule does: does it block logins, step up authentication, hold transactions, or only add risk scoring? Then define the causal estimand: the effect of enabling the rule on confirmed account-takeover losses, customer friction, and net business value among eligible traffic. A strong answer would organize around four pillars: randomization, metrics, power, and monitoring. For randomization, you would flag that user-level randomization may be insufficient if fraudsters reuse devices, IPs, funding instruments, or merchants; a cluster-aware design by risk cluster, device graph, or merchant/account family may better prevent contamination. For metrics, use a primary value metric such as net avoided loss minus friction cost, with guardrails like login_success_rate, checkout_conversion, false_positive_rate, and support contacts. For power, explain that confirmed ATO is rare and delayed, so you may need a longer test, a high-risk eligible population, variance reduction using pre-period risk scores, or proxy metrics like step-up challenge success while still validating against confirmed loss. A key tradeoff is safety versus statistical purity: if the rule likely prevents severe fraud, you may not want a 50/50 global holdout; instead, use a smaller control, high-risk ramp, or sequential design with pre-defined stopping rules. Close by saying that if you had more time, you would add segment-level fairness checks, delayed outcome windows for disputes, and sensitivity analysis for underreported fraud labels.
A second angle
For “Design and Analyze A/B Test for Cashback Program”, the same experimental discipline applies, but the dominant risks shift from security harm to promotional incrementality and margin. Randomization is more likely to be user-level or session-level, but you must prevent contamination from users seeing the offer on one device and converting on another. The primary metric should not be raw conversion alone; it should account for incremental TPV, PayPal take rate, cashback expense, and possible cannibalization of transactions that would have happened anyway. Analysis should separate short-term checkout lift from longer-term retention, repeat purchase, and reward liability. Unlike an ATO rule, where rare labels and safety dominate, cashback experiments often hinge on unit economics, heterogeneous response by user value, and whether lift persists after the promotion ends.
Common pitfalls
Pitfall: Treating every experiment as a simple 50/50 user-level test.
This misses interference, delayed outcomes, and operational risk. A better answer explicitly asks whether users, devices, merchants, or fraud networks can affect each other, then chooses the randomization unit and analysis standard errors accordingly.
Pitfall: Optimizing for a single attractive metric like
checkout_conversion.
At PayPal, conversion gains can be bought with excessive cashback, higher fraud loss, or worse customer trust. Strong candidates define a decision metric and guardrails together, then translate the observed effect into expected net dollars and risk.
Pitfall: Over-communicating statistical mechanics and under-communicating the recommendation.
Interviewers want rigor, but they also want a launch decision. Do not stop at “p = 0.03”; say whether you would launch, ramp, iterate, or hold, and explain the confidence interval, downside risk, and unresolved checks.
Connections
Interviewers may pivot from this topic into causal inference, especially difference-in-differences, matching, inverse propensity weighting, or synthetic controls when randomization is infeasible. They may also probe metric design, fraud/risk model evaluation, uplift modeling, or experimentation platforms from an analyst’s perspective: assignment integrity, exposure logging, variance reduction, and decision governance.
Further reading
-
Trustworthy Online Controlled Experiments by Kohavi, Tang, and Xu — Practical reference for experiment design, pitfalls, metrics, and online decision-making.
-
Controlled Experiments on the Web: Survey and Practical Guide by Kohavi, Henne, and Sommerfield — Classic paper covering randomization, validity threats, and web-scale experimentation.
-
CUPED: Controlled-experiment Using Pre-experiment Data by Deng, Xu, Kohavi, and Walker — Seminal variance-reduction method widely used in online experiments.
Practice questions

What's being tested
Interviewers are testing whether you can translate an ambiguous product problem into a metric framework, diagnose movement in a funnel, and design an experiment that supports causal decisions. For PayPal, this matters because small changes in login, checkout, contact discovery, crypto trading, or donation flows can affect conversion, risk, compliance, revenue, and customer trust at massive scale. A strong Data Scientist should define precise numerators and denominators, separate leading indicators from business outcomes, segment intelligently, and explain whether an observed metric change is caused by the product or by mix shift, seasonality, risk policy, or measurement artifacts. The interviewer is probing for analytical judgment: not just “what metric would you track,” but “how would you know if the feature truly helped and did not create hidden harm?”
Core knowledge
-
North Star metrics should reflect durable product value, not just activity. For a
PayPalcrypto feature,crypto_trade_completed_rateornet_revenue_per_eligible_usermay matter, but guardrails likechargeback_rate,complaint_rate,fraud_loss_rate, andregulatory_review_rateare equally important. -
Funnel analysis starts by defining mutually exclusive stages and denominators: exposure → click → start → submit → success → retained use. For login, use stages like
login_page_view,credential_submit,MFA_challenge,MFA_success,risk_step_up, andauthenticated_session_created. -
Conversion rate must be tied to a population: Avoid mixing session-level and user-level denominators unless intentional; session metrics overweight high-frequency users and can hide user-level harm.
-
KPI trees separate input, output, and guardrail metrics. Example:
login_success_ratemay decompose intocredential_success_rate,MFA_completion_rate,risk_decline_rate, latency, device mix, app version, and geography. This structure helps diagnose where a top-line KPI moved. -
Segmentation should be hypothesis-driven, not a fishing expedition. Useful cuts at
PayPalinclude new vs returning users, consumer vs merchant, account tenure, country, payment method, device, app version, risk tier, KYC status, and prior failed-login history. -
Cohort analysis distinguishes acquisition effects from retention effects. For contact syncing, track cohorts by first sync date and measure downstream outcomes such as
friends_found_per_syncer,P2P_send_rate_7d,invites_sent,invite_accept_rate, and incremental retained transactors. -
Experiment design requires a clear unit of randomization. Use user-level randomization for persistent features like contact syncing or crypto education; session-level randomization can cause interference if the same user sees inconsistent login or checkout experiences across visits.
-
A/B test readouts should include effect size, confidence interval, and practical significance, not just p-values. For difference in proportions, a simple estimate is with uncertainty driven by group sizes and baseline rates.
-
Power analysis links minimum detectable effect to sample size. Rare outcomes like crypto fraud losses or donation chargebacks may require long tests, pooled guardrail monitoring, or proxy metrics; do not overclaim from underpowered safety metrics.
-
Causal inference matters when randomization is unavailable. For a post-launch diagnosis, consider difference-in-differences, matched cohorts, regression adjustment, synthetic control, or interrupted time series, while explicitly checking parallel trends, selection bias, and concurrent launches.
-
Metric diagnosis should distinguish real product movement from measurement or mix issues. Ask whether event definitions changed, eligibility changed, traffic source shifted, app versions rolled out unevenly, risk rules changed, marketing campaigns launched, or outages affected a subset of users.
-
Guardrail metrics prevent local optimization. Improving
login_success_rateby weakening MFA may increase fraud; boosting donation attachment rate by aggressive prompts may reduce order completion. Always pair a primary metric with user experience, risk, revenue, and operational guardrails.
Worked example
For “Analyze Success Metrics and Diagnose Crypto Feature Issues,” a strong candidate would start by clarifying the product surface: “Is this buy/sell crypto, crypto checkout, wallet holding, or educational onboarding? Is the issue low adoption, failed trades, churn, complaints, or financial loss?” They would also ask whether the feature is fully launched or still in experiment, and whether the target population is all PayPal users or only eligible, KYC-approved users in supported jurisdictions.
The answer should be organized around four pillars: first, define success metrics such as eligible_user_activation_rate, crypto_trade_completion_rate, repeat_trade_rate_30d, spread or fee revenue, and customer support contacts. Second, define funnel stages from eligibility → impression → entry point click → quote viewed → order submitted → trade completed → repeat use. Third, diagnose by segmenting across country, KYC status, funding source, app version, risk tier, price volatility period, and new vs existing crypto users. Fourth, propose causal evaluation: if launched through an experiment, compare treatment and control on activation, revenue, and guardrails; if already launched, use pre/post with matched controls or difference-in-differences.
A key tradeoff to flag is that maximizing trading volume is not necessarily the right objective because crypto products have risk, compliance, volatility, and trust implications. A candidate should explicitly say they would not declare success if trade_volume rose while complaints, failed withdrawals, fraud flags, or account limitations also rose. They should close with: “If I had more time, I would build a KPI tree and a diagnostic dashboard showing where conversion drops, then validate the biggest drop-off with cohort and causal analysis before recommending product changes.”
A second angle
For “Boost User Login Rate: Key Metrics to Monitor,” the same metric-diagnosis skill applies, but the constraints are different because login is a security-sensitive access funnel rather than a growth or monetization feature. The primary metric might be successful_login_rate among legitimate users, but the denominator must exclude bot traffic or clearly separate human-initiated attempts from suspicious attempts. The funnel should isolate credentials, MFA, risk-based step-up, password reset, device recognition, and session creation. The key tension is between reducing friction and preserving account safety: a login change that improves success rate but increases account takeover is a bad launch. Compared with crypto, the diagnosis leans more heavily on risk-tier segmentation, device and browser cuts, latency, and policy interactions.
Common pitfalls
Pitfall: Treating one metric as sufficient.
A tempting answer is “track conversion rate” or “track login success rate” and stop there. That is too shallow for PayPal-scale products because a primary KPI can improve while fraud, complaints, churn, revenue quality, or user trust worsens. A better answer names a primary metric, secondary diagnostics, and guardrails with exact denominators.
Pitfall: Confusing correlation with causation.
For a post-launch crypto issue, candidates often say “crypto volume dropped after launch, so the feature failed.” A stronger answer asks what else changed: market prices, eligibility rules, app version rollout, KYC approval rates, risk policies, or marketing spend. If there was no randomized holdout, propose quasi-experimental methods and state assumptions instead of pretending the pre/post change is causal.
Pitfall: Over-segmenting without a hypothesis.
Segmentation is necessary, but listing twenty cuts without a plan sounds unfocused. Start with the KPI tree, identify the funnel stage that moved, then segment based on likely mechanisms: app version for UI bugs, country for regulatory or localization issues, risk tier for authentication friction, and tenure for new-user comprehension.
Connections
Interviewers may pivot from this topic into A/B testing, sample size and power, causal inference, retention analysis, or risk-aware experimentation. They may also ask you to write SQL for a funnel or explain how you would validate metric quality, but as a Data Scientist your emphasis should remain on definitions, inference, diagnosis, and decision-making.
Further reading
-
Trustworthy Online Controlled Experiments by Kohavi, Tang, and Xu — Practical reference for experiment design, guardrails, novelty effects, and decision quality.
-
Causal Inference: The Mixtape by Scott Cunningham — Useful grounding for difference-in-differences, matching, regression, and causal assumptions.
-
Lean Analytics by Croll and Yoskovitz — Good product-metric framing, especially choosing stage-appropriate KPIs and avoiding vanity metrics.
Practice questions
Statistics & Math
What's being tested
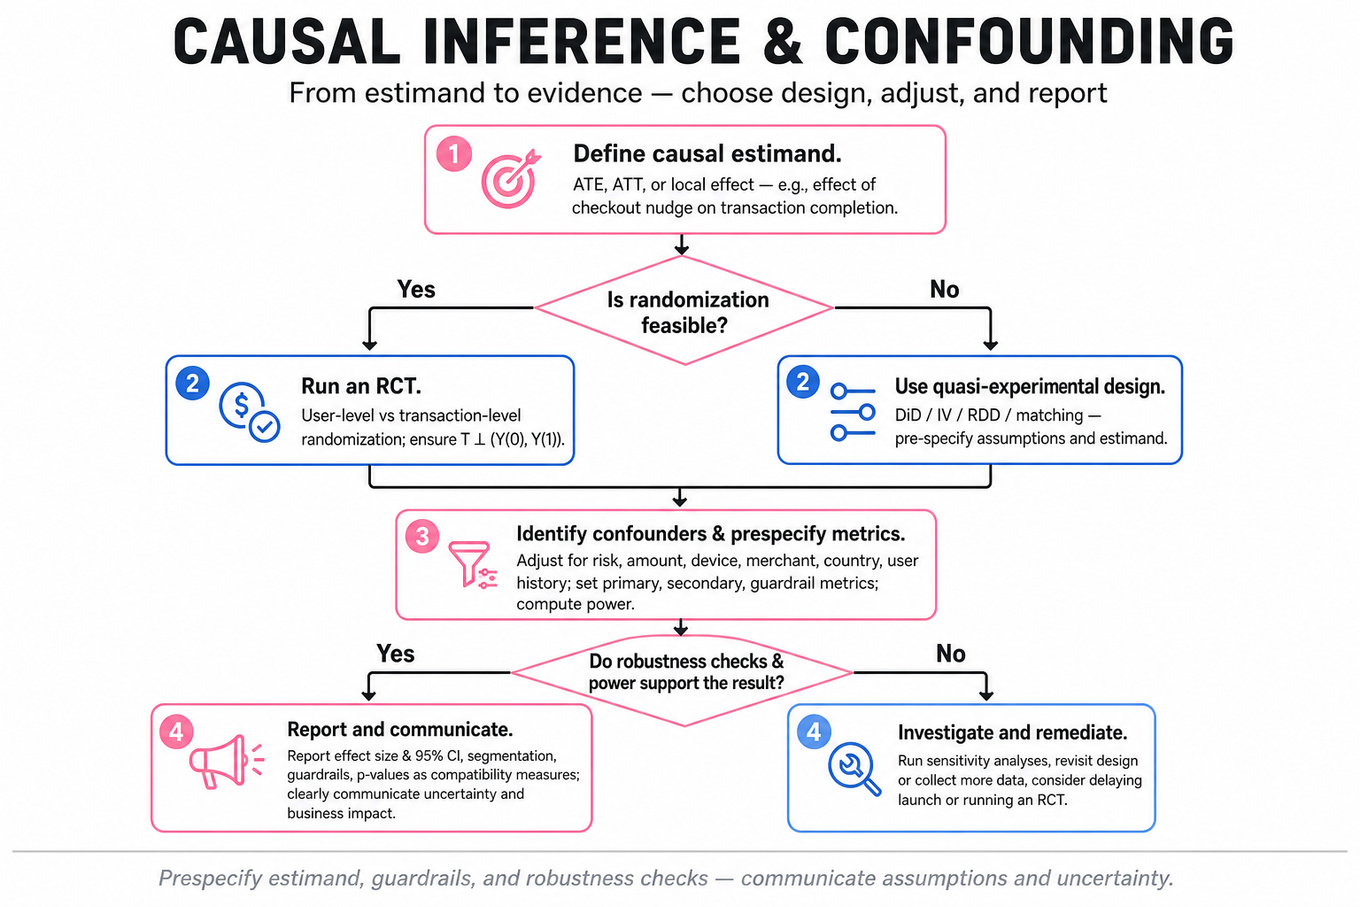
Interviewers are probing whether you can separate correlation from causation when product, marketplace, and risk metrics move together. For a PayPal Data Scientist, this matters because changes to checkout flows, fraud controls, merchant policies, incentives, or customer support interventions can appear beneficial while actually reflecting selection bias, seasonality, or user mix changes. You need to define a causal estimand, choose an experiment or quasi-experimental design, identify confounders, interpret statistical evidence, and communicate uncertainty clearly. The strongest answers combine rigorous inference with practical metric thinking: primary outcome, guardrails, segmentation, power, and threats to validity.
Core knowledge
-
Causal estimand comes before method choice. State whether you want ATE, ATT, or a local effect: For PayPal, that could be “effect of a checkout nudge on transaction completion” versus “effect among users who actually saw the nudge.”
-
Confounding occurs when a variable affects both treatment assignment and outcome. If high-risk transactions receive extra verification and also have lower completion, the raw association between verification and completion is biased unless you adjust for risk, amount, device, merchant, country, and user history.
-
Randomized controlled trials are the cleanest design when feasible because treatment is independent of potential outcomes: . Use user-level randomization for persistent product changes, transaction-level randomization only if repeated exposure or learning effects are not major concerns.
-
Primary, secondary, and guardrail metrics prevent cherry-picking. A checkout experiment might use
payment_success_rateas primary,TPVandrevenue_per_useras secondary, andfraud_loss_rate,chargeback_rate,latency_ms, and support contacts as guardrails. -
P-values measure compatibility with the null, not business importance. A p-value of 0.03 means that, assuming no true effect and valid assumptions, results at least this extreme occur about 3% of the time. It does not mean a 97% probability the treatment works.
-
Type I and Type II errors map to launch risk. Type I error is falsely shipping a harmful or useless change; Type II error is missing a real improvement. Power is , commonly targeted at 80% or 90%, but practical significance and guardrail risk matter too.
-
Omitted variable bias in regression is directional when an omitted factor affects both treatment and outcome. In a simple model , excluding biases if and .
-
Regression adjustment can reduce variance and handle observed imbalance, but it does not magically create causality. In observational data, controls must be pre-treatment variables; controlling for mediators, colliders, or post-treatment behavior can introduce bias.
-
Propensity score methods estimate to balance observed covariates. Matching or inverse probability weighting can work well with rich pre-treatment data, but breaks down under unobserved confounding or poor overlap where treated users have no comparable controls.
-
Difference-in-differences compares treated and control groups before and after an intervention: The key assumption is parallel trends; always inspect pre-period trends and seasonality.
-
Interference violates SUTVA when one unit’s treatment affects another unit’s outcome. Marketplace settings are especially vulnerable: changing queue rules, incentives, or risk throttles for one group can affect wait times, prices, fraud pressure, or availability for others.
-
Simpson’s Paradox appears when aggregate effects reverse within segments. A payment method may seem to reduce success overall because it is overrepresented in high-risk countries, while within each country it improves success. Always segment by major assignment and outcome drivers.
Tip: In causal interviews, say the estimand, assignment mechanism, assumptions, metrics, and validity threats before discussing model details.
Worked example
For “Design causal study for airport cancellation reduction,” a strong candidate would first clarify the intervention, unit of analysis, and outcome: are we changing incentives, pickup instructions, matching logic, or messaging, and is cancellation measured per request, rider, driver, or airport queue session? They would define a primary metric such as cancellation_rate within a fixed pickup window, with guardrails like ETA, driver_utilization, rider_wait_time, completed_trips, and complaint rate. The first pillar would be causal design: prefer an RCT if operationally feasible, randomizing at a level that avoids spillovers, such as airport-time blocks or driver cohorts rather than individual riders if queue dynamics create interference. The second pillar would be measurement: establish eligibility, exposure logging, pre-treatment covariates, and consistent definitions for rider-cancel versus driver-cancel. The third pillar would be inference: power the test for a minimum detectable effect, use clustered standard errors if randomization is by airport or time block, and analyze heterogeneous effects by terminal, time of day, flight delay status, and demand-supply imbalance. The fourth pillar would be causal threats: spillovers, seasonality, special events, queue rebalancing, and changes in driver behavior after learning the treatment. A key tradeoff is internal validity versus operational feasibility: individual-level randomization gives more power but may contaminate the queue, while cluster randomization reduces interference but needs larger sample size. They would close by saying that, if more time were available, they would validate mechanisms using leading indicators like driver_arrival_rate, pickup_match_time, and rider message engagement.
A second angle
For “Explain confounding with an Uber example,” the same causal logic applies, but the task is more diagnostic than design-heavy. A tempting claim might be “surge pricing causes cancellations because trips with surge have higher cancellation rates.” A strong answer would identify demand spikes, bad weather, long pickup times, airport congestion, and driver scarcity as confounders because they influence both surge exposure and cancellation probability. The candidate should explain that controlling for pre-treatment context or using an experiment is necessary before attributing the effect to surge itself. The framing difference is that this question tests whether you can recognize biased observational comparisons, not whether you can fully operationalize an experiment.
Common pitfalls
Pitfall: Treating regression coefficients as automatically causal.
A wrong-but-tempting answer is “I’ll regress cancellation on treatment and controls, then interpret the treatment coefficient as impact.” A better answer states the identifying assumption: after conditioning on pre-treatment covariates, treatment assignment is as-good-as-random, then discusses what unobserved factors could still violate that assumption.
Pitfall: Explaining p-values in stakeholder-hostile language.
Saying “p < 0.05 proves the feature works” is both statistically wrong and risky for launch decisions. Say instead: “The observed lift is unlikely under the null given our design assumptions, but I’d also check effect size, confidence interval, guardrails, multiple testing, and practical significance.”
Pitfall: Ignoring interference in marketplace or networked settings.
Randomizing individual users sounds clean, but it can fail when treatment changes shared resources like queue length, driver availability, fraud review capacity, or merchant routing. Mention cluster randomization, switchback tests, or saturation designs when one user’s treatment can affect another user’s outcome.
Connections
Interviewers may pivot from here into A/B testing, power analysis, metric design, regression interpretation, heterogeneous treatment effects, or quasi-experimental methods such as difference-in-differences and instrumental variables. They may also test whether you can connect causal inference to business decisions: launch, rollback, segment-specific rollout, or further experimentation.
Further reading
-
Trustworthy Online Controlled Experiments — Practical reference by Kohavi, Tang, and Xu on experimentation design, metrics, and interpretation.
-
Causal Inference: The Mixtape — Accessible treatment of experiments, difference-in-differences, regression discontinuity, and instrumental variables.
-
Mostly Harmless Econometrics — Deeper econometric grounding for identification assumptions and quasi-experimental designs.
Practice questions

What's being tested
Interviewers are probing whether you can turn a fraud model score into an economically rational decision, not just report AUC. At PayPal, false positives block legitimate customers and merchants, while false negatives create chargebacks, losses, and regulatory exposure, so the right operating point depends on costs, prevalence, capacity, and customer impact. A strong Data Scientist should be able to compare thresholds using expected value, reason about ROC/PR tradeoffs, segment risk populations, handle delayed or biased labels, and explain how the decision would be monitored after launch. The goal is not to design payment infrastructure; it is to define the analytical framework for approving, declining, reviewing, or stepping up transactions under business constraints.
Core knowledge
-
Cost-sensitive classification chooses actions by minimizing expected loss, not classification error. For a binary fraud score , decline when expected fraud loss exceeds expected false-positive cost: decline if , so the threshold is under calibrated probabilities.
-
Threshold optimization should be done on an out-of-time validation set whenever possible, because fraud patterns drift and random splits can leak future behavior. For each candidate threshold, compute
TP,FP,TN,FN, fraud dollars caught, good payment volume blocked, customer complaints, and manual review load. -
Expected cost is usually more useful than accuracy:
Often , while may include friction, investigation cost, or incentive abuse recovery. -
Calibration matters when using model scores as probabilities. A model with strong
AUCcan still produce poorly calibrated scores; use reliability plots,Brier score, Platt scaling, or isotonic regression before applying probability-based cost thresholds. -
ROC curves plot
TPRversusFPRand are useful for comparing ranking quality across thresholds. In rare-fraud settings, precision-recall curves are often more operationally meaningful because even a smallFPRcan create many false positives when legitimate transactions dominate. -
Prevalence changes predictive values. Precision is
where is fraud prevalence. If fraud prevalence doubles during an attack, the same threshold can suddenly become much more precise and economically attractive. -
Segmentation often beats one global threshold. Card-not-present payments, new accounts, high-risk merchants, cross-border transactions, and unusual device fingerprints may require separate operating points because both fraud prevalence and false-positive costs differ by segment.
-
Constrained optimization appears when manual review teams or step-up verification have limited capacity. Instead of “decline if score > t,” rank transactions by expected marginal benefit, such as , and select the top transactions that fit review capacity.
-
Decision actions are not always binary. A
PayPalrisk strategy may include approve, decline, hold funds, request identity verification, require3DS, route to manual review, or apply merchant-specific limits. Each action has a different cost matrix and customer-experience impact. -
Delayed labels are central in fraud. Chargebacks, disputes, and confirmed fraud labels may arrive days or weeks later, while non-fraud labels are often inferred from no adverse event after a maturity window. Evaluate thresholds using mature cohorts, and be explicit about label lag.
-
Selection bias occurs because declined transactions do not reveal whether they would have become fraud. If the historical policy blocked high-risk traffic, training and evaluation labels are censored. Mitigations include randomized exploration on low-risk margins, inverse propensity weighting, reject inference, or evaluating on policy-stable segments.
-
Monitoring should include both model and business metrics:
AUC,PR-AUC, calibration, fraud loss rate, chargeback rate, approval rate, false-positive rate, manual review precision, customer contact rate, and merchant-level impact. Watch for adversarial adaptation, seasonality, product launches, and sudden mix shifts.
Worked example
For “Optimize thresholds under fraud costs,” a strong candidate would start by clarifying the unit of decision: transaction-level authorization, account-level restriction, or merchant-level action. They would ask for the fraud prevalence, average fraud loss, cost of blocking a good transaction, available model outputs, whether scores are calibrated, and whether there is a manual review capacity constraint. Then they would frame the answer around four pillars: estimate a cost matrix, evaluate thresholds on an out-of-time labeled cohort, choose the threshold that minimizes expected cost subject to constraints, and monitor post-launch performance.
The candidate should explicitly say that maximizing F1 or AUC is insufficient because those metrics do not encode PayPal’s dollar losses or customer harm. They might describe building a threshold table with columns like threshold, TPR, FPR, precision, fraud dollars prevented, good volume blocked, and expected net savings. A concrete tradeoff to flag is that a higher threshold may reduce false positives and preserve approval rate but allow more fraud loss; a lower threshold may catch more fraud but harm legitimate customers and merchant trust. If model scores are calibrated probabilities, they can derive a first-pass threshold using , then adjust for operational constraints and segment-specific costs. They should close by saying that with more time they would validate calibration by segment, account for delayed labels, and run a controlled experiment or shadow evaluation before full rollout.
A second angle
For “Design a fraud mitigation strategy under constraints,” the same cost-sensitive logic applies, but the emphasis shifts from one threshold to a portfolio of interventions. If manual reviewers can inspect only 10,000 transactions per day, the decision rule should prioritize cases with the highest expected incremental value from review, not simply the highest raw fraud probability. If customer friction is limited, step-up verification might be reserved for medium-risk transactions where the model is uncertain and the user can still be converted safely. The candidate should discuss segment-specific thresholds, such as stricter rules for newly created accounts but more tolerant rules for long-tenured users with strong device history. The core idea remains: choose the action that maximizes expected value under capacity, risk, and customer-experience constraints.
Common pitfalls
Pitfall: Optimizing for
AUCand stopping there.
AUC measures ranking quality across all possible thresholds, but PayPal needs one or more operating points. A better answer translates model performance into expected dollars saved, approval-rate impact, and false-positive burden at candidate thresholds.
Pitfall: Assuming the model score is automatically a probability.
Many fraud models, including XGBoost or neural ranking models, output scores that are monotonic but not calibrated. If you plug uncalibrated scores into a cost formula, the threshold can be badly wrong; mention calibration checks and threshold validation on recent data.
Pitfall: Ignoring label delay and censored outcomes.
It is tempting to evaluate yesterday’s decisions using currently known fraud labels, but many fraud outcomes have not matured yet, and declined transactions have missing counterfactual labels. A stronger answer explains the maturity window, selection bias, and why threshold estimates may need conservative confidence intervals or policy-aware evaluation.
Connections
Interviewers may pivot from this topic into imbalanced classification, causal inference for policy evaluation, fraud experiment design, or model calibration. They may also ask how thresholds interact with segmentation, anomaly detection, cold-start users, or manual review prioritization.
Further reading
-
Fawcett, “An Introduction to ROC Analysis” — foundational treatment of ROC curves and operating-point selection.
-
Elkan, “The Foundations of Cost-Sensitive Learning” — classic paper on translating unequal error costs into classification decisions.
-
Provost and Fawcett, Data Science for Business — practical discussion of expected value, model evaluation, and decision thresholds in business settings.
Practice questions
Data Manipulation (SQL/Python)
What's being tested
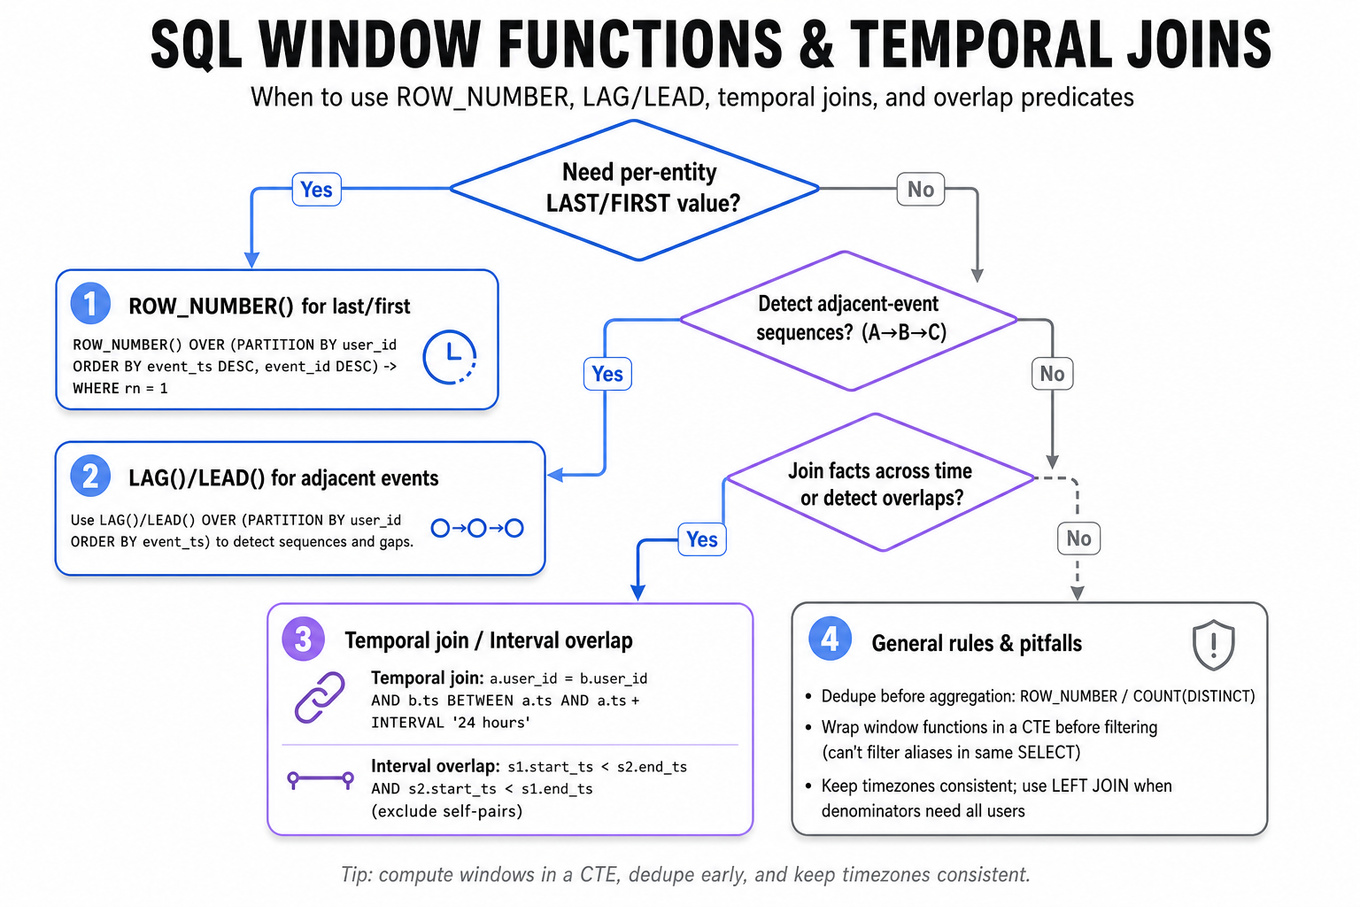
Ability to transform raw event-level data into user/session-level signals using SQL or pandas: ordering events, deduplicating rows, joining facts across time, and computing metrics. PayPal-style prompts often test whether you can detect fraud, page sequences, overlapping sessions, or contact-sync adoption without procedural row-by-row logic.
Patterns & templates
-
Last/first event per entity —
ROW_NUMBER() OVER (PARTITION BY user_id ORDER BY event_ts DESC, event_id DESC); always add deterministic tie-breakers. -
Adjacent-event reasoning — use
LAG,LEAD, or ordered self-joins to identify sequences like page A → page B → page C. -
Temporal joins — join on entity plus time predicates:
a.user_id = b.user_id AND b.ts BETWEEN a.ts AND a.ts + INTERVAL '24 hours'. -
Interval overlap counting — two sessions overlap when
s1.start_ts < s2.end_ts AND s2.start_ts < s1.end_ts; avoid double-counting self-pairs. -
Dedup before aggregation — apply
ROW_NUMBERorCOUNT(DISTINCT ...)before user-level metrics; raw event tables often contain retries or repeated actions. -
Conditional aggregation — use
SUM(CASE WHEN condition THEN 1 ELSE 0 END)andAVG(CASE WHEN flag THEN 1.0 ELSE 0 END)for rates. -
Python equivalent —
sort_values,groupby,shift,merge,rolling, and boolean masks mirror SQL windows and temporal filters.
Common pitfalls
Pitfall: Filtering on window-function aliases in the same
SELECT; wrap the window calculation in a CTE or subquery.
Pitfall: Treating timestamps as unordered strings or ignoring timezone consistency when comparing login, transaction, and session events.
Pitfall: Using
INNER JOINwhen the metric denominator requires all users; default toLEFT JOINfor adoption, sync, or exposure-rate calculations.
Practice these
The practice cards below cover the canonical variants — solve all of them and time yourself.
Practice questions
Coding & Algorithms
What's being tested
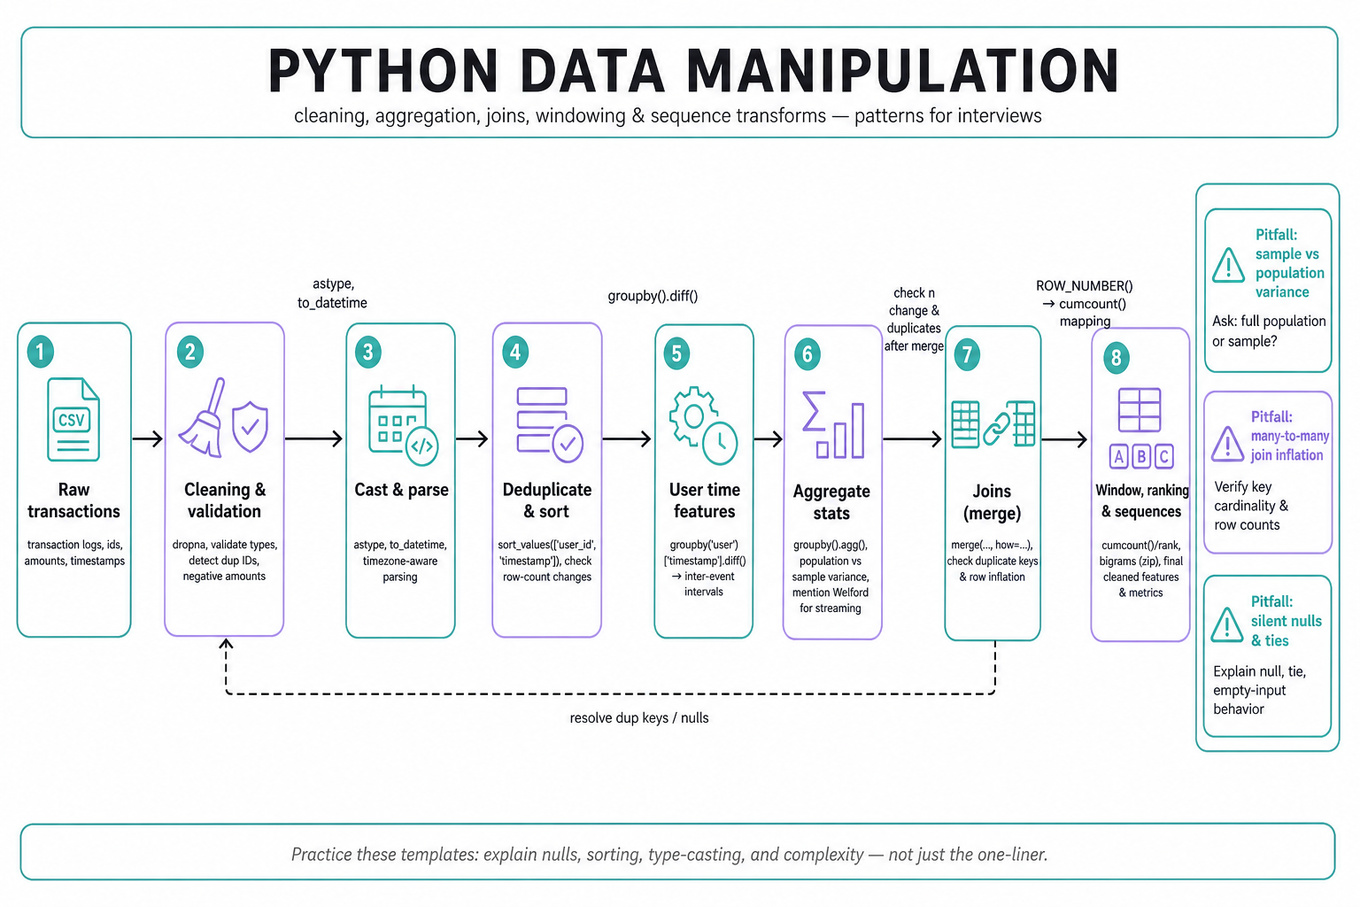
Interviewers are probing Python data manipulation fluency for DS workflows: cleaning transaction-like records, computing statistics, joining/ranking data, and transforming text or sequences. You need to show correct logic, edge-case handling, and clear complexity reasoning using plain Python, pandas, and SQL-equivalent patterns.
Patterns & templates
-
Variance computation — population: ; sample: ; handle empty and single-value lists explicitly.
-
Numerically stable aggregation — prefer two-pass variance for clarity; mention Welford’s algorithm for streaming
O(n)time,O(1)space. -
Transaction cleaning with
pandas— usedropna,astype,to_datetime,sort_values,groupby,agg,diff; validate duplicate IDs and negative amounts. -
User-level time features —
df.sort_values(["user_id", "timestamp"]), thengroupby("user_id")["timestamp"].diff()for inter-event intervals. -
Join semantics — know
merge(..., how="inner|left|right|outer|cross"); always check row-count changes and duplicate keys after joins. -
Window-function equivalents — SQL
ROW_NUMBER() OVER (PARTITION BY user ORDER BY ts)maps tosort_valuesplusgroupby().cumcount()in Python. -
Sequence transformations — generate bigrams with
zip(tokens, tokens[1:])or list comprehension; timeO(n), spaceO(n)unless using a generator.
Common pitfalls
Pitfall: Confusing sample variance and population variance; always ask whether the list is the full population or an observed sample.
Pitfall: Treating joins as harmless; many-to-many joins can silently inflate transaction counts, revenue, fraud labels, or conversion metrics.
Pitfall: Writing clever one-liners without explaining nulls, ties, type casting, sorting assumptions, or empty-input behavior.
Practice these
The practice cards below cover the canonical variants — solve all of them and time yourself.
Practice questions
Machine Learning
What's being tested
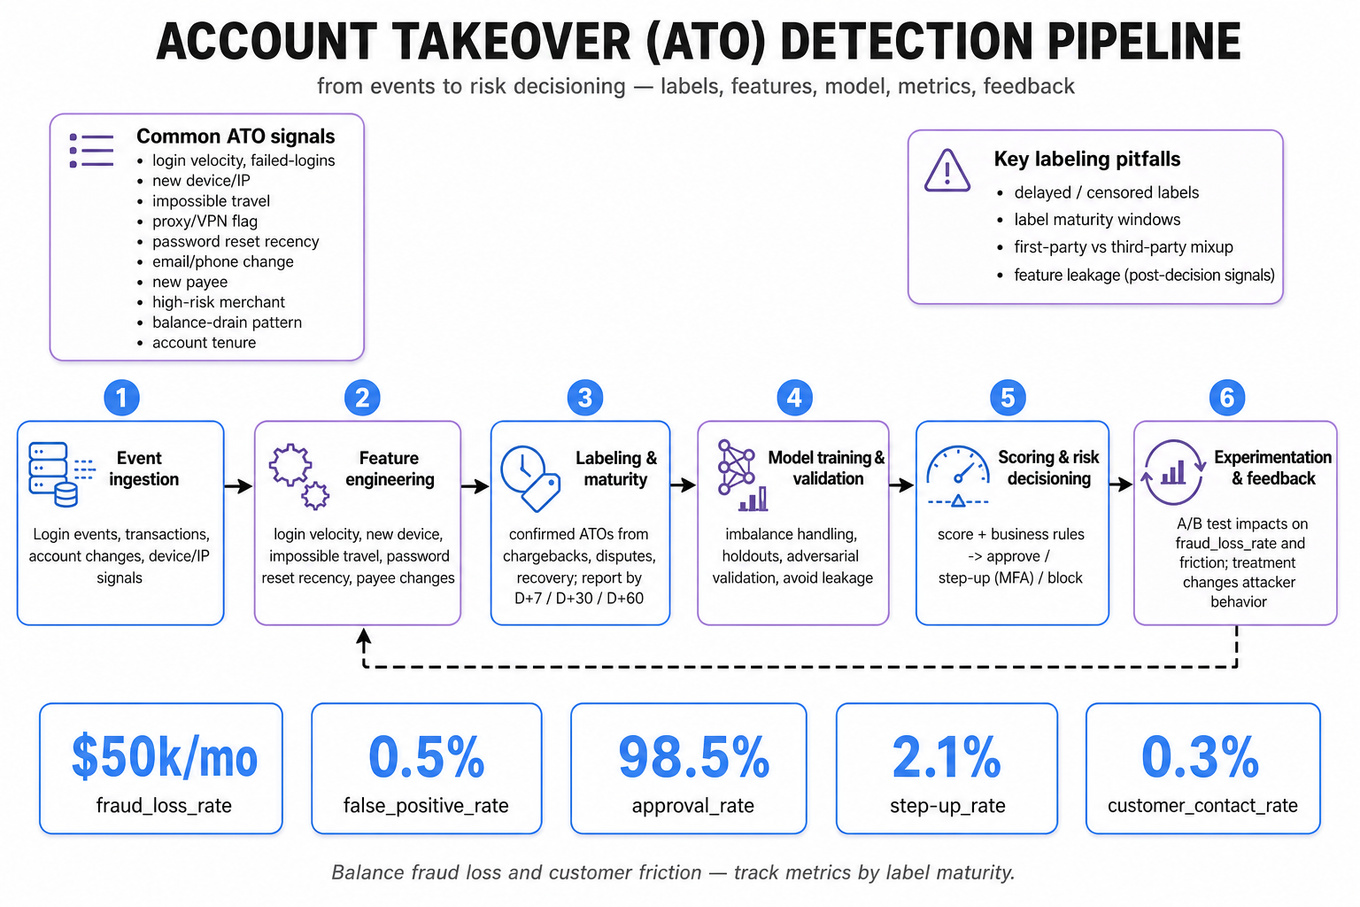
Interviewers are probing whether you can reason about account takeover detection as both a machine learning problem and a risk decisioning problem: defining labels, choosing signals, evaluating models under class imbalance, and quantifying business impact. For PayPal, the stakes are asymmetric: missed ATO creates fraud losses and customer harm, while false positives create payment friction, support contacts, and lost trust. A strong Data Scientist answer connects model quality to operational metrics like fraud_loss_rate, false_positive_rate, approval_rate, step-up_rate, and customer_contact_rate. You are also expected to understand experimentation constraints in fraud: adversarial behavior, network spillovers, delayed labels, and the fact that “treatment” may change attacker behavior.
Core knowledge
-
ATO mechanics usually involve credential compromise, suspicious login, device change, session hijacking, password reset, payment instrument change, or rapid transaction attempts. Useful framing: separate authentication risk from transaction risk, because signals and labels differ across login, account change, and payment authorization moments.
-
Label quality is central. Positive labels may come from confirmed customer claims, chargebacks, manual review, account recovery, or internal fraud investigations; negatives are often “not yet reported,” not truly clean. Account takeover labels are delayed and censored, so report metrics by label maturity window, e.g.
D+7,D+30,D+60. -
First-party fraud and third-party fraud must not be conflated. ATO is typically third-party: an unauthorized actor controls a legitimate account. First-party fraud involves the real account holder disputing or abusing payment flows. Mixing them can teach the model the wrong behavioral patterns and distort precision.
-
Common ATO features include login velocity, failed-login count, new device, new IP, geolocation distance from historical locations, impossible travel, proxy/VPN flags, password reset recency, email/phone change recency, new payee, high-risk merchant category, transaction amount deviation, balance-draining behavior, and historical account tenure.
-
Feature leakage is a frequent failure mode. Anything observed after the decision point, such as dispute creation, manual review outcome, or post-transaction account lock, cannot be used for authorization-time prediction. For each feature, state the prediction timestamp and verify the feature would exist before that timestamp.
-
Model choices are usually less important than data and evaluation. Strong tabular baselines include logistic regression, random forest,
XGBoost, andLightGBM; deep sequence models can help if session/event histories are rich. For DS interviews, emphasize calibration, lift, stability, and decision thresholds over model architecture details. -
Class imbalance is extreme: true ATO may be basis points of all logins or transactions. Accuracy is nearly useless. Prefer
precision,recall,PR-AUC,ROC-AUC,recall@FPR,precision@review_capacity,lift_at_k, and expected value: -
Thresholding should be cost-sensitive, not purely statistical. A transaction block, step-up authentication, manual review, and silent monitoring have different costs. A good answer proposes multiple action bands: low risk approve, medium risk step-up, high risk hold/review, extreme risk block.
-
Calibration matters when risk scores drive policy. A model with good rank ordering but poor probability calibration may still support top-k review, but not expected-loss thresholds. Mention
Platt scaling, isotonic regression, and calibration plots by segment such as new users, high-value transactions, and cross-border activity. -
Offline evaluation must mimic production decisioning. Use time-based train/validation/test splits, not random splits, because fraud patterns drift. Report performance by cohort: account age, device age, geography, payment method, transaction amount band, and merchant category. Watch for overfitting to one fraud campaign.
-
Experiment design for ATO controls is tricky because treatment can affect attackers and users beyond the randomized unit. Randomizing at transaction level may contaminate users who make multiple attempts; randomizing at account, device cluster, or risk segment can reduce interference. Use cluster-robust standard errors when randomization or outcomes are correlated.
-
Power analysis must translate statistical detectability into business impact. For a binary metric, a rough sample size per arm is:
but fraud loss is heavy-tailed, so also consider winsorized loss, bootstrap confidence intervals, or CUPED-style variance reduction when pre-period behavior is predictive.
Worked example
For Design an A/B for ATO rule, a strong candidate starts by clarifying the decision: “Is the new rule blocking transactions, triggering step-up authentication, or sending cases to manual review?” Then they ask for the target population, current ATO rate, expected friction cost, label maturity window, and whether attackers can observe treatment. The answer can be organized around four pillars: experimental unit, primary/guardrail metrics, power and duration, and monitoring/rollback. For randomization, account-level or device-cluster-level assignment is often safer than transaction-level assignment because a single compromised account may generate multiple correlated attempts. The primary metric might be confirmed ATO_loss_per_1k_transactions or net_loss_saved, while guardrails include approval_rate, step-up_success_rate, false_positive_contact_rate, and good_user_decline_rate. A specific tradeoff to flag is that blocking more transactions can mechanically reduce measured fraud while also suppressing legitimate activity, so the experiment needs both fraud and customer-friction outcomes. Sequential monitoring should be pre-specified, using alpha-spending or Bayesian monitoring rather than repeatedly peeking at p_value < 0.05. Close by saying that, with more time, you would segment results by new device, account tenure, payment amount, and geography to ensure the rule is not only profitable on average but robust across important cohorts.
A second angle
For Explain fraud types and evaluate a fraud model, the same concept shifts from experimentation to model diagnosis. Instead of starting with randomization, begin by defining the fraud taxonomy: ATO, stolen card, synthetic identity, friendly fraud, seller fraud, and phishing-driven credential compromise. The key is to explain how labels differ and why a model trained on chargebacks may miss ATO cases resolved through account recovery before a chargeback occurs. Evaluation should emphasize PR-AUC, recall_at_fixed_FPR, precision_at_manual_review_capacity, and business expected value rather than accuracy. The strongest answers also discuss delayed ground truth, calibration, threshold selection, and whether the model performs consistently across high-risk but legitimate user segments.
Common pitfalls
Pitfall: Treating ATO detection as a generic binary classifier.
A tempting answer is “train XGBoost, optimize AUC, and deploy the best model.” That misses the real issue: ATO decisions are cost-sensitive, labels are delayed, and action thresholds depend on whether the intervention is block, step-up, or review. A better answer ties every metric to fraud loss avoided and legitimate-user harm.
Pitfall: Ignoring interference in an A/B test.
Randomizing every transaction independently sounds clean, but compromised accounts and fraud rings create correlated outcomes. If attackers learn that some attempts are blocked, they may adapt across accounts or devices. A stronger response discusses account-level or cluster-level randomization, cluster-robust inference, and pre-defined rollback thresholds.
Pitfall: Over-indexing on signals without checking timing.
Candidates often list strong signals like dispute outcome, account lock, or manual review result as features. Those may be valid labels or evaluation outcomes, but they are leakage if unavailable at authorization time. Always anchor features to a prediction timestamp: login-time, account-change-time, or transaction-time.
Connections
Interviewers may pivot from ATO detection into fraud experimentation, model calibration, anomaly detection, causal inference under interference, or SQL-based risk analytics using window functions and cohort definitions. They may also ask how to balance fraud reduction against customer experience, which turns the discussion into threshold optimization and guardrail metric design.
Further reading
-
Provost and Fawcett, Data Science for Business — practical treatment of lift, expected value, and thresholding for business decisions.
-
Saito and Rehmsmeier, “The Precision-Recall Plot Is More Informative than the ROC Plot When Evaluating Binary Classifiers on Imbalanced Datasets” — useful grounding for why
PR-AUCmatters in rare-event fraud problems. -
Kohavi, Tang, and Xu, Trustworthy Online Controlled Experiments — strong reference for A/B testing, guardrails, peeking, and experiment interpretation.
Practice questions
ML System Design
What's being tested
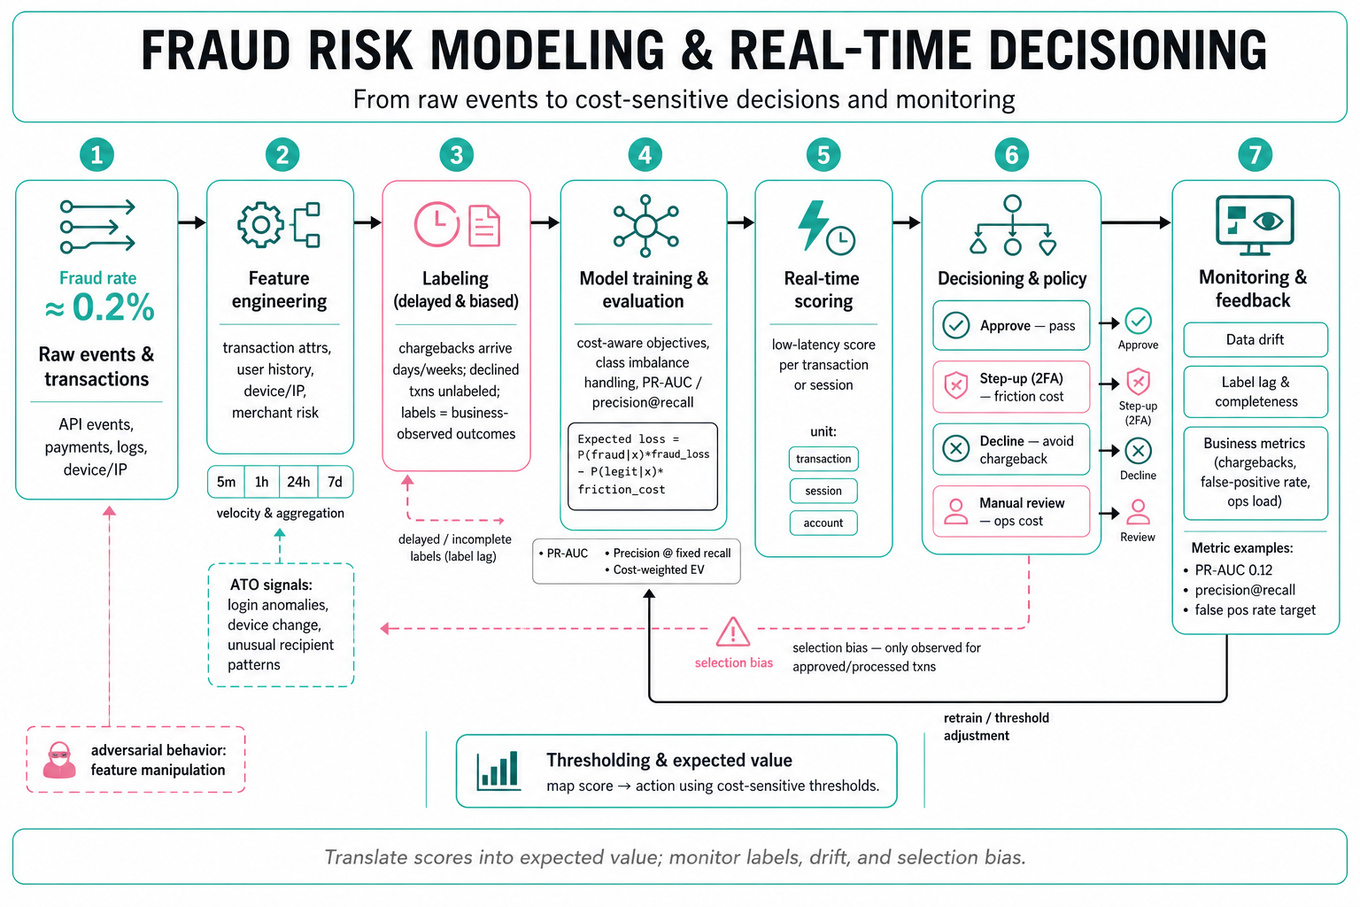
PayPal is probing whether you can design a fraud risk modeling approach that balances financial loss, customer friction, operational capacity, and delayed ground truth. A strong Data Scientist answer is not just “train a classifier”; it explains signals, labels, model evaluation, thresholding, decision policies, and post-launch monitoring. Interviewers care because payments fraud decisions happen under asymmetric costs: a false negative can create chargeback loss, while a false positive can block a legitimate user and damage trust. They are also testing whether you understand real-world complications like class imbalance, label delay, selection bias, and adversarial behavior.
Core knowledge
-
Fraud labels are often delayed, incomplete, and biased. Chargebacks may arrive days or weeks later; user reports may undercount fraud; declined transactions rarely reveal whether they would have been fraudulent. Treat labels as business-observed outcomes, not ground truth.
-
Feature families usually include transaction attributes, user history, device/IP signals, merchant or counterparty risk, velocity features, behavioral changes, and network relationships. For a Data Scientist, the key is deciding which signals are predictive and stable, not designing the ingestion system.
-
Velocity features are central in payments fraud: count, sum, unique counterparties, failed attempts, or location changes over rolling windows such as 5 minutes, 1 hour, 24 hours, and 7 days. Examples: “transactions in last 10 minutes” or “new devices used in last 24 hours.”
-
Account takeover signals differ from ordinary stolen-card fraud. ATO often shows login anomalies, password or email changes, new device fingerprints, unusual recipient patterns, and high-risk actions shortly after account changes. Model framing should reflect whether the unit is login, account, transaction, or session.
-
Class imbalance makes accuracy nearly useless. If fraud rate is 0.2%, a model that predicts “not fraud” always gets 99.8% accuracy. Prefer
PR-AUC, precision at fixed recall, recall at fixed false-positive rate, lift in top risk deciles, and cost-weighted business metrics. -
Cost-sensitive decisioning should translate model scores into expected value. A useful framing is:
Decline, step-up, review, or approve based on expected utility and business constraints. -
Thresholding is not one global cutoff by default. You may need segment-specific thresholds by geography, payment method, user tenure, merchant category, transaction amount, or available manual review capacity. A 2,000 transaction should not necessarily share the same decision threshold.
-
Model choices should match interpretability, speed, and tabular signal quality.
LogisticRegressionis transparent and calibratable;XGBoostorLightGBMoften perform well on tabular fraud features; unsupervised methods like isolation forests help when labels are sparse but should not replace supervised evaluation. -
Calibration matters because the score often drives monetary decisions. A model with high ranking quality but poor probability calibration can over-decline legitimate customers. Use reliability plots, Brier score, Platt scaling, or isotonic regression when the downstream policy interprets scores as probabilities.
-
Delayed-label evaluation requires careful time-based splits. Train on past data and evaluate on a future window whose labels have matured enough. Random splits leak future behavior and inflate performance, especially when fraud rings or repeated users appear in both train and test.
-
Selection bias appears when previous rules or models determine which transactions get approved, reviewed, or declined. Approved transactions have richer outcome labels than declined ones. Discuss reject inference, randomized review samples, shadow scoring, or sensitivity analysis rather than assuming observed labels are representative.
-
Real-time decisioning is a policy layer around the score. The Data Scientist should define score semantics, required feature freshness, decision thresholds, review queues, and monitoring metrics such as fraud loss rate, approval rate, false-positive rate, chargeback rate, and customer friction rate.
Worked example
For “Detect credit-card transaction fraud,” start by clarifying the decision point: “Are we scoring authorization attempts in real time, and can the actions be approve, decline, step-up authentication, or manual review?” Then ask about label sources such as chargebacks, confirmed disputes, customer reports, and bank feedback, plus the expected label delay. A strong answer would organize around four pillars: define the prediction target, construct transaction/user/device/merchant features, train and evaluate a supervised risk model, and convert scores into business actions under cost and capacity constraints. You would mention that the base rate is likely very low, so you would prioritize PR-AUC, recall at fixed precision, and expected dollar loss avoided instead of accuracy.
The answer should explicitly separate offline model quality from online policy quality: the model ranks risk, while the decision policy decides whether the predicted risk justifies friction. One concrete tradeoff to flag is aggressive declines versus customer experience: lowering the threshold may reduce fraud loss but increase false positives and failed legitimate payments. You could propose segment-specific thresholds, for example stricter treatment for high-dollar, new-device, cross-border transactions and more lenient treatment for trusted users with long clean histories. Close by saying that if you had more time, you would add monitoring for drift, delayed-label backtesting, and experiments or champion/challenger comparisons to measure incremental fraud reduction without over-blocking good users.
A second angle
For “Design a fraud mitigation strategy under constraints,” the same modeling concepts apply, but the center of gravity shifts from prediction to constrained optimization. Instead of simply maximizing PR-AUC, you need to decide how to allocate scarce interventions such as manual review slots, SMS verification, temporary holds, or transaction declines. A good framing is to rank transactions by expected preventable loss and apply action-specific thresholds subject to constraints like “only 10,000 reviews per day” or “customer friction cannot increase more than 20 basis points.” This also surfaces fairness and segmentation questions: if one geography or user tenure group receives disproportionate friction, you need to check whether that is justified by calibrated risk or caused by biased labels. The best answer shows how model scores become an operating policy, not just a dashboard.
Common pitfalls
Pitfall: Optimizing for
ROC-AUCalone.
ROC-AUC can look excellent in highly imbalanced fraud data while the top-risk queue is still operationally poor. A better answer ties evaluation to decisions: precision among reviewed transactions, recall at an acceptable false-positive rate, dollar loss prevented, and approval-rate impact.
Pitfall: Treating labels as clean and immediate.
A tempting but weak answer is “use chargebacks as labels and retrain weekly.” That misses label delay, partial observability, and bias from past declines. Say how you would use time-based validation, mature label windows, and possibly randomized audits or manual-review samples to estimate hidden fraud.
Pitfall: Jumping into infrastructure details instead of analytical design.
For a Data Scientist interview, do not spend the answer designing event streams, retry semantics, or storage partitions. Stay focused on target definition, signal design, model evaluation, calibration, thresholding, experiment design, and business metrics. You can mention that some features must be available at decision time, but you do not need to architect the serving layer.
Connections
Interviewers may pivot from here into SQL-based fraud signal detection, especially window functions for velocity or ATO patterns, or into experimentation under interference and delayed outcomes. They may also ask about anomaly detection, model monitoring, causal measurement of fraud interventions, or segmentation analysis when fraud patterns differ across users, merchants, or geographies.
Further reading
-
Credit Card Fraud Detection: A Realistic Modeling and a Novel Learning Strategy — Dal Pozzolo et al.; useful for class imbalance, temporal validation, and realistic fraud evaluation.
-
The Elements of Statistical Learning — Hastie, Tibshirani, and Friedman; strong foundation for supervised learning, regularization, calibration, and model assessment.
-
Hidden Technical Debt in Machine Learning Systems — Sculley et al.; helpful context for monitoring, feedback loops, and why offline model quality is not enough in production ML systems.
Practice questions
Behavioral & Leadership
What's being tested
Interviewers are probing whether you can use data science leadership to create alignment when you do not control the roadmap, the engineering queue, or the business decision. For PayPal, this matters because product, risk, payments, compliance, and growth teams often optimize different outcomes: higher conversion, lower fraud loss, fewer false declines, better customer experience, and regulatory safety. A strong Data Scientist shows they can translate ambiguity into a measurable decision, separate signal from noise, communicate uncertainty without losing credibility, and influence stakeholders with evidence rather than authority. The bar is not “I produced an analysis”; it is “my analysis changed a decision, reduced risk, or created a shared operating model.”
Core knowledge
-
Stakeholder mapping starts with identifying the decision-maker, recommenders, blockers, and affected teams. For a PayPal DS, stakeholders may include product managers, risk policy, engineering, finance, legal/compliance, operations, and customer support; each may optimize a different metric.
-
Metric framing is the foundation of influence. Define the primary metric, guardrails, and counter-metrics: for example, improve
checkout_conversion_ratewhile monitoringfraud_loss_rate,false_decline_rate,chargeback_rate,NPS, andcustomer_support_contacts. -
Decision-oriented analysis beats exploratory narration. Frame work as: “What decision will this change?” then structure outputs into options, evidence, uncertainty, recommendation, and expected impact. A useful template is: context → key finding → implication → decision needed → next step.
-
Causal reasoning is often the difference between persuasion and correlation theater. If stakeholders disagree, clarify whether evidence comes from an A/B test, quasi-experiment, interrupted time series, or observational segmentation; avoid claiming causality from raw cohort differences.
-
Uncertainty communication should be explicit but not paralyzing. Use confidence intervals, minimum detectable effect, and practical significance: . Say whether the effect is statistically reliable, commercially meaningful, and robust across key segments.
-
KPI-drop diagnosis should separate real business movement from measurement artifacts. Check metric definition changes, denominator shifts, seasonality, traffic mix, experiment exposure, product releases, risk-policy changes, outage windows, and segment-level decomposition by region, funding source, device, merchant category, and new versus returning users.
-
Decomposition gives stakeholders a shared fact base. For conversion drops, decompose total change as mix shift plus within-segment performance: This helps distinguish “users changed” from “experience degraded.”
-
Conflict resolution requires naming tradeoffs, not hiding them. A growth team may want looser friction to increase approvals; a risk team may want tighter controls to reduce loss. The DS role is to quantify the frontier: incremental approvals versus incremental fraud loss, ideally by customer or transaction segment.
-
Leading without authority means creating leverage through artifacts: metric definitions, readouts, decision logs, experiment review docs, dashboards, and recurring forums. You are not managing people; you are making the right decision easier, faster, and safer for cross-functional partners.
-
Executive communication should use pyramid structure. Start with the recommendation, then the two or three facts that support it, then caveats. For senior audiences, lead with business impact: “This appears to be a 120 bps conversion drop concentrated in mobile PayPal checkout for new users in the U.S.”
-
Data quality ambiguity should be handled as risk management, not blame. Say what checks you ran, what confidence level you have, and how conclusions change under alternate assumptions. Avoid designing ingestion systems; focus on validating definitions, comparing independent sources, and bounding decision risk.
-
Behavioral examples should follow a tight STAR-plus-impact structure: situation, task, action, result, and what you learned. Quantify outcomes where possible: “reduced false declines by 3%,” “prevented launch to 20% traffic,” or “aligned four teams on a single
active_accountdefinition.”
Worked example
For “Analyze KPI Drop: Immediate Steps for Stakeholder Persuasion,” a strong candidate would first frame the first 30 seconds around urgency and decision context: “Which KPI dropped, by how much, over what time window, and what decision do we need to make today?” They would clarify whether the KPI is checkout_conversion_rate, payment_success_rate, TPV, authorization_rate, or another business metric, because each implies different likely causes and stakeholders. Then they would state assumptions: “I’ll treat this as a real-time business incident until proven otherwise, but I’ll first rule out measurement artifacts.”
The answer skeleton should have four pillars. First, validate the metric: confirm numerator, denominator, logging continuity, dashboard changes, and whether independent sources agree. Second, localize the drop: decompose by platform, geography, merchant, customer tenure, funding instrument, risk segment, release cohort, and experiment cell. Third, connect to known events: product launches, risk-rule updates, payments processor issues, traffic acquisition changes, seasonality, or external events. Fourth, communicate a recommendation: pause a rollout, continue monitoring, rollback a change, or run a targeted deep dive depending on evidence strength.
A specific tradeoff to flag is speed versus certainty. In a severe drop, you may recommend a temporary rollback with 70% confidence if downside risk is high, while continuing analysis to avoid overfitting to noisy early data. The candidate should show how they would persuade stakeholders: bring a concise incident readout with “what we know,” “what we ruled out,” “most likely drivers,” “decision options,” and “risk of each option.” They should close with: “If I had more time, I’d estimate customer and revenue impact, validate against longer historical baselines, and set up monitoring by the affected segments so we know whether the intervention works.”
A second angle
For “Influence Stakeholders Without Authority: Strategies and Examples,” the same skill shifts from incident response to long-cycle alignment. Instead of diagnosing a sudden drop, the candidate needs to show how they created agreement among people with competing incentives. A strong example might involve convincing product and risk teams to adopt a shared approval-quality metric rather than optimizing approval_rate alone. The framing should emphasize listening first, quantifying each team’s concern, and converting debate into an agreed decision rule. The constraint is political rather than technical: the DS succeeds by making the tradeoff visible and by building trust through transparent assumptions, not by “winning” the argument.
Common pitfalls
Pitfall: Treating stakeholder influence as “I showed them the data and they agreed.”
That answer sounds passive and junior. A better answer explains how you diagnosed stakeholder incentives, adapted the analysis to their concerns, anticipated objections, and created a decision artifact that let the group act.
Pitfall: Over-indexing on statistical detail while ignoring the business decision.
For example, spending five minutes on p-values during a KPI-drop question but never saying whether to pause a launch misses the leadership signal. State the decision, quantify uncertainty, and explain what action you recommend under that uncertainty.
Pitfall: Blaming upstream data or other teams without owning the analytical path forward.
It is fine to say the metric may be affected by logging changes, missing events, or inconsistent definitions. But the stronger DS answer says how you would triangulate with alternative metrics, bound the impact, communicate confidence, and decide whether the evidence is sufficient.
Connections
Interviewers may pivot from this topic into experiment design, especially how you would resolve stakeholder disagreement with an A/B test or guardrail metrics. They may also move into metric design, causal inference, anomaly diagnosis, or model evaluation tradeoffs such as balancing fraud detection precision against customer friction.
Further reading
-
Trustworthy Online Controlled Experiments — Practical reference for experimentation, metric tradeoffs, and communicating evidence in product decisions.
-
Storytelling with Data — Useful for turning complex analytical findings into clear stakeholder communication.
-
Crucial Conversations — Strong behavioral framework for disagreement, high-stakes communication, and influence without authority.
Practice questions