Central Limit Theorem, Sampling, And Heavy-Tailed Metrics
Asked of: Data Scientist
Last updated
What's being tested
These interviews test whether you can reason about skewed, zero-inflated, heavy-tailed product metrics rather than blindly applying average-based inference. For Meta, metrics like comments per user, shares per creator, session length, and ad spend often have many zeros plus a small number of extreme users, so the “typical user” and the “average user” can tell very different stories. The interviewer is probing whether you understand sampling distributions, the Central Limit Theorem, robust summaries, and confidence intervals well enough to make a product decision. They are not testing memorized definitions; they want to see if you can choose the right statistic for the question, explain uncertainty, and avoid being fooled by outliers or sampling artifacts.
Core knowledge
-
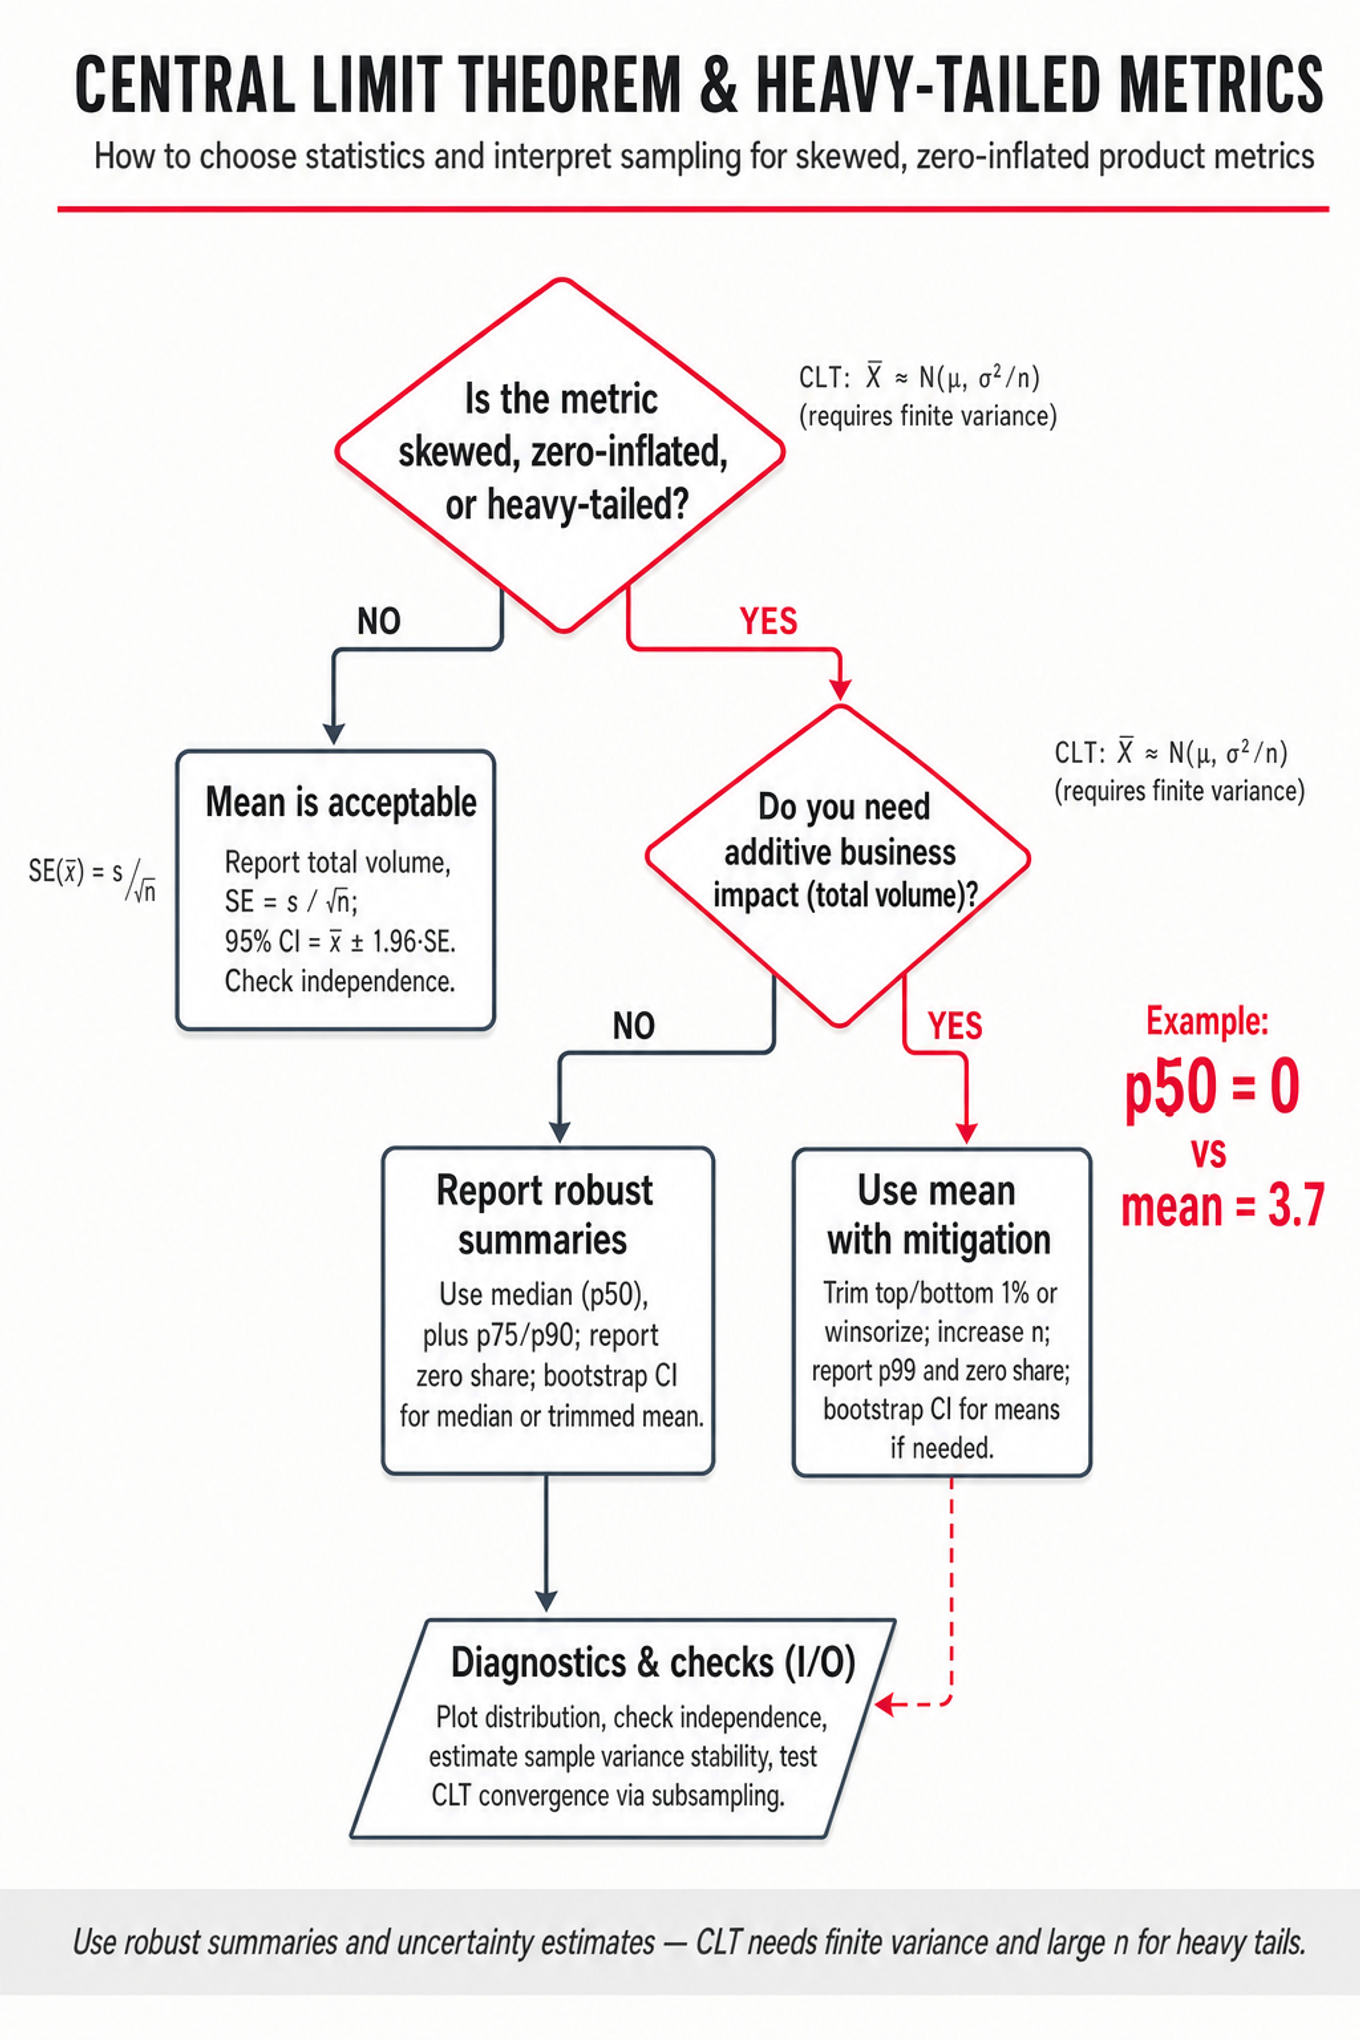
Right-skewed count metrics are common in social products: comments per user, reactions per post, groups joined, messages sent. They usually have a mass at zero, a long right tail, and mean median. Always separate “average activity” from “typical user behavior.”
-
Mean answers “total volume per unit divided by units”:
It is appropriate when business impact is additive, such as total comments, total revenue, or total time spent, but it is sensitive to whales and bots. -
Median and quantiles describe the user distribution more robustly. For example,
p50comments per user may be 0 while the mean is 3.7. Reportp75,p90,p99, and zero share when the distribution is highly skewed. -
Trimmed means remove extreme tails before averaging, such as dropping the top and bottom 1%. Winsorized means cap extremes instead of removing them. These preserve an “average-like” interpretation while reducing sensitivity to spam, celebrities, or power users.
-
Central Limit Theorem says the sampling distribution of the sample mean approaches normal if observations are independent and have finite variance:
Heavy tails slow convergence, so large helps but does not automatically fix bad metric design. -
Standard error of the mean is estimated as:
where is the sample standard deviation. The sample standard deviation uses in the denominator; the population standard deviation uses . -
Confidence intervals for a mean are often written:
for a large-sample 95% interval. For very skewed data, compare this with a bootstrap confidence interval, especially if the sample size is modest or outliers dominate. -
Bootstrap resamples users with replacement, recomputes the statistic many times, and uses empirical percentiles of the resampled estimates. It works well for medians, quantiles, trimmed means, and complex metrics, but can be unstable for extreme
p99.9estimates or rare-event metrics. -
Sampling unit matters. If the metric is comments per user, sample users, not comments. Sampling comments overrepresents highly active users and changes the estimand. In experiments, randomization and analysis units should usually align, often at user, session, post, or creator level.
-
Aggregation changes distributional shape. Daily comments per user is more zero-inflated than weekly or monthly comments per user. Aggregating over time reduces zeros and can make the distribution less noisy, but it may hide day-level volatility or novelty effects.
-
Independence assumptions can fail in social networks. Users influence each other through feeds, groups, and comment threads, so variance can be underestimated if you treat correlated observations as independent. Mention clustering, network spillovers, or creator-level dependence when relevant.
-
Outlier diagnosis should be metric-led, not arbitrary. Before excluding high-comment users, check whether they are legitimate creators, spam accounts, bots, coordinated campaigns, or product-intended power users. Exclusion rules should be pre-specified and reported alongside sensitivity analyses.
Worked example
For Analyze User Comment Distribution and Sampling Effects, a strong candidate would start by clarifying the unit and time window: “Are we measuring comments per user per day, per active user per week, or comments per post? Is the sample random over users, active users, or comments?” Then they would declare the expected shape: many users make zero comments, a smaller group comments occasionally, and a tiny group contributes a large share of total comments, so the distribution is right-skewed and likely heavy-tailed.
The answer can be organized around four pillars: first, describe the empirical distribution using zero rate, mean, median, and percentiles like p75, p90, and p99; second, explain how mean and median answer different product questions; third, discuss sampling effects and why the sample mean varies less as grows; fourth, explain when the CLT supports approximate confidence intervals and when bootstrap or robust summaries are safer. A strong candidate would explicitly say that sampling comments instead of users creates selection bias toward heavy commenters, while sampling users preserves the user-level estimand.
One important tradeoff is whether to optimize or report the mean versus a robust statistic. The mean is aligned with total ecosystem engagement, but it can be dominated by a small number of extreme users; the median may be 0 and therefore uninformative for incremental product changes. A balanced answer would report both: mean for total volume, quantiles and zero share for distributional understanding, and possibly a trimmed or winsorized mean for robustness. The close should sound practical: “If I had more time, I’d segment by new versus existing users, creator versus consumer behavior, geography, and integrity flags to see whether the tail reflects healthy engagement or spam.”
A second angle
For Choose robust metrics for skewed comments, the same statistical ideas apply, but the emphasis shifts from describing the distribution to choosing the decision metric. Here, the candidate should compare mean, median, trimmed mean, winsorized mean, geometric mean, and quantile-based metrics under zero inflation and heavy tails. The median may be robust but useless if most users have zero comments; the geometric mean needs care because is undefined, so analysts often use and interpret changes on the transformed scale. The strongest framing is to tie each metric to a product objective: total conversation volume, broad participation, reduction in passive users, or limiting spammy overactivity. Uncertainty should be estimated with bootstrap or randomization-based inference when closed-form normal approximations are questionable.
Common pitfalls
Pitfall: Saying “by the CLT, the data is normal.”
The CLT concerns the sampling distribution of the mean, not the raw user-level distribution. Comments per user can remain extremely skewed even if the sample mean is approximately normal. A better answer is: “The average across repeated samples may be close to normal for large , but I would still describe the raw distribution with quantiles and check tail sensitivity.”
Pitfall: Treating the median as automatically better because the metric is skewed.
The median is robust, but if 60% of users comment zero times, the median is 0 and will not detect many meaningful product changes. A stronger answer distinguishes product goals: use mean for total engagement, zero share for participation, quantiles for distributional shifts, and robust means for sensitivity to extreme users.
Pitfall: Ignoring the sampling unit.
A tempting but wrong answer is to take a random sample of comments and infer user behavior from it. That sample is comment-weighted, not user-weighted, so heavy commenters dominate. A better response explicitly defines the population, unit of analysis, and whether the estimate is for users, posts, sessions, creators, or comments.
Connections
Interviewers may pivot from here into A/B testing, especially variance estimation for skewed metrics, ratio metrics, CUPED, and bootstrap-based inference. They may also ask about metric design, such as choosing guardrails for spam or unhealthy engagement, or about causal inference when commenting changes are confounded by feed ranking, notifications, or creator mix. For ranking and recommender contexts, expect connections to offline metric evaluation, user-level heterogeneity, and tail-risk diagnostics.
Further reading
- [Hogg, McKean, and Craig, Introduction to Mathematical Statistics] — strong reference for sampling distributions, standard errors, and confidence intervals.
- [Efron and Tibshirani, An Introduction to the Bootstrap] — canonical treatment of bootstrap inference for non-normal and complex statistics.
- [Kohavi, Tang, and Xu, Trustworthy Online Controlled Experiments] — practical experimentation guidance for product metrics, skewed outcomes, and decision-making under uncertainty.
Practice questions
- Model comment count distribution and validate assumptionsMeta · Data Scientist · Onsite · medium
- Characterize and compare transfer-count distributions over timeMeta · Data Scientist · Onsite · medium
- Characterize metric distribution and quantilesMeta · Data Scientist · Onsite · medium
- Analyze skewed comments and sampling effectsMeta · Data Scientist · Onsite · medium
- Analyze User-Comment Distribution to Understand EngagementMeta · Data Scientist · Onsite · medium
- Analyze View Distribution and Recommendation Overlap in VideosMeta · Data Scientist · Onsite · medium
- Analyze Central Limit Theorem in User Comment DistributionMeta · Data Scientist · Onsite · medium
Related concepts
- Skewed Distributions And Count DataStatistics & Math
- Central Limit Theorem, Confidence Intervals, And PowerStatistics & Math
- Skewed Distributions, Count Data, And Ratio Metrics
- Statistical Inference, Power, And Metric UncertaintyStatistics & Math
- Robust Statistical MetricsStatistics & Math
- Skewed And Heavy-Tailed Distributions