Experiment Metric Design And Guardrails
Asked of: Data Scientist
Last updated
What's being tested
These prompts probe a candidate’s ability to design, analyze, and interpret randomized experiments that change a free‑trial or free‑month offer and then measure downstream subscription economics. Interviewers expect precise causal inference thinking (what population and estimand), robust metric design (primary, guardrail, ROI), and practical statistical checks (power, significance, diagnostics). For a Data Scientist role, the interviewer is checking that you can translate product levers into estimands, pick defensible analysis populations, and produce recommendations grounded in uncertainty and business value.
Core knowledge
-
Estimand selection: know Intent‑to‑treat (ITT) versus per‑protocol (triggered) effects; state the causal effect you intend to estimate and why ITT is usually primary for randomized offers.
-
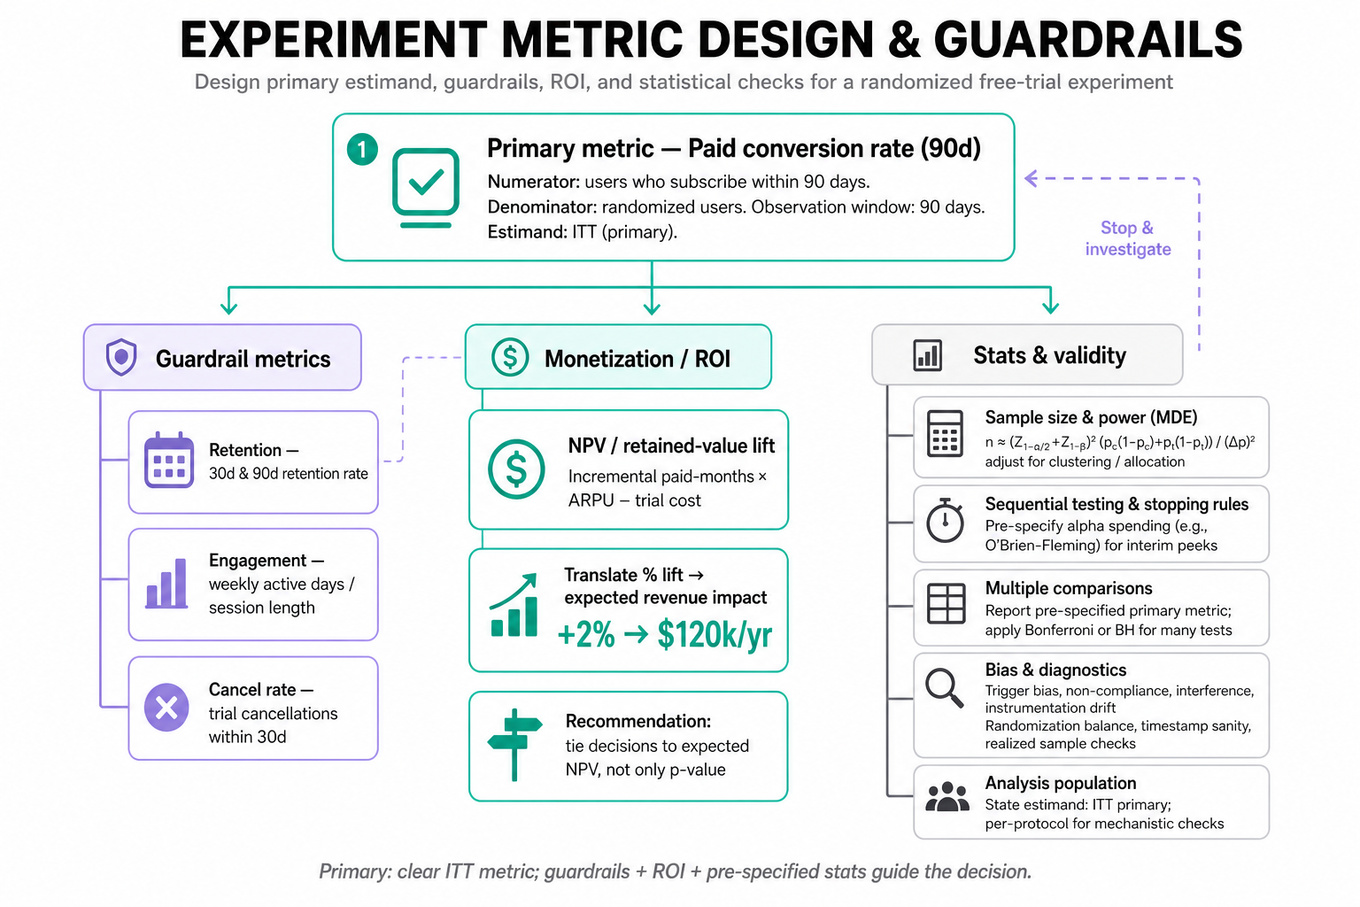
Primary metric design: define a single, business‑aligned primary outcome (e.g., paid conversion rate within 90 days) with explicit numerator, denominator, and observation window.
-
Guardrail metrics: always include retention, engagement, and cancel rate as guardrails to detect harm outside the primary conversion uplift.
-
Monetization / ROI: compute net present value (NPV) or retained-value lift: estimate incremental paid-months × ARPU minus trial cost; translate lift % into expected revenue impact.
-
Sample size & power: use minimal detectable effect (MDE) formula: for proportions, adjust for clustering or unequal allocation.
-
Sequential testing & stopping rules: if interim peeks occur, control Type I – use Group Sequential or alpha spending (e.g., O’Brien‑Fleming) or pre‑registered sequential methods rather than naive peeking.
-
Multiple comparisons: if many segments/metrics are inspected, apply corrections (Bonferroni, Benjamini‑Hochberg) or report adjusted p/q-values and emphasize pre‑specified primary metric.
-
Bias sources: watch for trigger bias, non‑compliance, interference (SUTVA violation), instrumentation drift (metric definition changes), and differential measurement latency.
-
Diagnostics / sanity checks: validate randomization balance, pre‑experiment metric equality, sample size realized, and event timestamp consistency; run holdout‑period checks for novelty effects.
-
Analysis population choices: clarify whether metrics are computed ITT (all randomized), triggered (those who enter trial), or exposure‑weighted; each answers different stakeholder questions.
-
Variance reduction: consider stratification, blocking, or covariate adjustment (ANCOVA or logistic regression with pre‑period covariates) to improve power while preserving unbiasedness.
-
Attribution & horizon: choose observation horizon driven by product funnel (e.g., free 14‑day trial → measure conversion at 30/60/90 days) and report cumulative and time‑to‑event analyses.
Worked example — "Design and analyze a free-trial A/B test"
Start by clarifying constraints: free‑trial length, target population (new users? existing churned users?), and what counts as a paid conversion and cancellation. A strong response structures the plan in pillars: (1) estimand = ITT paid conversion rate at 90 days; (2) experiment setup = randomize at user‑id, pre‑register sample size and stopping rules; (3) metrics = primary (90‑day conversion), guardrails (7/30/90‑day retention, average revenue per user), and safety checks; (4) analysis = ITT comparison with covariate‑adjusted logistic regression and secondary per‑protocol triggered analysis. Flag tradeoffs: choosing ITT avoids compliance bias but dilutes effect size — require larger sample or variance reduction via stratification (geography, platform). For statistical testing, compute MDE before launch and plan for one pre‑specified interim look with an O’Brien‑Fleming boundary. Close by describing deliverables: point estimates with CIs, revenue lift projection (incremental conversions × ARPU × expected lifetime), and recommendation with uncertainty bounds; add "if I had more time" items such as survival analysis for time‑to‑conversion and heterogeneity exploration by cohort.
A second angle — "Analyze A/B Test Results for Subscription Conversion Rates"
Here the framing is result interpretation rather than pure design: start by checking randomization and sample sizes, then compute the paid‑conversion lift and its statistical significance for ITT and triggered populations. Augment with ROI: convert incremental conversion into lifetime value and subtract incremental cost of the trial. Look for alternative explanations: differential churn, instrumentation errors, or seasonal effects. Emphasize diagnostic plots: cumulative lift over time, Kaplan‑Meier curves for conversion timing, and subgroup consistency. This angle highlights post‑hoc forensic skills — if results are non‑significant but promising, recommend follow‑ups (longer horizon, increased sample, or targeted variants).
Common pitfalls
Pitfall: Treating a triggered (per‑protocol) conversion rate as causal without presenting ITT. This overstates effect if many randomized users never enter the trial; always show ITT first and explain per‑protocol as secondary.
Pitfall: Peeking mid‑experiment and declaring significance using naive p‑values. Interim looks inflate Type I error; either pre‑register stopping rules or use sequential‑test corrections.
Pitfall: Reporting only relative lift (%) without monetization. Stakeholders need revenue impact and uncertainty; present incremental conversions × ARPU with confidence intervals and downside scenarios.
Connections
Interviewers may pivot to heterogeneous treatment effects (segmentation analysis, uplift modeling) or to sequential experimentation frameworks (bandits vs. fixed randomized tests). They might also ask about instrumented telemetry reliability, but expect discussion only at the analysis level (signal quality checks), not pipeline engineering.
Further reading
-
A Practical Guide to Controlled Experiments on the Web — Kohavi et al. (book/paper) — covers online experiment design, pitfalls, and diagnostics.
-
A/B Testing: The Complete Guide — Evan Miller — clear, practical treatments of sample size, metrics, and pitfalls.
Practice questions
- Design a free-month experimentOpenAI · Data Scientist · Technical Screen · hard
- Design and analyze a free-trial A/B testOpenAI · Data Scientist · Technical Screen · hard
- How would you evaluate a free-trial A/B test?OpenAI · Data Scientist · Technical Screen · medium
- Determine Metrics to Measure Free-Trial Impact on SubscriptionsOpenAI · Data Scientist · Online Assessment · medium
- Analyze A/B Test Results for Subscription Conversion RatesOpenAI · Data Scientist · Online Assessment · medium
Related concepts
- Experiment Metric DesignAnalytics & Experimentation
- A/B Testing And Product Metric DiagnosticsAnalytics & Experimentation
- Experimentation, A/B Testing, And Product MetricsBehavioral & Leadership
- Metrics Monitoring And ExperimentationSystem Design
- Experimentation and Metrics DesignMachine Learning
- Product Metric Design And Diagnostic Deep DivesAnalytics & Experimentation