ML Frameworks, Model Compilation, And Parallelism
Asked of: Software Engineer
Last updated
What's being tested
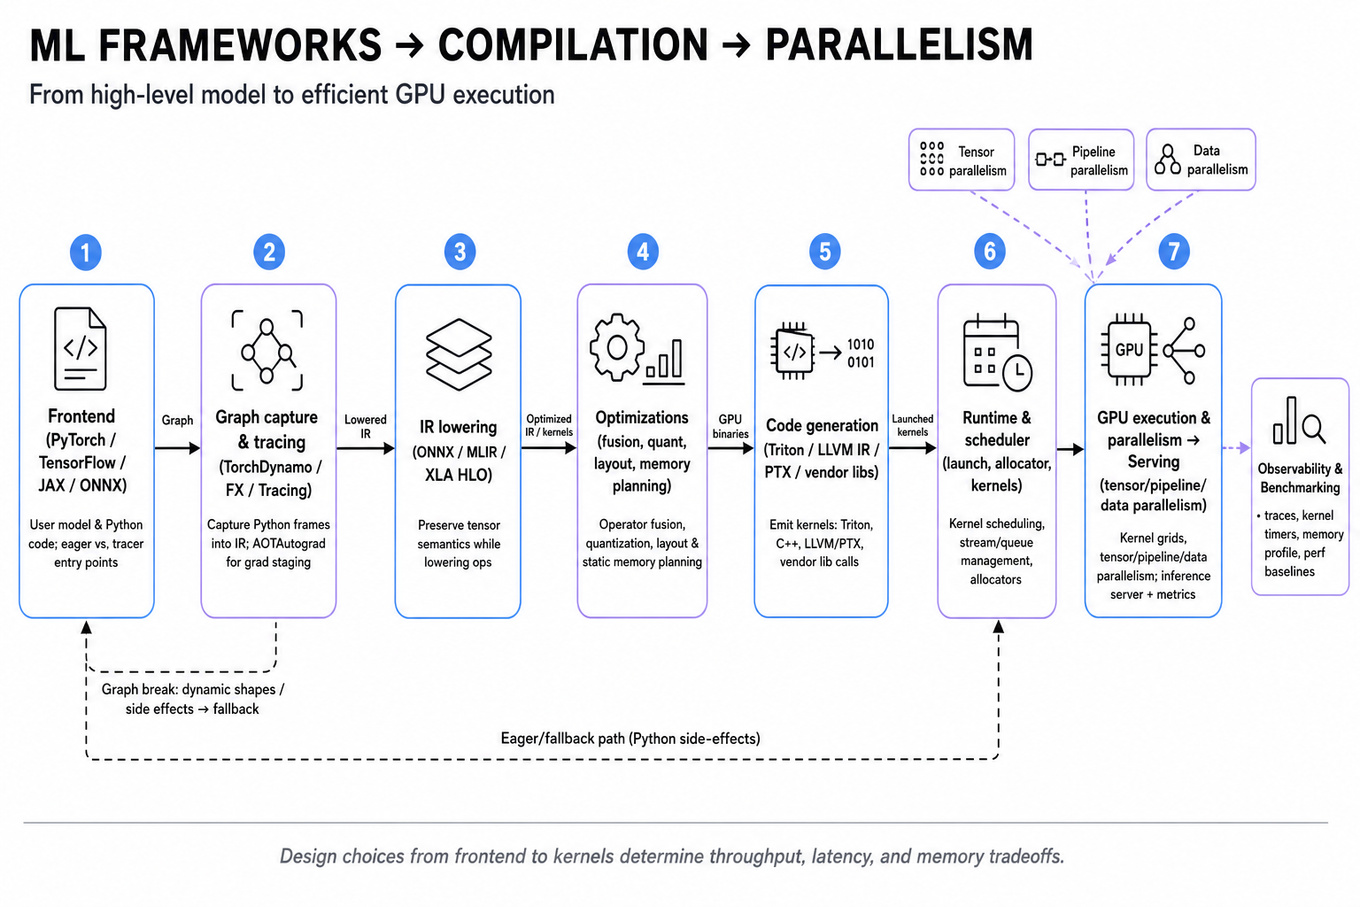
Interviewers are probing whether you understand the software execution path from a high-level model definition to efficient GPU execution, not whether you can invent a new neural architecture. For NVIDIA, this matters because framework runtimes, compilers, kernels, distributed execution, and inference serving all meet at the GPU boundary, where small software design choices can dominate throughput, latency, and memory use. A strong Software Engineer answer connects abstractions like PyTorch, intermediate representations, operator fusion, quantization, tensor parallelism, and pipeline parallelism to concrete runtime tradeoffs. You should be able to reason about bottlenecks, correctness constraints, observability, and benchmarking methodology.
Core knowledge
-
Model execution pipeline usually starts with a frontend representation in
PyTorch,TensorFlow,JAX, orONNX, then moves through graph capture, IR lowering, optimization passes, code generation, runtime scheduling, and GPU kernel launch. A good answer separates user-facing APIs from compiler/runtime internals. -
Eager execution runs operations immediately, which improves debuggability and Python ergonomics but can hide global optimization opportunities. Graph execution captures a computation graph, enabling dead-code elimination, layout planning, fusion, and static memory planning, but must handle dynamic shapes, Python side effects, and fallback paths.
-
In modern
PyTorch,TorchDynamocaptures Python frames into FX graphs,AOTAutogradcan stage forward/backward graphs, andTorchInductorlowers to optimized backends such asTriton,C++, or vendor libraries. The key SWE skill is explaining where graph breaks happen and how fallback affects performance. -
Intermediate representations include framework graphs,
ONNX,MLIR,XLA HLO, and lower-level GPU IR such asLLVM IRorPTX. Higher IRs preserve tensor semantics; lower IRs expose memory, layout, vectorization, and instruction scheduling. Optimization quality depends on information retained across these layers. -
Operator fusion combines adjacent operations, for example
matmul + bias + GELU, reducing global memory traffic and kernel launch overhead. This matters because many neural workloads are memory-bandwidth-bound; reading and writing a tensor repeatedly can cost more than the arithmetic itself. -
GPU kernels execute grids of thread blocks, using registers, shared memory, L2, and HBM. Performance depends on occupancy, memory coalescing, arithmetic intensity, tensor core utilization, and avoiding synchronization. For matrix multiply, optimized libraries like
cuBLAS,cuDNN, andCUTLASSoften beat custom kernels. -
Quantization reduces precision, commonly from
FP32toFP16,BF16,INT8, or lower. It improves memory footprint and throughput but can introduce accuracy loss, calibration requirements, overflow/underflow issues, and backend-specific constraints. For inference,INT8often needs representative calibration data or quantization-aware training. -
Pruning removes weights, channels, or blocks. Unstructured sparsity may reduce parameter count without real speedup unless the hardware and kernels exploit the sparsity pattern. Structured pruning is easier for compilers and GPUs because it preserves dense tensor operations, but it can hurt model quality more.
-
Knowledge distillation trains a smaller student model to mimic a larger teacher. From a SWE systems lens, this is relevant because a smaller model can reduce
p50/p99latency, memory, and serving cost, but it shifts work to the training/evaluation pipeline and requires quality validation by ML stakeholders. -
Transformer self-attention computes queries, keys, and values, typically Systems implications include quadratic sequence-length cost, large activation memory, and opportunities for fused attention kernels such as
FlashAttention. -
Tensor parallelism splits individual tensor operations across devices, often sharding matrix multiplications by rows, columns, or attention heads. It can reduce per-GPU memory and support very large layers, but it introduces frequent collectives such as
all-reduce,all-gather, orreduce-scatter. -
Pipeline parallelism splits model layers across devices and passes microbatches through stages. It reduces memory pressure per device but can suffer from pipeline bubbles, load imbalance, and activation transfer overhead. Throughput improves with enough microbatches, while latency for a single request may worsen.
Tip: When comparing parallelism strategies, always name the communication pattern, the unit of partitioning, and whether the goal is throughput, latency, or fitting the model in memory.
Worked example
For “Describe model-to-GPU execution pipeline”, start by framing the scope: “I’ll assume an inference workload using PyTorch on NVIDIA GPUs, but I’ll call out where training adds autograd and communication.” In the first 30 seconds, ask whether the interviewer wants a framework-level view, compiler internals, or runtime/kernel scheduling; then state that you will walk from Python model code to device execution. Organize the answer into four pillars: frontend capture, IR/graph optimization, lowering/code generation, and runtime execution.
The skeleton answer would begin with model code in PyTorch, where tensors and operations are either executed eagerly or captured by TorchDynamo into an FX graph. Next, the compiler applies optimizations such as constant folding, shape specialization, layout selection, and operator fusion. Then the graph is lowered to backend implementations: library calls like cuBLAS for GEMM, cuDNN for convolutions, generated Triton kernels for fused elementwise/reduction patterns, or custom CUDA kernels. Finally, the runtime manages memory allocation, streams, kernel launches, synchronization, and data movement across host and device.
A concrete tradeoff to flag is static versus dynamic shapes. Specializing to fixed shapes enables better fusion and memory planning, but production inference often sees variable batch sizes and sequence lengths; supporting them can require guards, recompilation caches, padding, bucketing, or fallback to eager execution. Close by saying: “If I had more time, I’d add how I would benchmark this with warmup, CUDA synchronization, p50/p95/p99 latency, throughput, GPU utilization, and memory footprint, because compiler wins must be validated end to end.”
A second angle
For “Explain optimization and tensor vs pipeline parallelism”, the same concepts apply, but the center of gravity shifts from compilation flow to scaling and bottleneck analysis. Start by separating single-device optimization from multi-device parallel execution: quantization, fusion, memory planning, and kernel selection improve the per-GPU baseline before distributing work. Then compare tensor parallelism and pipeline parallelism by partitioning unit: tensor parallelism splits operations inside a layer, while pipeline parallelism splits layers across devices. The main design question is whether the workload is limited by compute, memory capacity, interconnect bandwidth, or latency constraints. A strong answer explicitly mentions that tensor parallelism creates more fine-grained communication, while pipeline parallelism creates scheduling complexity and bubbles.
Common pitfalls
Pitfall: Treating
PyTorch,CUDA, and the GPU as one black box.
A weak answer says “the framework sends the model to the GPU and CUDA runs it.” That misses the actual layers interviewers care about: graph capture, IR transforms, backend selection, kernel launch overhead, memory allocation, streams, synchronization, and library calls. A better answer names each boundary and explains what information is gained or lost at that layer.
Pitfall: Over-indexing on ML architecture details instead of systems tradeoffs.
For Transformer questions, it is tempting to spend five minutes explaining why attention works semantically. For a Software Engineer interview, land the formula briefly, then pivot to systems implications: attention memory, fused attention kernels, KV cache during autoregressive inference, batching tradeoffs, and how sequence length affects latency and memory.
Pitfall: Claiming an optimization is always faster.
Quantization, pruning, fusion, and compilation can all backfire. INT8 can be slower if unsupported kernels force layout conversions; fusion can reduce parallelism or increase register pressure; graph compilation can add startup latency; pipeline parallelism can underutilize GPUs if stages are imbalanced. Strong candidates say what they would measure and what failure mode they would watch.
Connections
Interviewers may pivot into GPU architecture, including warps, tensor cores, shared memory, and memory coalescing. They may also ask about distributed systems concepts behind training and inference, such as collectives, scheduling, fault tolerance, and p99 latency under load. Adjacent topics include CUDA programming, Triton kernel authoring, NCCL communication, and production inference serving with TensorRT, Triton Inference Server, or ONNX Runtime.
Further reading
-
PyTorch 2.0: Our next generation release that is faster, more Pythonic and Dynamic as ever — Practical overview of
TorchDynamo,AOTAutograd, andTorchInductor. -
FlashAttention: Fast and Memory-Efficient Exact Attention with IO-Awareness — Seminal paper connecting Transformer attention performance to GPU memory traffic.
-
Megatron-LM: Training Multi-Billion Parameter Language Models Using Model Parallelism — Useful reference for tensor model parallelism and large-model scaling tradeoffs.
Featured in interview prep guides
Practice questions
- Explain ML compilation optimizations and hardware fitNVIDIA · Software Engineer · Technical Screen · medium
- Explain optimization and tensor vs pipeline parallelismNVIDIA · Software Engineer · Technical Screen · hard
- Explain ML framework trendsNVIDIA · Software Engineer · Technical Screen · hard
- Describe model-to-GPU execution pipelineNVIDIA · Software Engineer · Technical Screen · medium
- Compare deep learning framework trendsNVIDIA · Software Engineer · Technical Screen · medium
- Explain Transformers and QKV matricesNVIDIA · Software Engineer · Technical Screen · medium
- Design and benchmark optimized inference pipelinesNVIDIA · Software Engineer · Technical Screen · medium
Related concepts
- Distributed GPU Computation And Parallel MLML System Design
- ML Fundamentals: Backprop, Attention, And RLMachine Learning
- Production ML Systems, Evaluation, And SafetyML System Design
- Distributed Training Parallelism And CollectivesML System Design
- ML Inference APIs And GPU BatchingML System Design
- ML Model Evaluation, Metrics, And ExperimentationML System Design