NVIDIA Software Engineer Interview Prep Guide
Everything NVIDIA actually asks Software Engineer candidates — concept walkthroughs, worked examples, and the real interview questions, drawn from candidate reports. Free to read.
Last updated
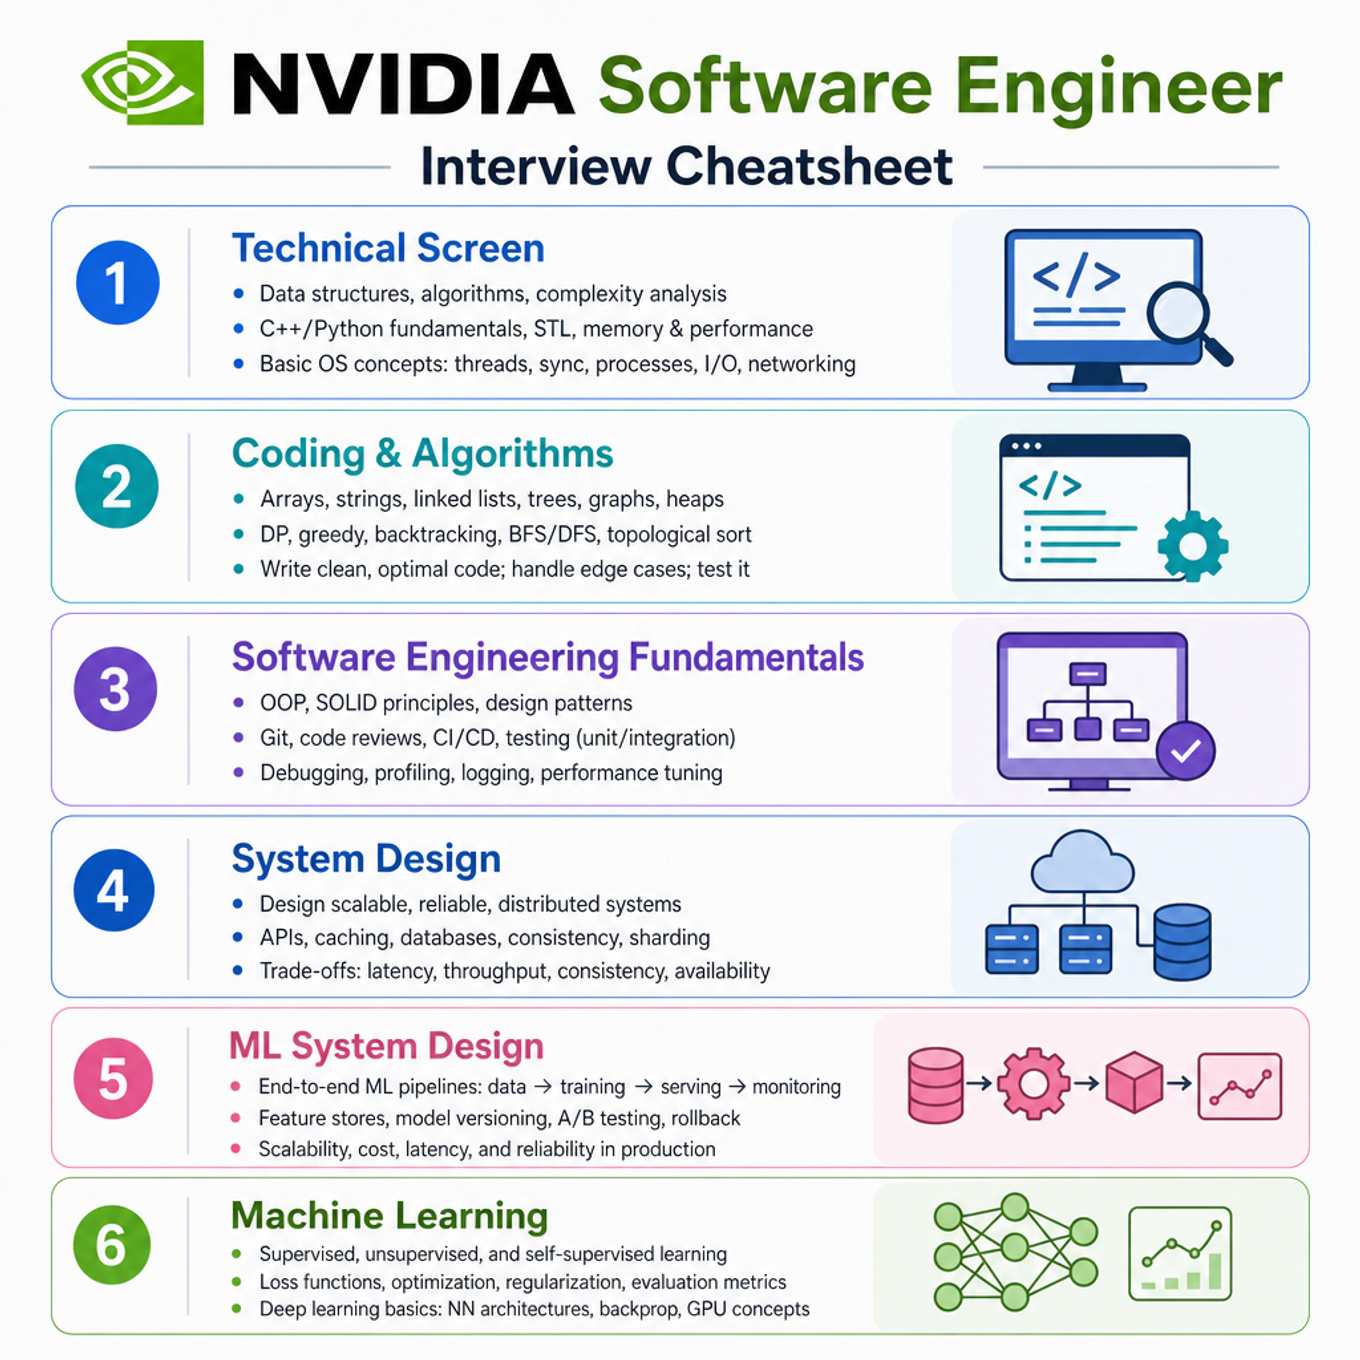
Technical Screen
Coding & Algorithms
- Core Data Structures, Algorithms, And Complexity — covered in depth under Take-home Project below.
Software Engineering Fundamentals
- C++ Systems, Memory, Concurrency, And Virtualization — covered in depth under Onsite below.
System Design
What's being tested
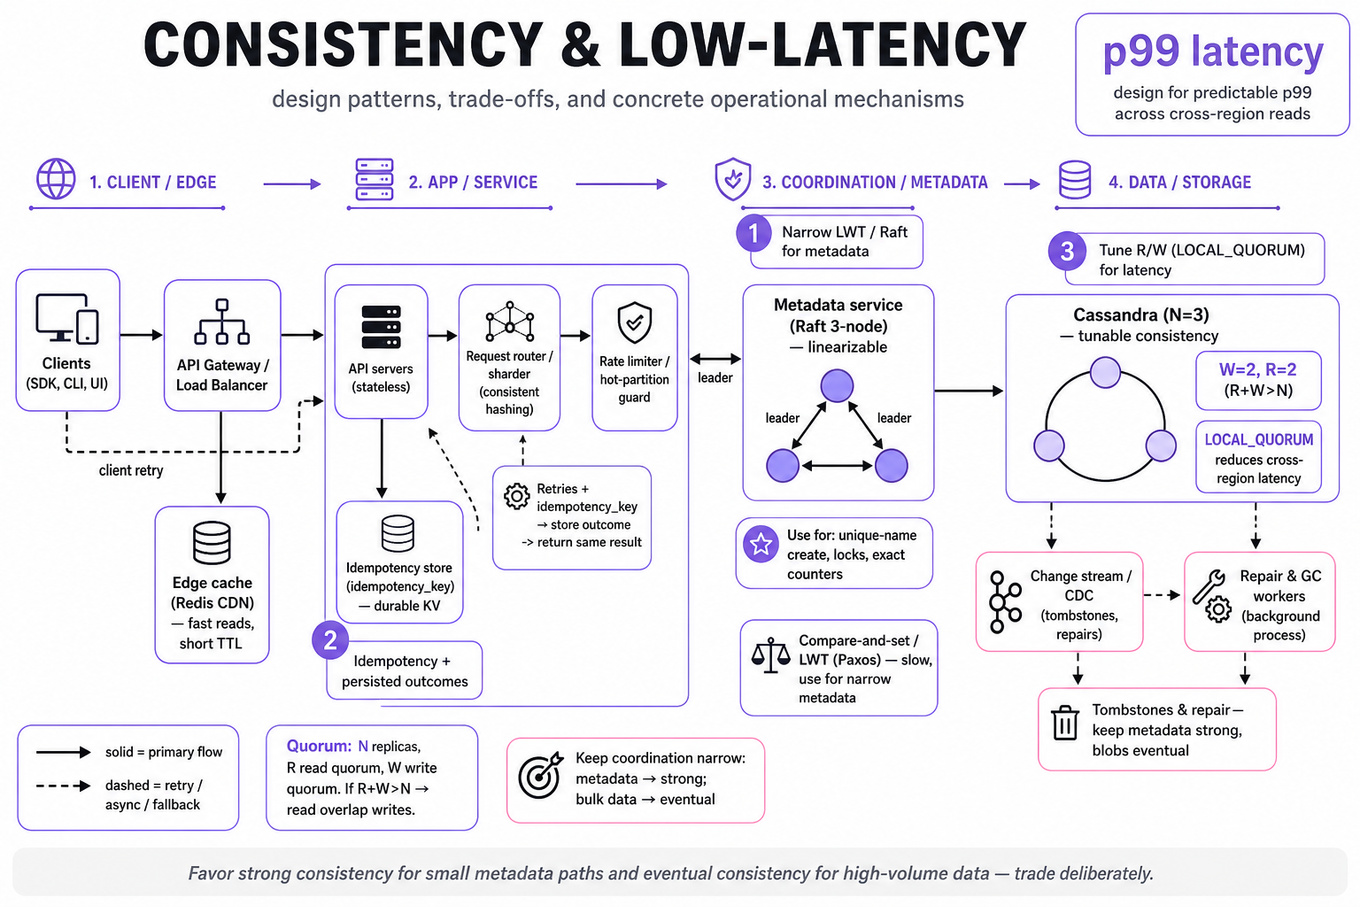
Interviewers are probing whether you can design distributed services that make explicit tradeoffs between consistency, availability, latency, and operational simplicity. The shared skill is not drawing boxes; it is choosing where correctness must be strong, where eventual convergence is acceptable, and how retries, failures, and concurrency affect real users. NVIDIA cares because many software systems around GPU clusters, artifact management, model serving, telemetry, and control planes need predictable p99 latency while operating across many nodes. Expect the interviewer to push on concrete mechanisms: idempotency keys, quorum reads/writes, leader election, compare-and-set, tombstones, hot partitions, and failure-mode behavior.
Core knowledge
-
CAP theorem is a design constraint, not an excuse. Under network partition, a replicated system must choose between availability and linearizable consistency; most production designs choose strong consistency for small metadata paths and eventual consistency for high-volume data paths.
-
Linearizability means every operation appears to occur atomically at one point between request and response. It is usually required for unique-name creation, account debits, distributed locks, and exact counters, but it costs coordination through
Raft,Paxos, database transactions, or conditional writes. -
Quorum replication uses read quorum and write quorum over replicas. If , reads overlap writes and can observe the latest committed value, assuming correct conflict resolution; common settings are .
-
Cassandra consistency is tunable, but not magically transactional.
QUORUMreads/writes improve freshness;LOCAL_QUORUMlimits cross-region latency; lightweight transactions usingPaxosprovide compare-and-set semantics but are much slower and should be reserved for narrow metadata operations. -
Idempotency is mandatory when clients retry after timeout. Use a client-generated
idempotency_key, persist request outcome, and return the same result for duplicate submissions; do not rely on “the client probably won’t retry” for creates, deletes, payments, or counter increments. -
Compare-and-set is the standard primitive for concurrent creation. For an artifact named
foo, write a row keyed by normalized name with conditionIF NOT EXISTS; if it fails, return conflict. Avoid read-then-write because two clients can both observe absence. -
Soft deletes preserve correctness for races and auditability. A deleted artifact can be represented with
deleted_at,version, and optionalttl; hard deletion in stores likeCassandracreates tombstones that can harm read latency if overused or queried through wide partitions. -
Counters are deceptively hard. An exact global counter requires serialization through a leader, shard ownership protocol, or consensus; an eventually consistent counter can use CRDT structures such as a G-counter or PN-counter, trading exact real-time reads for mergeability.
-
Low-latency design starts with a budget. For a
50msservice-level objective, allocate roughly:5msingress,5–10msfeature/cache reads,10–20mscompute or model call,5msdownstream decision write, and leave headroom for network jitter and garbage collection. -
Tail latency dominates user experience. If a request fans out to independent services with each dependency at
p99 = 20ms, the overallp99is worse than any single dependency. Reduce fanout, use request hedging carefully, cache hot data, and enforce deadlines. -
Backpressure protects latency under overload. Use bounded queues, admission control, token buckets, circuit breakers, and graceful degradation. A low-latency fraud service should return a conservative fallback decision before its deadline rather than timing out every caller.
-
Observability must separate correctness from performance. Track
p50,p95,p99, timeout rate, retry rate, duplicate-idempotency hits, conditional-write conflicts, stale-read rate, tombstone scan warnings, leader changes, and replication lag.
Worked example
For Design an artifact store on K8s and Cassandra, a strong candidate would first frame the problem by asking: are artifact names globally unique or namespace-scoped, are artifacts immutable after upload, what object sizes are expected, and what consistency is required after create/delete? A reasonable assumption is that binary blobs live in object storage such as S3, GCS, or an internal blob store, while Cassandra stores metadata: name, owner, version, content hash, state, timestamps, and blob pointer.
The answer can be organized around four pillars: API semantics, metadata schema, consistency model, and failure handling. For API semantics, define CreateArtifact(name, idempotency_key, metadata), GetArtifact(name), DeleteArtifact(name), and possibly ListArtifacts(namespace). For metadata, avoid a single giant partition; partition by namespace or tenant, and maintain a uniqueness row keyed by canonical artifact name if uniqueness must be enforced. For consistency, use Cassandra lightweight transactions only on the uniqueness row: INSERT ... IF NOT EXISTS, then write the metadata row and blob pointer with an idempotent workflow.
The important tradeoff to call out is that using LWT for every metadata update gives simpler semantics but poor throughput and higher tail latency; using it only for create-name reservation keeps the critical invariant strong while allowing normal reads and writes to use LOCAL_QUORUM. Deletes should be modeled as state transitions: ACTIVE -> DELETING -> DELETED, with soft-delete markers and asynchronous blob cleanup, because a crash between metadata delete and blob delete can otherwise create leaks or broken references. The close should mention: “If I had more time, I’d discuss compaction strategy, tombstone pressure, multi-region reads, and a reconciliation job that scans for orphaned blobs or dangling metadata.”
A second angle
For Design real-time fraud detection under 50ms, the same consistency-and-latency reasoning applies, but the correctness boundary shifts. The service usually does not need linearizable global state for every request; it needs a reliable decision within a deadline. Strong consistency may be necessary for idempotent transaction decisions, recent account-block state, or velocity counters that prevent obvious abuse, while many features can be eventually consistent or cached. The design should emphasize an in-memory feature cache such as Redis or local process cache, precomputed aggregates, strict deadlines, and fallback policies. The key difference is that stale data may be acceptable if the decision engine returns within 50ms, whereas an artifact uniqueness violation is usually not acceptable even if latency is lower.
Common pitfalls
Pitfall: Treating “distributed” as “put it behind a load balancer.”
A tempting but weak answer is to say Kubernetes replicas plus Cassandra replication solve reliability. That misses the real issue: concurrent clients can create the same name, retry the same operation, or observe stale deletes unless you define conditional writes, idempotency, and read consistency.
Pitfall: Optimizing average latency instead of tail latency.
Saying “the model call is only 10ms on average” is not enough for a 50ms decisioning service. Interviewers want to hear deadline propagation, bounded fanout, p99 measurement, cache hit rate, timeout budgets, and what the system returns when dependencies are slow.
Pitfall: Overusing strong consistency everywhere.
A common depth mistake is proposing consensus for every request, every counter update, or every artifact read. A better answer isolates the invariant: use strong coordination for unique names, exact balance-like updates, or idempotency records; use eventual consistency, caching, batching, or CRDT-style merging where exact immediate reads are not required.
Connections
Interviewers may pivot from here into leader election, distributed locking, cache invalidation, rate limiting, or database indexing and partitioning. They may also ask how your design changes across regions, where LOCAL_QUORUM, asynchronous replication, failover policy, and stale-read tolerance become central.
Further reading
-
Designing Data-Intensive Applications — Martin Kleppmann — Best practical foundation for replication, partitioning, consistency, transactions, and stream processing tradeoffs.
-
Dynamo: Amazon’s Highly Available Key-value Store — Seminal paper on quorum, vector clocks, sloppy replication, and eventually consistent storage.
-
Spanner: Google’s Globally-Distributed Database — Useful contrast for globally consistent transactions and the latency cost of stronger guarantees.
Practice questions
-
CI/CD, Release Engineering, And GPU Test Infrastructure — covered in depth under Take-home Project below.
-
GPU Programming, Graphics APIs, And Shader Compilers — covered in depth under Take-home Project below.
ML System Design
What's being tested
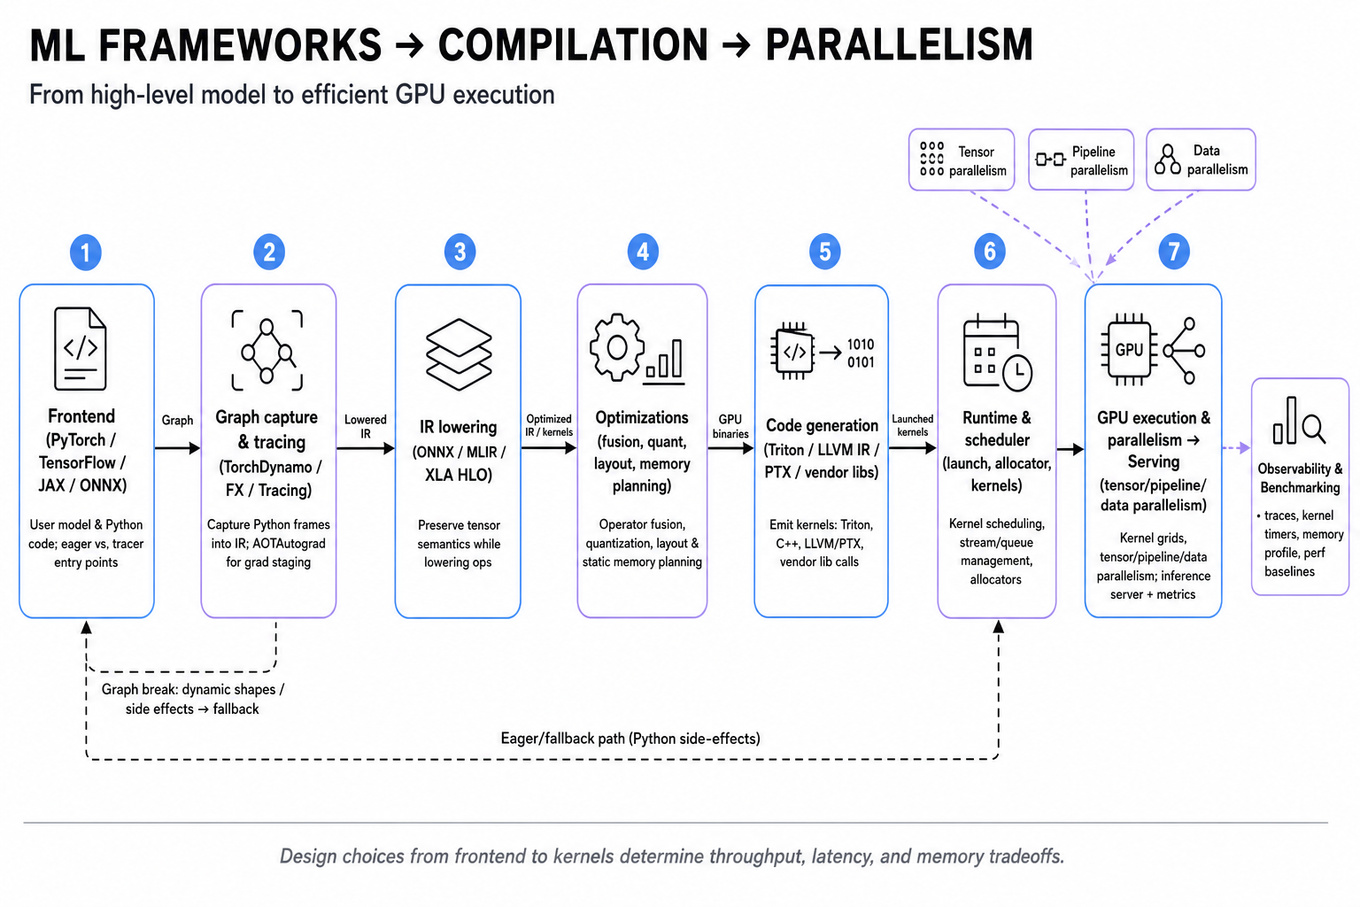
Interviewers are probing whether you understand the software execution path from a high-level model definition to efficient GPU execution, not whether you can invent a new neural architecture. For NVIDIA, this matters because framework runtimes, compilers, kernels, distributed execution, and inference serving all meet at the GPU boundary, where small software design choices can dominate throughput, latency, and memory use. A strong Software Engineer answer connects abstractions like PyTorch, intermediate representations, operator fusion, quantization, tensor parallelism, and pipeline parallelism to concrete runtime tradeoffs. You should be able to reason about bottlenecks, correctness constraints, observability, and benchmarking methodology.
Core knowledge
-
Model execution pipeline usually starts with a frontend representation in
PyTorch,TensorFlow,JAX, orONNX, then moves through graph capture, IR lowering, optimization passes, code generation, runtime scheduling, and GPU kernel launch. A good answer separates user-facing APIs from compiler/runtime internals. -
Eager execution runs operations immediately, which improves debuggability and Python ergonomics but can hide global optimization opportunities. Graph execution captures a computation graph, enabling dead-code elimination, layout planning, fusion, and static memory planning, but must handle dynamic shapes, Python side effects, and fallback paths.
-
In modern
PyTorch,TorchDynamocaptures Python frames into FX graphs,AOTAutogradcan stage forward/backward graphs, andTorchInductorlowers to optimized backends such asTriton,C++, or vendor libraries. The key SWE skill is explaining where graph breaks happen and how fallback affects performance. -
Intermediate representations include framework graphs,
ONNX,MLIR,XLA HLO, and lower-level GPU IR such asLLVM IRorPTX. Higher IRs preserve tensor semantics; lower IRs expose memory, layout, vectorization, and instruction scheduling. Optimization quality depends on information retained across these layers. -
Operator fusion combines adjacent operations, for example
matmul + bias + GELU, reducing global memory traffic and kernel launch overhead. This matters because many neural workloads are memory-bandwidth-bound; reading and writing a tensor repeatedly can cost more than the arithmetic itself. -
GPU kernels execute grids of thread blocks, using registers, shared memory, L2, and HBM. Performance depends on occupancy, memory coalescing, arithmetic intensity, tensor core utilization, and avoiding synchronization. For matrix multiply, optimized libraries like
cuBLAS,cuDNN, andCUTLASSoften beat custom kernels. -
Quantization reduces precision, commonly from
FP32toFP16,BF16,INT8, or lower. It improves memory footprint and throughput but can introduce accuracy loss, calibration requirements, overflow/underflow issues, and backend-specific constraints. For inference,INT8often needs representative calibration data or quantization-aware training. -
Pruning removes weights, channels, or blocks. Unstructured sparsity may reduce parameter count without real speedup unless the hardware and kernels exploit the sparsity pattern. Structured pruning is easier for compilers and GPUs because it preserves dense tensor operations, but it can hurt model quality more.
-
Knowledge distillation trains a smaller student model to mimic a larger teacher. From a SWE systems lens, this is relevant because a smaller model can reduce
p50/p99latency, memory, and serving cost, but it shifts work to the training/evaluation pipeline and requires quality validation by ML stakeholders. -
Transformer self-attention computes queries, keys, and values, typically Systems implications include quadratic sequence-length cost, large activation memory, and opportunities for fused attention kernels such as
FlashAttention. -
Tensor parallelism splits individual tensor operations across devices, often sharding matrix multiplications by rows, columns, or attention heads. It can reduce per-GPU memory and support very large layers, but it introduces frequent collectives such as
all-reduce,all-gather, orreduce-scatter. -
Pipeline parallelism splits model layers across devices and passes microbatches through stages. It reduces memory pressure per device but can suffer from pipeline bubbles, load imbalance, and activation transfer overhead. Throughput improves with enough microbatches, while latency for a single request may worsen.
Tip: When comparing parallelism strategies, always name the communication pattern, the unit of partitioning, and whether the goal is throughput, latency, or fitting the model in memory.
Worked example
For “Describe model-to-GPU execution pipeline”, start by framing the scope: “I’ll assume an inference workload using PyTorch on NVIDIA GPUs, but I’ll call out where training adds autograd and communication.” In the first 30 seconds, ask whether the interviewer wants a framework-level view, compiler internals, or runtime/kernel scheduling; then state that you will walk from Python model code to device execution. Organize the answer into four pillars: frontend capture, IR/graph optimization, lowering/code generation, and runtime execution.
The skeleton answer would begin with model code in PyTorch, where tensors and operations are either executed eagerly or captured by TorchDynamo into an FX graph. Next, the compiler applies optimizations such as constant folding, shape specialization, layout selection, and operator fusion. Then the graph is lowered to backend implementations: library calls like cuBLAS for GEMM, cuDNN for convolutions, generated Triton kernels for fused elementwise/reduction patterns, or custom CUDA kernels. Finally, the runtime manages memory allocation, streams, kernel launches, synchronization, and data movement across host and device.
A concrete tradeoff to flag is static versus dynamic shapes. Specializing to fixed shapes enables better fusion and memory planning, but production inference often sees variable batch sizes and sequence lengths; supporting them can require guards, recompilation caches, padding, bucketing, or fallback to eager execution. Close by saying: “If I had more time, I’d add how I would benchmark this with warmup, CUDA synchronization, p50/p95/p99 latency, throughput, GPU utilization, and memory footprint, because compiler wins must be validated end to end.”
A second angle
For “Explain optimization and tensor vs pipeline parallelism”, the same concepts apply, but the center of gravity shifts from compilation flow to scaling and bottleneck analysis. Start by separating single-device optimization from multi-device parallel execution: quantization, fusion, memory planning, and kernel selection improve the per-GPU baseline before distributing work. Then compare tensor parallelism and pipeline parallelism by partitioning unit: tensor parallelism splits operations inside a layer, while pipeline parallelism splits layers across devices. The main design question is whether the workload is limited by compute, memory capacity, interconnect bandwidth, or latency constraints. A strong answer explicitly mentions that tensor parallelism creates more fine-grained communication, while pipeline parallelism creates scheduling complexity and bubbles.
Common pitfalls
Pitfall: Treating
PyTorch,CUDA, and the GPU as one black box.
A weak answer says “the framework sends the model to the GPU and CUDA runs it.” That misses the actual layers interviewers care about: graph capture, IR transforms, backend selection, kernel launch overhead, memory allocation, streams, synchronization, and library calls. A better answer names each boundary and explains what information is gained or lost at that layer.
Pitfall: Over-indexing on ML architecture details instead of systems tradeoffs.
For Transformer questions, it is tempting to spend five minutes explaining why attention works semantically. For a Software Engineer interview, land the formula briefly, then pivot to systems implications: attention memory, fused attention kernels, KV cache during autoregressive inference, batching tradeoffs, and how sequence length affects latency and memory.
Pitfall: Claiming an optimization is always faster.
Quantization, pruning, fusion, and compilation can all backfire. INT8 can be slower if unsupported kernels force layout conversions; fusion can reduce parallelism or increase register pressure; graph compilation can add startup latency; pipeline parallelism can underutilize GPUs if stages are imbalanced. Strong candidates say what they would measure and what failure mode they would watch.
Connections
Interviewers may pivot into GPU architecture, including warps, tensor cores, shared memory, and memory coalescing. They may also ask about distributed systems concepts behind training and inference, such as collectives, scheduling, fault tolerance, and p99 latency under load. Adjacent topics include CUDA programming, Triton kernel authoring, NCCL communication, and production inference serving with TensorRT, Triton Inference Server, or ONNX Runtime.
Further reading
-
PyTorch 2.0: Our next generation release that is faster, more Pythonic and Dynamic as ever — Practical overview of
TorchDynamo,AOTAutograd, andTorchInductor. -
FlashAttention: Fast and Memory-Efficient Exact Attention with IO-Awareness — Seminal paper connecting Transformer attention performance to GPU memory traffic.
-
Megatron-LM: Training Multi-Billion Parameter Language Models Using Model Parallelism — Useful reference for tensor model parallelism and large-model scaling tradeoffs.
Practice questions
What's being tested
Interviewers are probing whether you can reason about ML inference performance as a systems problem: memory bandwidth, launch overhead, GPU occupancy, compiler lowering, and hardware fit. For NVIDIA, this matters because small framework-level choices can determine whether a model fully uses CUDA cores, Tensor Cores, memory hierarchy, and interconnect bandwidth. A strong Software Engineer answer should connect high-level operators from PyTorch or TensorFlow to lower-level execution: graph capture, compiler IR, scheduling, layout, tiling, and runtime benchmarking. The goal is not to invent a new neural architecture; it is to explain how to make an existing model execute faster, cheaper, and more predictably on GPU hardware.
Core knowledge
-
Kernel fusion combines multiple adjacent operations into one GPU kernel to reduce kernel launch overhead, avoid intermediate global-memory writes, and improve cache/register reuse. Common examples include
bias + activation,matmul + bias + GELU,layernormvariants, and elementwise chains likeadd -> relu -> dropout. -
Memory bandwidth is often the bottleneck for elementwise and normalization-heavy workloads. A simple unfused chain may read and write tensors multiple times; fusion can reduce traffic from roughly reads/writes to closer to one streaming pass, improving arithmetic intensity:
-
Kernel launch overhead is nontrivial for small tensors or many tiny operators. Even if each individual kernel is fast, launching hundreds of kernels per inference request adds latency. Fusion helps most when the workload has many small memory-bound ops rather than one dominant compute-bound
GEMM. -
Operator fusion has limits. Fusing too much can increase register pressure, reduce occupancy, hurt instruction cache behavior, or prevent reuse of highly optimized library kernels like
cuBLAS,cuDNN, orCUTLASS. A strong answer says “fuse cheap surrounding ops into expensive kernels when profitable,” not “fuse everything.” -
ML compilation stacks typically move from eager framework code to graph capture, IR optimization, code generation, and runtime execution. In
PyTorch 2.x,TorchDynamocaptures Python frames,AOTAutogradhandles ahead-of-time graph extraction, andTorchInductorlowers graphs to generatedTritonorC++kernels. -
Graph breaks are a practical failure mode. Dynamic Python control flow, data-dependent shapes, unsupported ops, mutation, or custom extensions can prevent compilation and fusion. In an interview, mention inspecting compiler logs, generated kernels, and fallback paths rather than assuming the whole model compiles.
-
Layout selection affects fusion and hardware utilization. Formats like
NCHW,NHWC, blocked layouts, or tensor-core-friendly tiling determine coalesced memory access and vectorization. For NVIDIA GPUs, dimensions aligned to multiples such as 8, 16, or 32 often matter forTensor Coreefficiency, depending on dtype and architecture. -
Tiling and scheduling decide how work maps to threads, warps, shared memory, and registers. For matrix-like operations, good tiling maximizes data reuse and coalesced loads; for reductions, scheduling must handle parallel reduction, synchronization, and numerical behavior. Poor tiling can erase the benefit of fusion.
-
Quantization and fusion interact.
INT8orFP8inference may fuse dequantization, matrix multiply, scaling, bias, and activation to avoid extra conversions. But quantized pipelines require careful calibration, supported hardware instructions, and validation that accuracy and latency both improve. -
Memory planning reduces allocation overhead and peak memory by reusing buffers whose lifetimes do not overlap. Compilers can perform liveness analysis across a static graph; dynamic shapes make this harder. For inference services, lower peak memory can increase batch capacity and reduce
p99latency spikes from allocator pressure. -
Benchmarking must separate warmup, compilation time, steady-state latency, throughput, and tail latency. Use
torch.compile,CUDA Graphs, orTensorRT-style engines carefully: first-run compile/build time may be irrelevant for long-running services but unacceptable for cold-start workloads. -
Parallelism choices are adjacent but distinct. Tensor parallelism splits individual tensor operations across GPUs, often requiring collectives like
all-reduce; pipeline parallelism splits layers across stages, improving model capacity but introducing bubbles. Fusion primarily optimizes local execution, while parallelism addresses model size and multi-GPU throughput.
Worked example
For “Design and benchmark optimized inference pipelines”, start by framing the workload: “I’d first ask about model type, batch-size range, latency SLO, target GPU, precision constraints, dynamic shapes, and whether this is online serving or offline batch inference.” Then declare an assumption, such as “we have a PyTorch transformer-like model deployed on NVIDIA GPUs with strict p50 and p99 latency targets.” Organize the answer around four pillars: graph capture/compilation, kernel-level optimizations, runtime serving configuration, and measurement methodology.
For graph capture, mention trying torch.compile with TorchInductor, checking graph breaks, and validating generated Triton kernels or fallback eager ops. For kernel-level optimization, describe fusing elementwise chains, fusing bias + GELU, using optimized attention kernels where applicable, choosing FP16, BF16, INT8, or FP8 based on accuracy and hardware, and avoiding unnecessary host-device synchronization. For runtime, discuss batching strategy, CUDA Graphs for stable shapes, memory preallocation, and pinned host memory if requests involve CPU-GPU transfer.
A specific tradeoff to flag: aggressive dynamic batching can improve throughput but may worsen p99 latency; for online inference, you might cap queue delay or maintain separate engines for common shape buckets. Close by saying you would compare eager PyTorch, torch.compile, TensorRT, and possibly custom Triton kernels using identical inputs, warmups, synchronization, and profiler traces. If you had more time, you would add production observability: per-stage latency, GPU utilization, memory bandwidth counters, kernel timeline analysis, and regression tests for accuracy drift after quantization.
A second angle
For “Explain ML compilation optimizations and hardware fit”, the same concept is less about designing a full serving pipeline and more about explaining how compiler transformations map to GPU realities. Start from the model graph and walk downward: canonicalization, constant folding, dead-code elimination, fusion, layout propagation, memory planning, scheduling, and code generation. The constraint is that every compiler optimization should be tied to hardware effects: fewer global-memory round trips, better coalescing, higher occupancy, fewer launches, or use of Tensor Cores. A good answer also names when compiler automation is insufficient: custom ops, unstable dynamic shapes, numerically sensitive reductions, or cases where library kernels outperform generated fused kernels. This framing shows you understand not just what fusion is, but why a compiler may or may not legally and profitably apply it.
Common pitfalls
Pitfall: Saying “kernel fusion always makes inference faster.”
This is analytically wrong because fusion can increase register usage, reduce occupancy, block use of cuBLAS/cuDNN, or duplicate computation across branches. A better answer is to describe a cost model: fuse memory-bound producer-consumer chains when intermediate tensors are large or launch overhead dominates, but benchmark against optimized vendor kernels.
Pitfall: Staying at framework buzzword level.
Answers like “use torch.compile, TensorRT, and quantization” sound shallow if you cannot explain what changes at runtime. Land better by tracing one operator chain, such as matmul -> bias -> GELU -> dropout, and explaining which part remains a library GEMM, which part can be fused, and how memory traffic changes.
Pitfall: Ignoring measurement correctness.
A tempting but weak benchmark is timing Python code with time.time() around asynchronous GPU calls. A stronger answer mentions warmup, torch.cuda.synchronize(), CUDA events, fixed seeds and inputs, separate compile/build time from steady state, and reports both latency distribution and throughput under realistic batch sizes.
Connections
Interviewers may pivot from fusion into quantization, GPU memory hierarchy, distributed model parallelism, or compiler IR design. Be ready to compare TorchInductor, Triton, TensorRT, XLA, and TVM at a high level, especially how they represent graphs, lower ops, and decide whether an optimization is legal and profitable.
Further reading
-
PyTorch 2.0: Our next generation release that is faster, more Pythonic and Dynamic as ever — useful overview of
TorchDynamo,AOTAutograd, andTorchInductor. -
NVIDIA TensorRT Developer Guide — practical reference for inference optimization, precision modes, engine building, and layer fusion.
-
Triton: An Intermediate Language and Compiler for Tiled Neural Network Computations — explains the programming model behind many generated GPU kernels.
Practice questions
Machine Learning
What's being tested
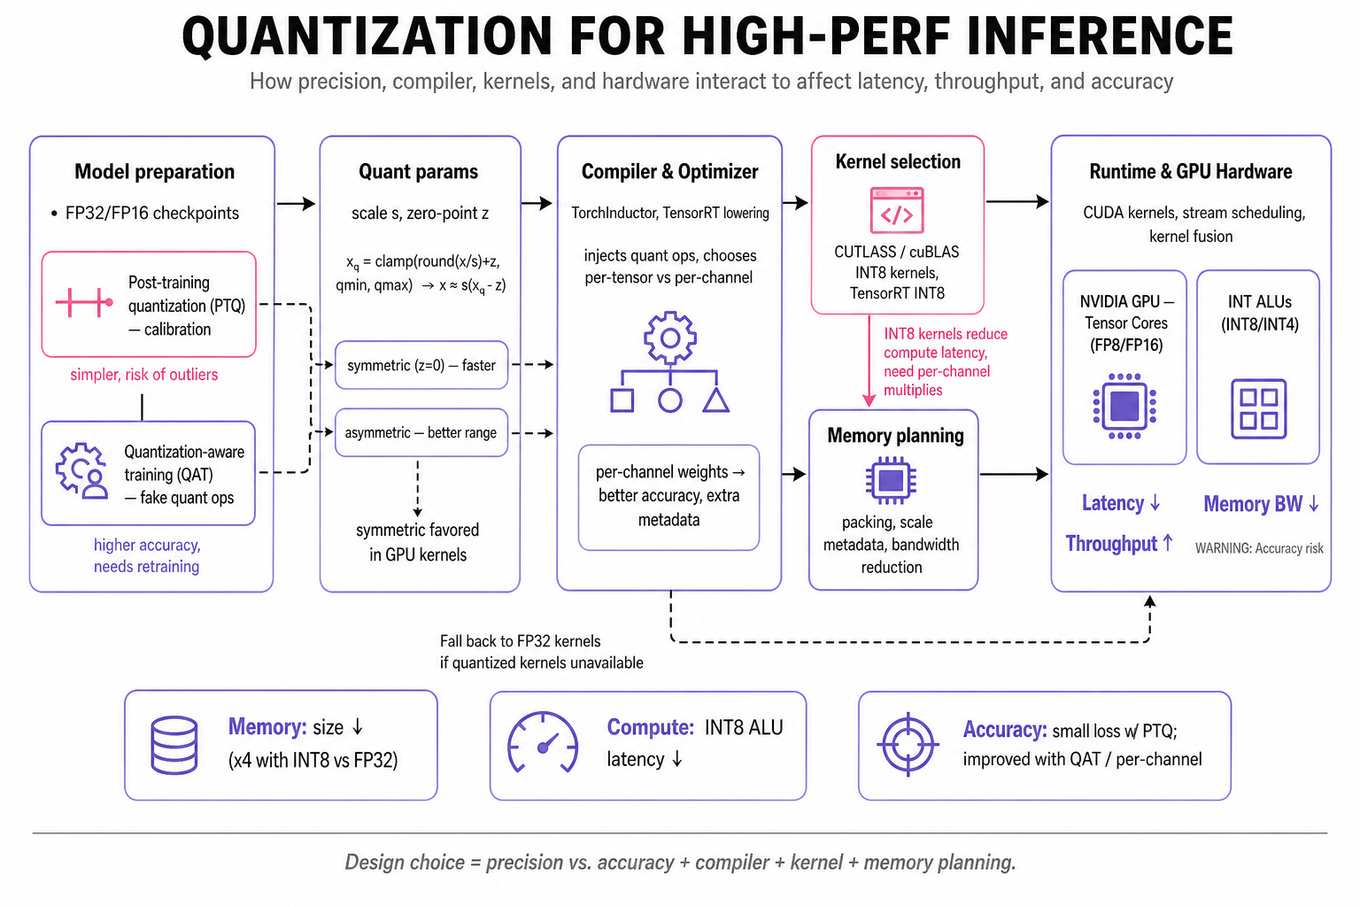
Interviewers are probing whether you can reason about quantization as a systems optimization, not just define “INT8 instead of FP32.” For a Software Engineer at NVIDIA, this means understanding how lower-precision arithmetic affects latency, throughput, memory bandwidth, kernel selection, compiler lowering, and GPU hardware utilization. You should be able to explain where quantization fits alongside kernel fusion, memory planning, operator scheduling, and parallelism strategies such as tensor parallelism and pipeline parallelism. The strongest answers connect the model-level idea to concrete runtime behavior in systems like TensorRT, PyTorch, TorchInductor, CUDA, and modern NVIDIA GPUs.
Core knowledge
-
Quantization maps high-precision tensors, typically
FP32orFP16, into lower-precision representations such asINT8,INT4,FP8, or binary formats. The goal is to reduce memory footprint and bandwidth while using faster hardware instructions where available. -
The basic affine mapping is where is the scale and is the zero-point. Dequantization approximates the original value as
-
Symmetric quantization uses zero-point , often simpler and faster for GPU kernels. Asymmetric quantization better represents ranges not centered around zero but adds arithmetic overhead. For high-throughput inference kernels, symmetric per-channel weight quantization is often preferred.
-
Per-tensor quantization uses one scale for an entire tensor; per-channel quantization uses separate scales per output channel, commonly improving accuracy for convolution and matrix multiply weights. Per-channel scaling costs extra metadata and arithmetic but is usually worthwhile for weights.
-
Post-training quantization converts an already trained model using calibration data. It is operationally simpler but can hurt accuracy when activation distributions are outlier-heavy. Quantization-aware training simulates quantization during training and usually preserves quality better, though it requires access to training code and retraining infrastructure.
-
Calibration estimates activation ranges using representative inputs. Common strategies include min/max clipping, percentile clipping, and KL-divergence calibration as used in tools like
TensorRT. A bad calibration set can produce excellent microbenchmarks but poor real-world output quality. -
Dynamic quantization computes activation scales at runtime, which can improve robustness for variable inputs but adds overhead. Static quantization precomputes scales from calibration, enabling more compiler optimization and generally better inference latency.
-
Hardware support matters.
NVIDIATensor Cores accelerate matrix operations for formats such asFP16,BF16,TF32,INT8, and on newer architecturesFP8. A quantized model is only faster if the compiler/runtime lowers it to kernels that actually use those hardware paths. -
Quantization mainly helps when the workload is memory-bandwidth-bound or uses matmul/convolution kernels with optimized low-precision implementations. It may not help small batch sizes, irregular operators, control-heavy graphs, or pipelines dominated by preprocessing, tokenization, CPU-GPU transfers, or synchronization.
-
In ML compilers, quantization interacts with graph rewriting. Patterns like
quantize -> matmul -> dequantizemay be fused into a single quantized GEMM. Poor graph boundaries, unsupported operators, or layout conversions can erase expected wins by inserting extraQ/DQ,cast, ortransposenodes. -
Benchmarking must separate end-to-end latency, kernel time, throughput, memory usage, and accuracy/quality regression. For serving, report warmup behavior, batch size, sequence length,
p50/p95/p99, GPU utilization, memory bandwidth, and whether measurements include host-device transfer. -
Quantization is not a replacement for parallelism. Tensor parallelism splits large tensor operations across GPUs, while pipeline parallelism splits model layers into stages. Quantization reduces per-GPU memory and communication volume, but it introduces scale handling and possible dequantization boundaries that must be considered.
Worked example
For “Design and benchmark optimized inference pipelines”, a strong candidate would first frame the problem around workload shape: “Am I optimizing a transformer, CNN, or mixed operator graph; what are the batch sizes, latency targets, GPU type, and acceptable quality regression?” They would state an assumption, such as targeting offline or online inference on NVIDIA GPUs with a PyTorch model exported through torch.compile, ONNX, or TensorRT.
The answer skeleton should have four pillars: first, establish a reliable baseline with FP16 or BF16; second, apply graph-level optimizations such as operator fusion, layout selection, and static memory planning; third, evaluate quantization choices like INT8, FP8, per-channel weights, and calibration strategy; fourth, benchmark with production-like inputs and report both performance and correctness metrics.
A strong candidate would explicitly mention that quantization is only beneficial if the runtime emits optimized kernels, for example INT8 Tensor Core GEMMs rather than quantizing tensors and then falling back to slower generic kernels. They would also flag the tradeoff between static calibration and dynamic activation scaling: static calibration enables better compiler optimization, but dynamic scaling can handle distribution shifts at runtime.
For benchmarking, they would avoid a single “tokens/sec” or “images/sec” number and instead compare warm versus steady-state latency, GPU utilization, memory footprint, and any inserted cast or dequantization operations in the compiled graph. They might inspect generated graphs from TorchDynamo, TorchInductor, or TensorRT engine logs to verify the expected low-precision path.
A good close would be: “If I had more time, I’d add A/B validation against representative traffic, inspect unsupported operators causing precision fallbacks, and test whether kernel fusion or batching gives larger gains than quantization alone.”
A second angle
For “Explain ML compilation optimizations and hardware fit”, the same concept is framed less as a deployment pipeline and more as compiler lowering. Here, the interviewer wants to know whether you understand how a high-level graph becomes hardware-efficient GPU code. Quantization is one pass among many: the compiler must choose layouts, fold constants, fuse Q/DQ patterns, tile matrix operations, allocate memory buffers, and schedule kernels to match Tensor Core capabilities. The key difference is that the answer should emphasize representation and lowering decisions rather than only benchmarking outcomes. A strong response would explain that an INT8 graph is not inherently fast; it becomes fast when the compiler can legally transform it into fused, tiled, low-precision kernels with minimal format conversions.
Common pitfalls
Pitfall: Treating quantization as a guaranteed 4x speedup because
INT8is four times smaller thanFP32.
This ignores bottlenecks. If the pipeline is dominated by CPU preprocessing, memory copies, unsupported operators, synchronization, or small GEMMs with poor occupancy, lower precision may give little benefit. A better answer says quantization reduces memory bandwidth and can unlock specialized hardware instructions, but speedup depends on kernel coverage and end-to-end profiling.
Pitfall: Explaining only accuracy tradeoffs and ignoring systems effects.
For a Software Engineer interview, don’t spend the whole answer on model quality, loss curves, or training recipes. Mention quality regression, but anchor the discussion in runtime behavior: graph rewrites, kernel selection, data layout, calibration artifacts, memory footprint, and profiling with realistic batch sizes.
Pitfall: Using vague phrases like “the compiler optimizes it” without naming the actual transformations.
A stronger answer names concrete compiler/runtime actions: fusing quantize/dequantize with GEMM, removing redundant casts, choosing NHWC or tensor-core-friendly layouts, tiling matrix multiplies, planning activation buffers, and avoiding precision fallback around unsupported ops.
Connections
Interviewers may pivot from quantization into kernel fusion, mixed precision, Tensor Core architecture, model parallelism, or PyTorch compilation internals such as TorchDynamo, AOTAutograd, and TorchInductor. They may also ask how quantization interacts with serving concerns like batching, memory pressure, GPU utilization, and p99 latency.
Further reading
-
NVIDIA TensorRT Developer Guide — practical details on calibration, precision modes, engine building, and GPU inference optimization.
-
PyTorch Quantization Documentation — useful overview of static, dynamic, and quantization-aware workflows in
PyTorch. -
Jacob et al., “Quantization and Training of Neural Networks for Efficient Integer-Arithmetic-Only Inference” — foundational paper explaining affine quantization and integer-only inference mechanics.
Practice questions
Onsite
Coding & Algorithms
- Core Data Structures, Algorithms, And Complexity — covered in depth under Take-home Project below.
Software Engineering Fundamentals
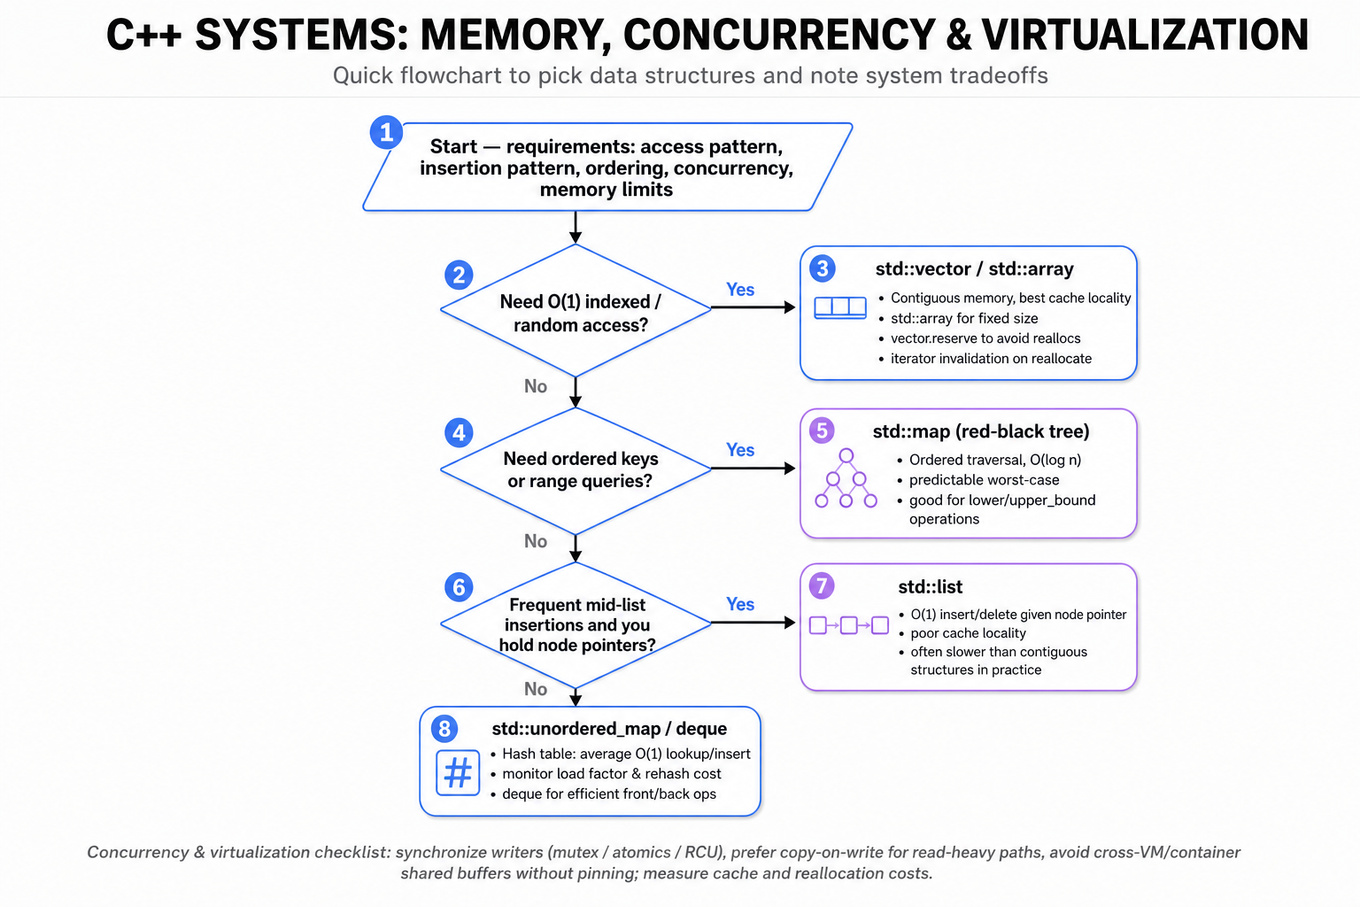
What's being tested
Interviewers are probing whether you can reason from first principles about low-level software behavior: memory layout, asymptotic complexity, concurrency correctness, and virtualization tradeoffs. For NVIDIA, this matters because performance-sensitive systems often sit close to hardware, GPUs, drivers, containers, schedulers, and distributed services where “it works” is not enough. A strong Software Engineer answer connects data structure choice, C++ object semantics, cache behavior, thread safety, and virtualized execution to concrete latency, throughput, memory, and correctness outcomes. The interviewer is not looking for trivia; they are checking whether you can explain tradeoffs, identify edge cases, and make implementation decisions under constraints.
Core knowledge
-
Arrays provide contiguous memory,
O(1)indexed access, excellent cache locality, and cheap iteration. Insert/delete in the middle isO(n)because elements must shift. They are ideal when size is fixed or append-heavy with predictable access patterns. -
Dynamic arrays such as
`std::vector`grow by allocating a larger buffer and moving/copying elements. Appending is amortizedO(1), but a resize isO(n). Capacity growth is often geometric, so wasted memory is traded for fewer reallocations. -
Linked lists provide
O(1)insertion/deletion only when you already have the node pointer. Searching remainsO(n), and poor cache locality often makes them slower than arrays in practice despite favorable theoretical insertion costs. -
Hash tables such as
`std::unordered_map`target averageO(1)lookup, insert, and delete, but degrade towardO(n)under heavy collisions or poor hashing. Key concerns include load factor, rehashing cost, iterator invalidation, and whether ordering is required. -
Trees trade constant-time hashing for ordering and range operations.
`std::map`is typically a red-black tree withO(log n)operations. Balanced trees are preferred for ordered traversal, lower/upper bound queries, and predictable worst-case behavior. -
Sorting algorithm choice depends on data size, stability, memory, and worst-case guarantees.
`std::sort`is usually introsort, combining quicksort, heapsort, and insertion sort for average speed andO(n log n)worst case;`std::stable_sort`preserves equal-element order but uses extra memory. -
C++ object lifetime requires distinguishing stack allocation, heap allocation, construction, destruction, copy, and move. Apply RAII: resource acquisition in constructors, release in destructors, with ownership expressed via
`std::unique_ptr`,`std::shared_ptr`, or value semantics. -
Rule of five matters for classes managing memory directly: destructor, copy constructor, copy assignment, move constructor, and move assignment. For a string-like class, missing deep copy causes double-free; missing move operations causes unnecessary heap allocation and copying.
-
Small string optimization stores short strings inline inside the object instead of allocating heap memory. A typical design uses a union of inline buffer and heap pointer plus size/capacity metadata. The tradeoff is larger object size versus faster short-string operations and fewer allocations.
-
Alignment and padding affect memory footprint and cache efficiency. Reordering fields can reduce padding;
sizeof(T)may exceed the sum of field sizes. For cache-sensitive code, consider cache-line size, often 64 bytes, and avoid false sharing between frequently written fields. -
Concurrency correctness centers on data races, atomicity, visibility, ordering, and progress. Use
`std::mutex`for mutual exclusion,`std::condition_variable`for blocking coordination, and`std::atomic<T>`when lock-free semantics are simple and well understood. -
Virtual machines run guest operating systems on virtualized CPU, memory, storage, and network devices. A hypervisor can be Type 1, running directly on hardware, or Type 2, running on a host OS. Performance overhead comes from VM exits, device emulation, memory translation, and I/O virtualization.
Worked example
For “Optimize a small-string C++ class”, start by framing the problem: “I’d clarify expected string length distribution, mutation frequency, ABI constraints, thread-safety expectations, and whether compatibility with `std::string` behavior is required.” Then state assumptions: most strings are short, reads/copies are common, and the goal is to reduce heap allocation and improve cache locality without breaking value semantics.
Organize the answer around four pillars. First, define representation: store size, a tag or capacity indicator, and a union containing either an inline `char[N]` buffer or a heap pointer. Second, define ownership and lifetime: implement destructor, copy/move constructors, and copy/move assignment safely, ideally using copy-and-swap or careful self-assignment checks. Third, reason about performance: short strings avoid malloc, copies fit in registers/cache lines, but larger object size may hurt arrays of strings. Fourth, validate edge cases: null terminator, empty string, exactly-at-threshold length, exception safety, alignment, and iterator/reference invalidation.
A concrete design decision to flag is the inline capacity. For example, a 24- or 32-byte object may allow 15 or 23 inline characters depending on metadata layout and pointer size. Larger inline buffers reduce allocations but increase memory bandwidth when many string objects are stored in containers. A strong answer explicitly says, “I’d choose the inline size based on profiling real workloads, not intuition.” Close by saying that, with more time, you would add benchmarks comparing allocation count, copy/move throughput, cache misses, and memory footprint against `std::string` on representative inputs.
A second angle
For “Explain virtual machines and concurrency basics”, the same core skill appears, but the focus shifts from object layout to execution isolation and synchronization. Instead of optimizing a local data structure, you need to explain layers: guest OS, hypervisor, virtual CPU scheduling, nested page tables, virtual disks, and virtual NICs. The performance reasoning is similar: every abstraction has overhead, but hardware support such as Intel VT-x, AMD-V, IOMMU, and nested paging reduces it.
Concurrency adds a correctness dimension: two threads updating shared state need synchronization regardless of whether they run on bare metal or inside a VM. A strong answer distinguishes parallelism from concurrency, explains why data races are undefined behavior in C++, and gives concrete tools like `std::lock_guard`, `std::atomic`, and condition variables. The transferable skill is mapping abstractions to real costs and failure modes.
Common pitfalls
Pitfall: Treating Big-O as the whole answer.
Saying “hash tables are O(1) and trees are O(log n)” is too shallow. A better answer mentions collisions, rehashing, memory overhead, ordering, cache locality, adversarial keys, and why `std::vector` can beat a linked list despite worse insertion complexity on paper.
Pitfall: Hand-waving C++ memory ownership.
A tempting but weak answer is “just use pointers and delete them in the destructor.” Interviewers expect you to discuss copy safety, move semantics, exception safety, self-assignment, and RAII. If you manage memory manually, you must show how your class avoids leaks, double-frees, dangling pointers, and unnecessary allocations.
Pitfall: Explaining concurrency only with definitions.
Knowing that a mutex “locks critical sections” is not enough. You should be able to describe a race condition, a deadlock scenario, a condition-variable wait loop with a predicate, and when atomics are appropriate. For example, while (!ready) cv.wait(lock); is safer than assuming one notification always means the condition is true.
Connections
Interviewers may pivot from these topics into operating systems, especially virtual memory, paging, syscalls, process isolation, and scheduling. They may also connect to performance profiling, including cache misses, allocation hot spots, lock contention, and `p95`/`p99` latency. For C++ roles, expect follow-ups on `std::vector`, `std::string`, smart pointers, move semantics, and undefined behavior.
Further reading
-
Effective Modern C++ by Scott Meyers — Practical coverage of move semantics, smart pointers, lambdas, and modern C++ object behavior.
-
C++ Concurrency in Action by Anthony Williams — Deep but practical treatment of
`std::thread`, mutexes, atomics, futures, and memory ordering. -
Computer Systems: A Programmer’s Perspective by Bryant and O’Hallaron — Excellent foundation for memory hierarchy, linking, virtual memory, concurrency, and systems-level performance reasoning.
Practice questions
System Design
-
CI/CD, Release Engineering, And GPU Test Infrastructure — covered in depth under Take-home Project below.
-
GPU Programming, Graphics APIs, And Shader Compilers — covered in depth under Take-home Project below.
Take-home Project
Coding & Algorithms
What's being tested
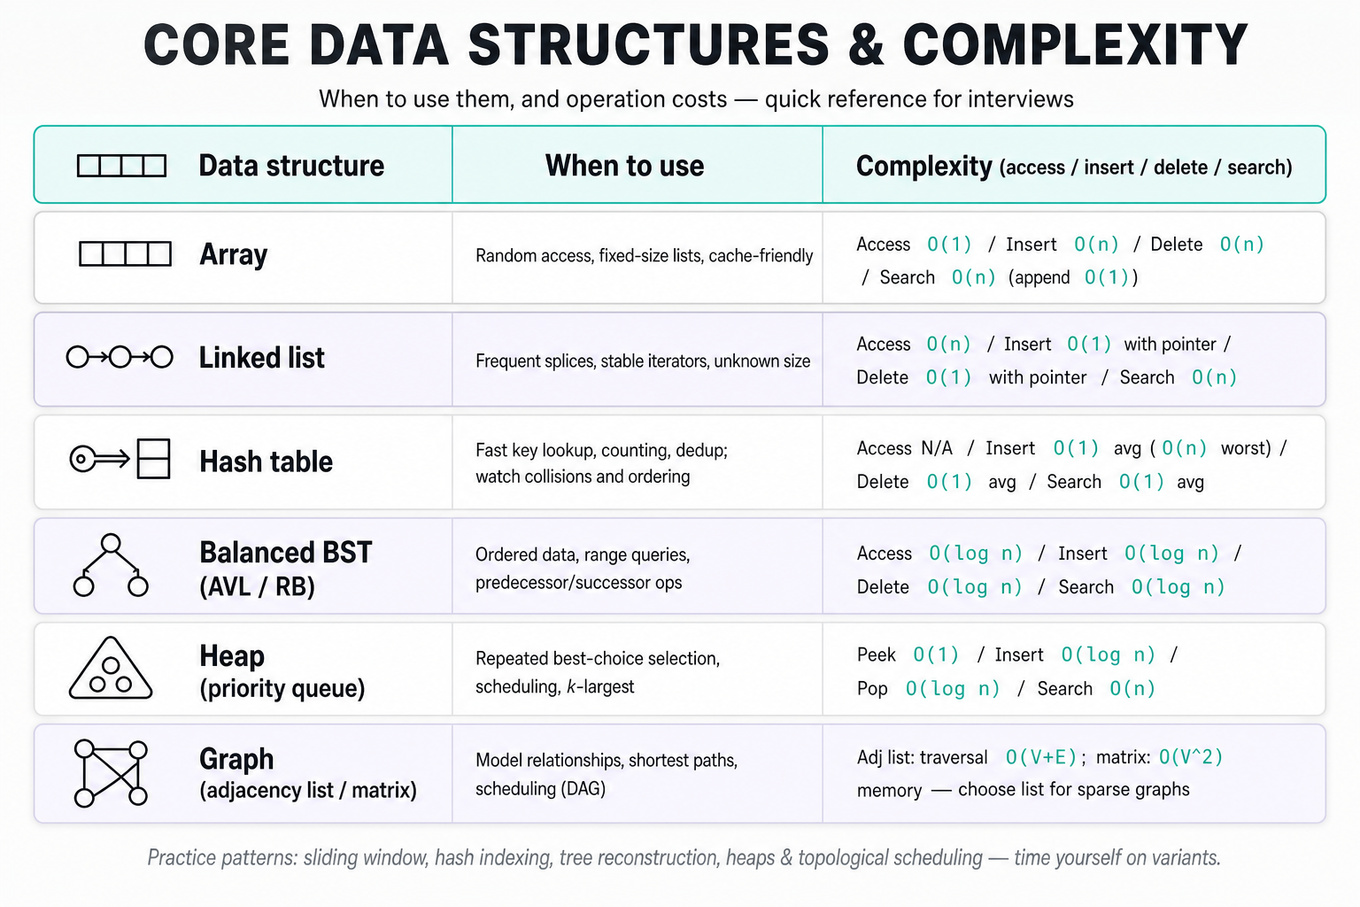
You need to recognize the right data structure, algorithmic pattern, and complexity bound from constraints, then implement cleanly under interview pressure. Expect arrays/strings, trees, heaps, hash maps, graphs, and scheduling-style dependency problems where the interviewer probes both correctness and tradeoffs.
Patterns & templates
-
Sliding window over contiguous arrays/strings — fixed-size or dynamic expand/contract; usually
O(n)time,O(1)orO(k)space. -
Hash map indexing — precompute value-to-index maps for
O(1)lookup; watch duplicates, missing keys, and stable ordering assumptions. -
Binary tree reconstruction — postorder root is last; split inorder by root index; recurse right before left when consuming postorder backward.
-
Heap / priority queue for repeated best-choice selection —
O(log n)per insert/pop; use lazy deletion for changing multisets. -
Graph scheduling — model tests as a DAG, run topological sort with in-degree counts; detect cycles when processed nodes
< n. -
Complexity comparison — arrays give
O(1)indexing, linked lists giveO(1)splice with node pointer, hash tables averageO(1), treesO(log n)if balanced. -
Greedy load balancing — assign next ready task to earliest available executor using a min-heap; optimality may fail with heterogeneous runtimes.
Common pitfalls
Pitfall: For dynamic sliding windows, shrinking only once instead of
while invalidleaves illegal windows in the answer.
Pitfall: Tree reconstruction fails when you scan inorder every recursion; build an index map first to avoid accidental
O(n^2).
Pitfall: In scheduling problems, ignoring cycle detection produces a partial schedule that looks valid but silently drops blocked tasks.
Practice these
The practice cards below cover the canonical variants — solve all of them and time yourself.
Practice questions
What's being tested
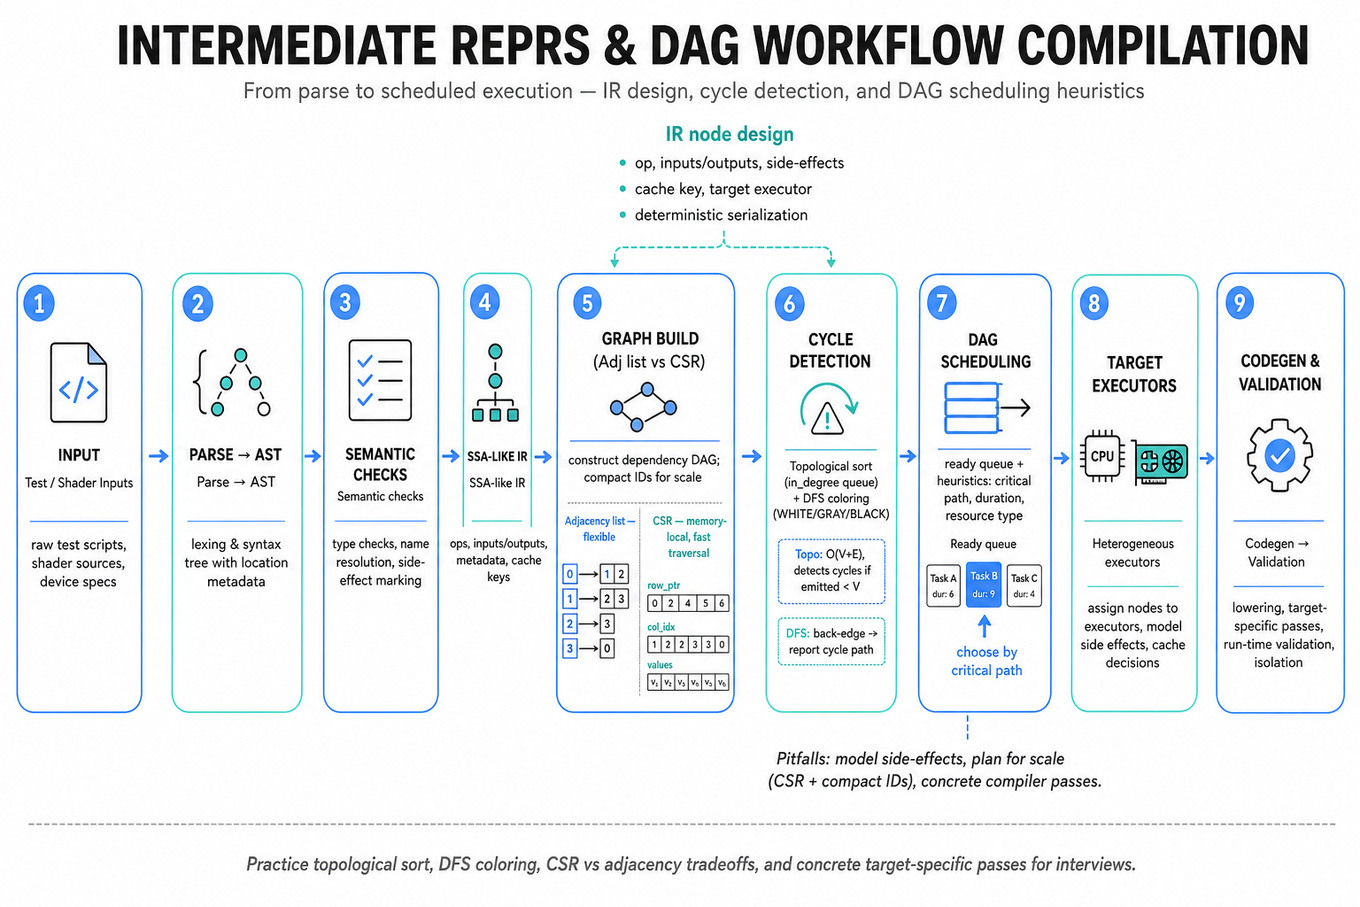
These prompts test compiler-style graph modeling: turning shader or test-workflow inputs into an intermediate representation, validating dependencies, then applying graph algorithms and scheduling heuristics. Interviewers look for clean APIs, correct O(V + E) traversals, and practical tradeoffs around caching, side effects, heterogeneous executors, and memory layout.
Patterns & templates
-
Topological sort with
in_degree+ queue —O(V + E)time; detects cycles when emitted count is less thanV. -
DFS coloring for cycle detection — states
WHITE/GRAY/BLACK; report the back edge path, not just “cycle exists.” -
DAG scheduling via ready queue — choose next node by critical path length, estimated duration, resource type, or priority metadata.
-
IR node design — represent
op, inputs, outputs, metadata, side effects, cache key, target executor, and deterministic serialization. -
Adjacency list vs CSR — lists are flexible for construction; CSR improves locality and parallel traversal for large static graphs.
-
Compiler pipeline template — lex/parse → AST → semantic checks → SSA-like IR → optimization passes → register allocation → codegen → validation.
-
Shortest path template — use
Dijkstrawith heap for nonnegative edge weights,O((V + E) log V); avoid it for pure DAG ordering.
Common pitfalls
Pitfall: Treating every workflow node as pure; tests with filesystem, GPU state, random seeds, or external devices need explicit side-effect and isolation modeling.
Pitfall: Giving only a high-level compiler answer;
NVIDIAinterviewers expect concrete passes like constant folding, dead-code elimination, SSA, register allocation, and target-specific lowering.
Pitfall: Ignoring scale; an
unordered_map<vector<Node>>graph may be fine for thousands of nodes, but millions require compact IDs, CSR, and memory-aware traversal.
Practice these
The practice cards below cover the canonical variants — solve all of them and time yourself.
Practice questions
System Design
What's being tested
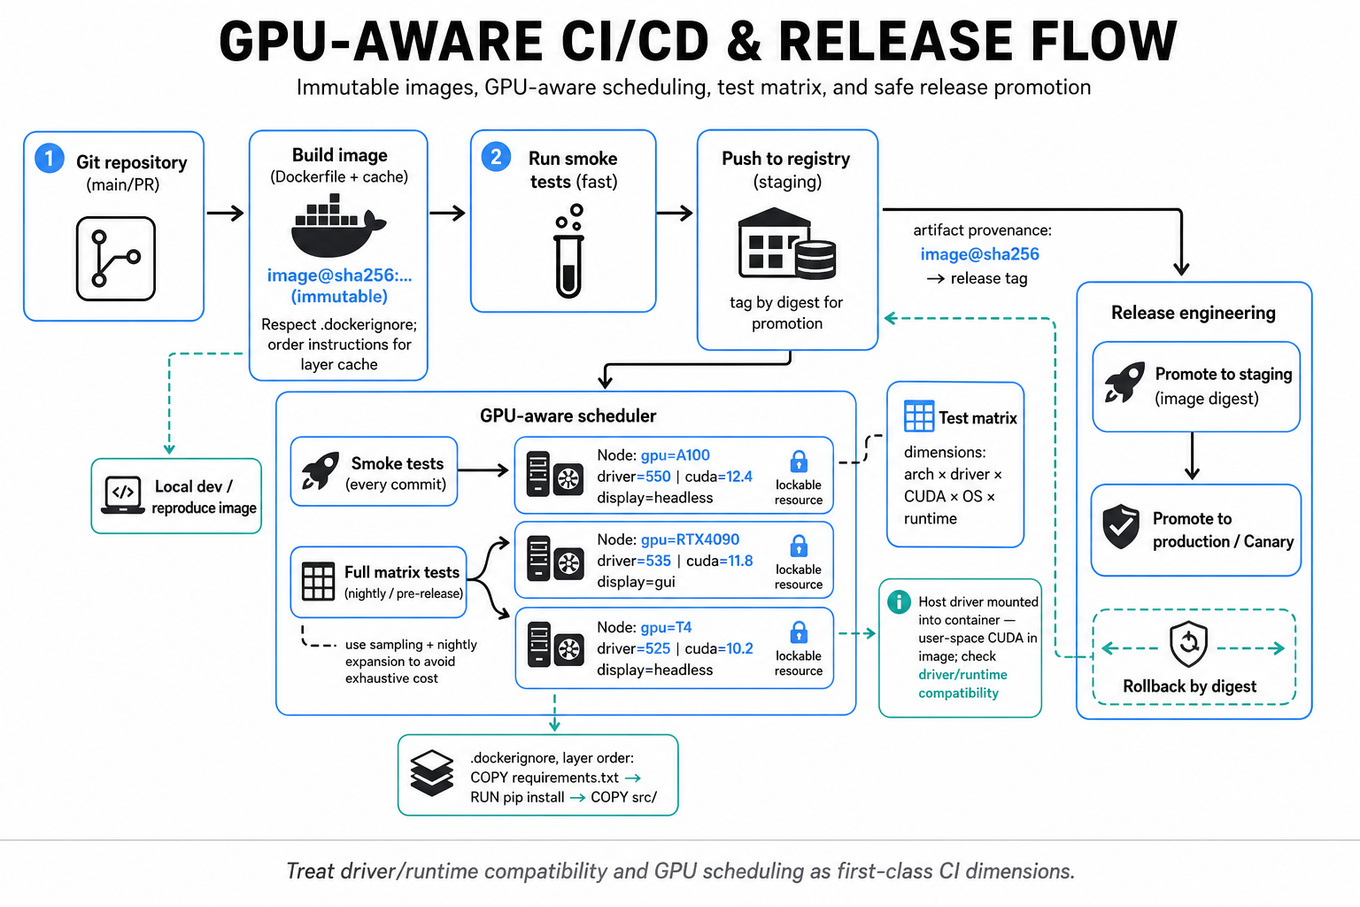
This area tests whether you can design a reliable CI/CD and release engineering system for software that depends on scarce, stateful, hardware-specific GPU resources. NVIDIA cares because many failures only appear under a particular driver, CUDA version, kernel, GPU architecture, graphics stack, or container runtime configuration, so “tests pass on my laptop” is not enough. Interviewers are probing for practical engineering judgment: image reproducibility, Git workflow discipline, artifact provenance, GPU-aware scheduling, flaky-test containment, rollback strategy, and debugging under constrained hardware availability. A strong answer balances correctness, throughput, security, and debuggability rather than simply saying “run tests in Docker and Jenkins.”
Core knowledge
-
Container image lifecycle starts with a
Dockerfile, build context, layered filesystem, cache lookup, image tagging, push to a registry, and pull onto workers. Know that tags likelatestare mutable; immutable digests such asimage@sha256:...are safer for reproducible CI and release promotion. -
Docker layer caching is highly sensitive to instruction order. Put slow-changing dependency installation before fast-changing source copies, e.g.
COPY requirements.txtthenRUN pip install, thenCOPY src/. Large build contexts slow builds and can leak secrets, so use.dockerignoreaggressively. -
GPU containers do not package the host kernel driver in the normal application image. With
NVIDIA Container Toolkit, the host driver is mounted into the container while user-space libraries such asCUDA,cuDNN, or application dependencies may come from the image. Compatibility between host driver and containerCUDAruntime is a key failure mode. -
Driver/runtime compatibility should be treated as an explicit test dimension. A reasonable matrix might include
GPUarchitecture, driver branch,CUDAversion, OS base image, and graphics API. Exhaustive testing grows as , so use smoke tests on every commit and broader matrix tests nightly or pre-release. -
GPU-aware CI scheduling requires labeling workers by hardware and software capability:
gpu=A100,gpu=RTX4090,driver=550,cuda=12.4,display=headless. InJenkins, this often means node labels, lockable resources, or custom queue logic to avoid two jobs fighting for the same physicalGPU. -
Headless graphics testing may need
Xvfb,EGL,Vulkan,Wayland,nvidia-drm, or device mounts such as/dev/nvidia0,/dev/nvidiactl, and/dev/dri. A strong answer clarifies whether tests are compute-only,OpenGL,Vulkan,CUDAinterop, or full display-stack tests. -
Test sharding improves throughput by splitting suites across machines, but
GPUtests can be stateful and non-uniform. Use historical duration data to balance shards, isolate tests that mutate globalGPUstate, and capture shard metadata so failures are reproducible with the same binary, image digest, driver,GPU, and seed. -
Flaky-test policy should distinguish infrastructure flakes from product regressions. Retries can reduce noise, but blind retrying hides defects. Track
flake_rate = flaky_failures / total_runs, quarantine known flakes, require owners, and preserve first-failure logs, core dumps, screenshots, traces, andnvidia-smisnapshots. -
Artifact provenance is central to release engineering. Every build should record Git commit SHA, image digest, compiler version, dependency lockfile, test matrix, driver version,
GPUmodel, and CI run URL. Release candidates should be promoted from tested artifacts, not rebuilt from source under slightly different conditions. -
Git workflow for CI should make integration risk visible. Common choices include trunk-based development with short-lived branches, protected main, mandatory code review, required CI checks, and merge queues. For release stabilization, use release branches plus cherry-picks, but avoid long-lived divergence that makes bisecting painful.
-
Regression bisecting depends on deterministic builds and clean history. If a
GPUtest starts failing, you want to rungit bisectagainst the same container image recipe, test command, seed, and hardware pool. Squash-heavy histories may simplify review but can reduce bisect resolution if commits bundle unrelated changes. -
Security boundaries matter because
GPUCI often runs privileged-ish workloads. Avoid mounting the hostDockersocket into untrusted jobs, restrict registry credentials, scan images with tools likeTrivyorGrype, pin base images, and treat external pull requests differently from trusted internal branches.
Worked example
For Design a Dockerized GPU test pipeline, a strong candidate would first clarify the test type: “Are these CUDA compute tests, graphics rendering tests, or both? Do we need multiple GPU models and driver versions? Are tests triggered per commit, nightly, or for release candidates?” Then they would declare assumptions: internal codebase, Jenkins or similar CI orchestrator, private image registry, Linux GPU workers, and a mix of smoke and full regression tests.
The answer should be organized around four pillars. First, define the container build flow: build application/test images from pinned base images, use dependency lockfiles, tag with Git SHA, push to a private registry, and run by immutable digest. Second, define GPU worker orchestration: label workers by GPU, driver, CUDA, OS, and graphics stack; schedule jobs only where requirements match; use resource locking so tests do not contend for the same device.
Third, cover test execution and observability: shard tests, set deterministic seeds, capture logs, test reports, nvidia-smi, driver info, screenshots or rendered frames, core dumps, and performance counters where relevant. Fourth, cover release gates: smoke tests on pull requests, expanded matrix on main or nightly, full qualification for release branches, and promotion only of tested artifacts.
One explicit tradeoff to flag is matrix completeness versus CI latency. Testing every commit on every GPU and driver is ideal but usually impossible, so you would run a fast representative subset on each change and reserve the full cross-product for scheduled or release-gating jobs. A good close would be: “If I had more time, I’d add automatic flake classification, historical shard balancing, and a dashboard showing failure rate by GPU, driver, image digest, and test owner.”
A second angle
For Explain container image flow in CI/CD, the framing is narrower: the interviewer is less interested in GPU scheduling and more interested in whether you understand what happens between git push and a running container. You would describe the build context, Dockerfile execution, layer cache, image ID, tags, registry authentication, push/pull behavior, and how the runtime starts the container from the pulled layers. The GPU-specific transfer is that a “working” image is not self-contained unless the target host has a compatible driver and runtime hook. The key design answer is to pin artifacts by digest, separate build-time and run-time secrets, and record image provenance so a test failure can be reproduced exactly. Instead of talking about large test matrices, you would emphasize reproducibility, cache invalidation, registry promotion, and tag immutability.
Common pitfalls
Pitfall: Treating containers as full virtual machines.
A tempting answer is “Docker packages everything, so GPU tests will run the same everywhere.” That misses the host kernel, device files, GPU driver, container runtime, and display stack, all of which can affect behavior. A better answer explicitly separates what lives in the image from what is supplied by the host.
Pitfall: Designing only the happy path.
Many candidates describe build, test, and deploy stages but skip failure handling. For GPU CI, the hard parts are queue starvation, flaky tests, machine contamination between jobs, driver mismatches, insufficient logs, and non-reproducible failures. Interviewers want to hear how you debug and contain those issues, not just how you start jobs.
Pitfall: Over-indexing on tools instead of invariants.
Saying “I’ll use Jenkins, Docker, and Kubernetes” is not a design. The stronger answer names the invariants: immutable artifacts, pinned dependencies, hardware-aware scheduling, isolated execution, traceable provenance, explicit release gates, and rollback from known-good artifacts. Tools should support those properties, not replace the reasoning.
Connections
The interviewer may pivot from here into distributed job scheduling, observability, build systems, dependency management, or release rollback design. For NVIDIA specifically, expect follow-ups around CUDA, NVIDIA Container Toolkit, driver compatibility, graphics headless rendering, and debugging intermittent hardware-dependent failures.
Further reading
-
Dockerfile reference — useful for precise behavior around layers, cache, build arguments, secrets, and image construction.
-
NVIDIA Container Toolkit documentation — explains how
GPUdevices and host drivers are exposed to containers. -
Jenkins Pipeline documentation — practical reference for pipeline stages, agents, artifacts, credentials, and parallel execution.
Practice questions
What's being tested
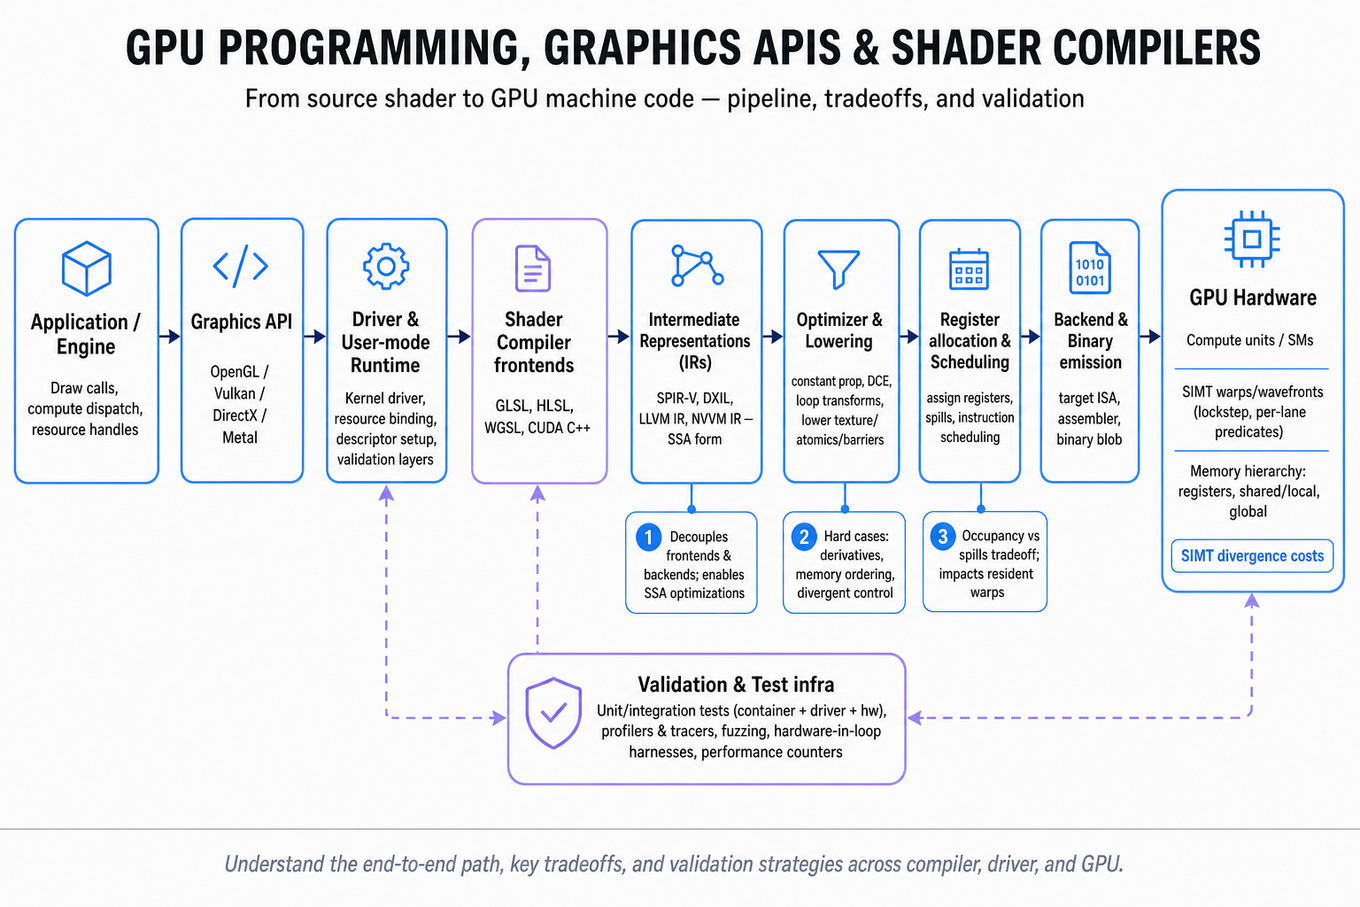
Interviewers are probing whether you can reason across the boundary between compiler architecture, GPU execution, graphics APIs, and test infrastructure without hand-waving. For NVIDIA, this matters because software engineers often work where application code, drivers, runtimes, shader compilers, and hardware behavior meet; correctness and performance bugs frequently appear at those seams. A strong answer shows you understand the end-to-end path from source shader or model representation to GPU machine code, plus how to validate it under real driver, container, and hardware constraints. The interviewer is not looking for memorized API trivia; they want structured thinking, tradeoff awareness, and the ability to debug complex GPU software systems.
Core knowledge
-
Shader compiler pipeline usually starts with source languages such as
GLSL,HLSL,WGSL, orCUDA C++, then performs lexing/parsing, semantic checks, AST construction, IR generation, optimization, lowering, register allocation, instruction scheduling, binary emission, and diagnostics. Mentioning each stage is less important than explaining why each exists. -
Intermediate representations are central because they decouple frontends from backends. Common examples include
SPIR-V,DXIL,LLVM IR,NVVM IR, and compiler-specific SSA IRs. SSA form makes dataflow explicit: every variable is assigned once, enabling optimizations like constant propagation, dead-code elimination, common subexpression elimination, and loop-invariant code motion. -
Lowering translates high-level operations into progressively more hardware-specific forms. For example, texture sampling, derivatives, barriers, atomics, and subgroup operations may start as abstract IR nodes and later become target-specific instructions or runtime calls. The hard cases are usually memory ordering, precision rules, resource binding, and divergent control flow.
-
Register allocation is a major GPU performance lever. More registers per thread can reduce spills but lower occupancy; fewer registers can increase resident warps but increase local-memory traffic. A useful mental model is: occupancy is constrained by registers, shared memory, thread blocks, and architectural limits, not just by thread count.
-
SIMT execution means a warp or wavefront executes many lanes in lockstep while tracking per-lane predicates. Divergent branches are not “parallel branches for free”; they can serialize paths and reduce utilization. Good compiler and shader design minimizes expensive divergence, uncoalesced memory access, and unnecessary synchronization.
-
Graphics API pipeline state differs across
OpenGL,Vulkan,Direct3D 11, andDirect3D 12. Older APIs hide more driver work behind mutable state; explicit APIs likeVulkanandD3D12push responsibility to the application via pipeline state objects, descriptor sets/root signatures, command buffers, synchronization primitives, and explicit memory management. -
Resource binding models are a common interview pivot.
OpenGLuses global binding points;Vulkanuses descriptor sets and pipeline layouts;D3D12uses root signatures, descriptor heaps, and resource barriers. A correct answer distinguishes shader-visible resource declarations from runtime binding, lifetime, synchronization, and layout transitions. -
Model-to-GPU execution typically flows from a frontend representation such as
PyTorch,TensorFlow,ONNX, orMLIRinto graph optimization, operator fusion, layout selection, kernel selection or code generation, device memory planning, command submission, and runtime scheduling. For SWE interviews, focus on systems mechanics: IR, lowering, runtime APIs, memory, streams, and debugging. -
Kernel launch overhead and memory movement often dominate before arithmetic does. Host-to-device copies over
PCIe, synchronization points, and small kernels can bottleneck execution. The rough roofline intuition is performance is bounded by . -
GPU correctness testing needs more than “does it render.” Strong strategies include golden-image comparison with tolerances, shader compiler differential testing, API conformance tests, replay traces, randomized shader generation, stress tests for synchronization, and cross-driver or cross-GPU comparisons. Floating-point tolerances must account for precision, format, ordering, and nondeterminism.
-
Dockerized GPU CI requires coordinating user-space libraries with host kernel drivers. With
NVIDIAhardware, containers typically usenvidia-container-toolkit,libnvidia-container,CUDAruntime libraries, and device nodes exposed by the host. The kernel driver is not meaningfully containerized, so reproducibility requires pinning image versions, driver compatibility ranges, test assets, and runtime flags. -
Headless graphics testing can use
EGL,Vulkansurfaceless extensions, virtual displays, or software fallbacks likeSwiftShaderfor some cases. For real GPU validation, avoid accidentally testing a CPU renderer. Capture logs, shader binaries, driver versions, GPU UUIDs, command streams, screenshots, and timing counters for debuggability.
Worked example
For “Explain a shader compiler pipeline”, a strong candidate would first frame the answer: “I’ll describe a typical graphics shader compiler from source to GPU binary, then call out optimizations, target-specific lowering, and testing.” Good clarifying questions include which source language is assumed, whether the compiler targets an offline format like SPIR-V or a vendor backend, and whether the focus is correctness, performance, or debugging.
The answer skeleton should have four pillars: frontend parsing and semantic analysis; IR construction, usually SSA-based; optimization and lowering; and backend code generation plus validation. In the frontend, discuss tokenization, parsing into an AST, type checking, scope/name resolution, and API-specific rules such as interpolation qualifiers or resource declarations. In the middle end, explain why SSA enables dataflow optimizations and how passes must preserve shader semantics around precision, derivatives, barriers, and memory ordering.
In the backend, cover instruction selection, register allocation, scheduling, binary encoding, and metadata needed by the driver/runtime. A specific tradeoff to flag is optimization time versus runtime performance: game shaders may compile at pipeline creation or first use, so aggressive optimization can cause stutter, while offline or cached compilation can afford heavier passes. Close by saying that if you had more time, you would discuss shader cache invalidation, pipeline libraries, differential testing, and collecting minimized repro cases for compiler bugs.
A second angle
For “Design a Dockerized GPU test pipeline”, the same core concept appears through validation and reproducibility rather than compiler internals. The framing shifts from “how do we compile and execute GPU code?” to “how do we reliably prove it works across real drivers, GPUs, APIs, and container boundaries?” A strong design names the constraints: host driver dependency, GPU scheduling isolation, test flakiness, headless rendering, artifact capture, and security of privileged device access.
The pillars would be container image pinning, hardware-aware scheduling, deterministic test execution, observability, and failure triage. The key tradeoff is between hermetic builds and the reality that the GPU kernel driver lives on the host; you can pin user-space libraries and test inputs, but you must explicitly record and matrix against driver and GPU versions. This is the same systems skill applied to the test loop: understand the compilation/execution boundary, then make it observable and repeatable.
Common pitfalls
Pitfall: Treating the shader compiler as a generic CPU compiler with different syntax.
A tempting answer says “parse, optimize, generate assembly” and stops there. That misses GPU-specific issues: SIMT divergence, resource bindings, texture/sampler semantics, barriers, precision qualifiers, occupancy, and register pressure. A better answer anchors each compiler stage to a GPU-specific concern.
Pitfall: Confusing graphics API abstractions with hardware behavior.
Candidates often say Vulkan is “faster” than OpenGL without explaining why. The stronger version is that explicit APIs reduce hidden driver work and expose synchronization, memory allocation, and pipeline state management to the application, which can improve performance when used correctly but also creates more ways to be wrong.
Pitfall: Designing GPU tests as ordinary unit tests only.
Unit tests are useful for compiler passes and utility code, but GPU systems also need conformance, image comparison, trace replay, performance regression tests, and cross-hardware validation. A good answer distinguishes deterministic compiler tests from inherently noisier runtime and rendering tests, then explains how to capture artifacts for debugging.
Connections
Interviewers may pivot from here into CUDA programming, driver/runtime architecture, compiler optimization, distributed CI infrastructure, or performance debugging with tools such as Nsight Systems, Nsight Graphics, Nsight Compute, RenderDoc, and PIX. They may also ask about memory hierarchy, synchronization, or API design tradeoffs between Vulkan, Direct3D 12, OpenGL, and CUDA.
Further reading
-
Vulkan Specification — authoritative reference for explicit graphics API concepts, synchronization, descriptors, and pipeline state.
-
LLVM Language Reference Manual — useful background on SSA-style IR, optimization passes, and compiler terminology.
-
NVIDIA CUDA C++ Programming Guide — practical grounding in GPU execution, memory hierarchy, occupancy, synchronization, and kernel behavior.
Practice questions