Operational Delivery Quality Diagnostics
Asked of: Data Scientist
Last updated
What's being tested
DoorDash is probing whether you can turn an operational symptom like cold food, late deliveries, or Dasher wait time into a rigorous diagnostic analytics and experimentation plan. A strong Data Scientist should define the right metric, decompose the end-to-end delivery funnel, isolate likely causes using observational data, and propose credible tests that distinguish correlation from causation. DoorDash cares because small changes in prep time, dispatch timing, routing, batching, or merchant handoff can materially affect customer retention, Dasher earnings, merchant trust, and marketplace efficiency. The interviewer is looking for structured thinking, statistical judgment, and an ability to balance marketplace tradeoffs rather than jumping to one explanation.
Core knowledge
-
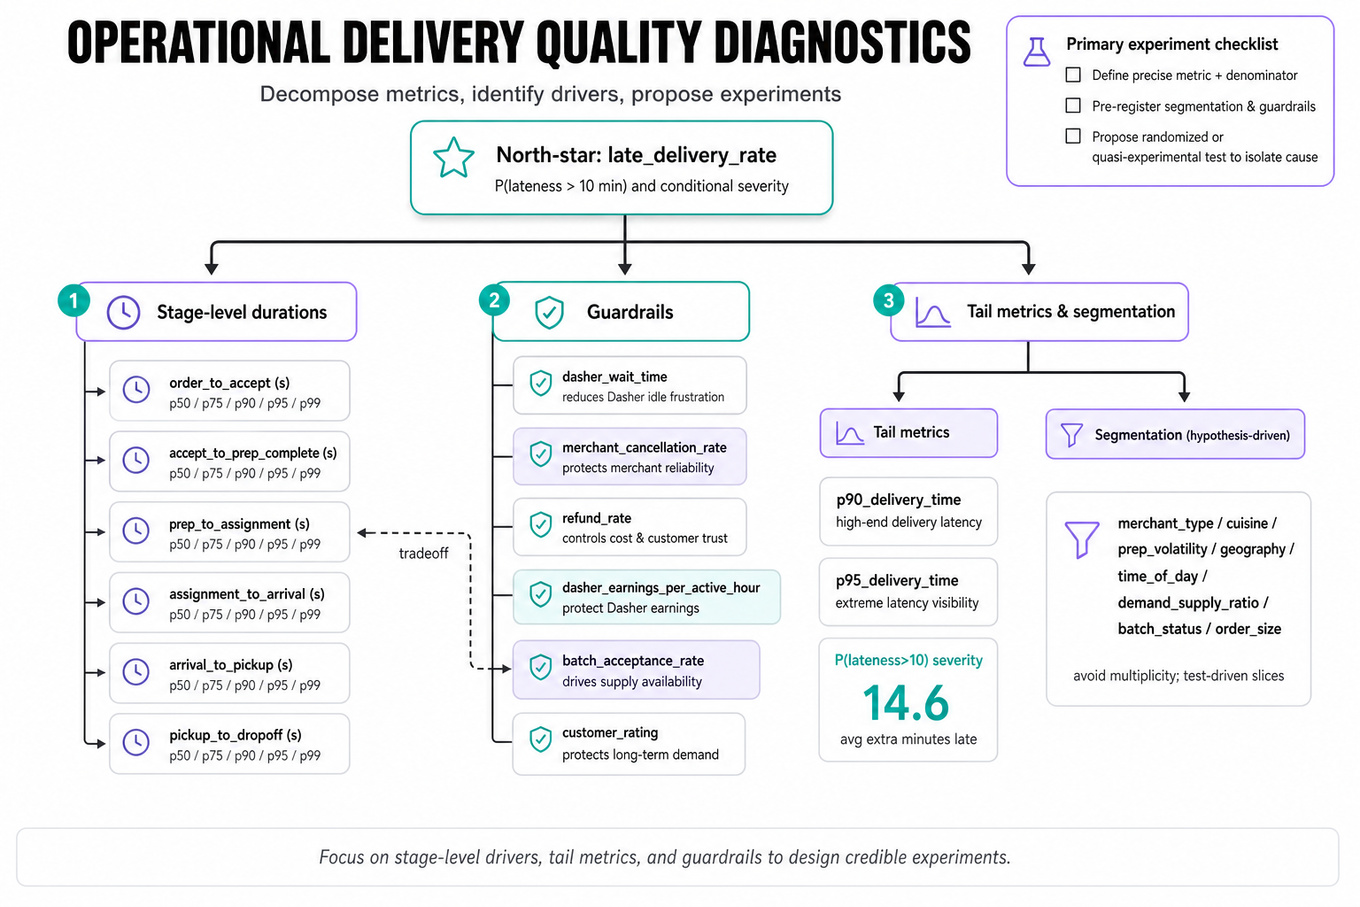
End-to-end order lifecycle decomposition is the backbone: order created → merchant accepts → food prep → Dasher assigned → Dasher arrives at merchant → pickup → travel to customer → dropoff. Most delivery-quality metrics should be decomposed into stage-level durations before proposing interventions.
-
Primary metrics should map directly to customer harm, e.g.
late_delivery_rate,cold_food_complaint_rate,avg_delivery_lateness, orp90_delivery_time. Use a rate denominator carefully: complaints per delivered order can be biased by customer propensity to complain, while app-observed lateness is broader but less directly tied to sentiment. -
Guardrail metrics prevent local optimization. For late deliveries, guardrails might include
dasher_wait_time,merchant_cancellation_rate,refund_rate,dasher_earnings_per_active_hour,batch_acceptance_rate, andcustomer_rating. Reducing lateness by over-dispatching Dashers may improve customer ETAs while harming Dasher utilization. -
Metric decomposition should separate mean effects from tail effects. DoorDash quality issues often live in the right tail, so track
p50,p75,p90,p95, andp99, not just averages. For lateness, define and analyze both and conditional severity. -
Segmentation should be hypothesis-driven: merchant type, cuisine, prep-time volatility, geography, market density, time of day, weather, order size, distance, batching status, Dasher supply-demand ratio, and new versus repeat customers. Avoid slicing into hundreds of cohorts without multiplicity control or a prior rationale.
-
Counterfactual thinking matters because marketplace metrics are confounded. Rain can increase both delivery times and complaint rates; busy merchants may have longer prep times and more complex orders. Use matching, regression adjustment, difference-in-differences, or fixed effects to estimate whether a suspected driver actually caused the spike.
-
Difference-in-differences is useful when a change affects some markets, merchants, or time windows but not others. The basic estimand is . The key assumption is parallel trends, which you should validate visually and with pre-period placebo checks.
-
Regression modeling can quantify drivers but should not be oversold as causal. A model like
cold_complaint ~ delivery_time + wait_time + distance + weather + cuisine + market_fixed_effects + hour_fixed_effectshelps prioritize hypotheses. Interpret coefficients cautiously when features are downstream of each other. -
Experiment design should match the intervention level. If changing dispatch timing, randomize at order or merchant-market-time level depending on interference. If Dashers can receive both treatment and control orders in the same shift, spillovers can contaminate estimates; cluster randomization may be cleaner but lower-powered.
-
Power analysis should be discussed for rare events like cold-food complaints. For a binary metric, approximate sample size per arm scales as for 80% power and 5% two-sided alpha under common assumptions. If baseline complaint rate is 2%, detecting a 5% relative lift requires very large samples.
-
Instrumentation quality is fair game from an analysis lens: know which signals you would query, such as GPS pings, merchant tablet timestamps, ETA quotes, Dasher arrival events, customer complaint labels, refund reasons, weather, and support tickets. Do not design pipelines; instead, state how you would validate timestamp consistency, missingness, and label bias.
-
Marketplace interference is a central edge case. Treating one set of orders can affect Dasher availability, merchant congestion, or batching opportunities for untreated orders. For high-interference interventions, prefer market-level switchbacks, geo experiments, or time-block randomization over naive user-level A/B tests.
Worked example
For Diagnose cold-food spike and design experiments, a strong first 30 seconds would clarify: “Is the spike in complaint rate, refund rate, low ratings mentioning temperature, or all of them? Is it localized by market, merchant, cuisine, weather, or time? Did any product, dispatch, batching, or ETA policy change recently?” I would define the primary metric as cold_food_complaint_rate = cold_food_complaints / delivered_orders, with supporting metrics like delivery_duration_after_pickup, dasher_wait_time, merchant_prep_time, batch_rate, distance, refund_rate, and customer_rating.
The answer should be organized around four pillars: validate the metric, localize the spike, form causal hypotheses, and design interventions. First, I would check whether the complaint-label mix changed, because a support taxonomy or in-app prompt change could create an artificial spike. Second, I would decompose the lifecycle to see whether cold complaints correlate more with long post-pickup travel, long Dasher wait after food is ready, excessive batching, weather, or certain cuisines with low heat retention. Third, I would compare affected versus unaffected cohorts using pre/post trends, merchant fixed effects, weather controls, and distance controls.
A specific tradeoff to flag: reducing cold food by assigning Dashers earlier may reduce post-ready wait, but it can increase dasher_wait_time at merchants and lower Dasher earnings per active hour. For experiments, I might test a revised dispatch rule for high-risk orders, such as hot-food cuisines during cold weather and long-distance trips, randomizing at merchant-market-time blocks to reduce interference. The primary success metric would be cold complaints, while guardrails include late delivery, Dasher wait, cancellation, batching efficiency, and customer reorder rate. I would close by saying that, with more time, I would build a risk model for cold-food probability and evaluate whether targeted interventions outperform blanket dispatch changes.
A second angle
For Investigate Causes of Increased Driver Wait Time, the same diagnostic playbook applies, but the customer-facing symptom is less direct and the unit economics tradeoff is more explicit. I would define dasher_wait_time as time from Dasher arrival at merchant to pickup, then segment by merchant, cuisine, order size, prep-time estimate accuracy, acceptance time, and peak-hour congestion. The causal hypotheses shift toward merchant prep delays, early dispatch, inaccurate ready-time predictions, and pickup process friction. The experiment might test later dispatch or improved prep-time prediction, but guardrails become late_delivery_rate, customer_wait_time, and dasher_utilization. Unlike cold-food complaints, this metric is observed for nearly every order with valid GPS and pickup timestamps, so power is usually easier, but timestamp accuracy and arrival geofence definitions become more important.
Common pitfalls
Pitfall: Jumping straight to “bad weather caused it” without a counterfactual.
Weather is a plausible driver of late or cold deliveries, but it often coincides with demand spikes, Dasher supply shortages, and merchant congestion. A better answer compares similar markets or time windows with and without weather shocks, controls for demand and supply, and checks whether the spike remains after decomposition.
Pitfall: Defining one metric and ignoring marketplace guardrails.
A tempting answer is “optimize delivery time” or “reduce complaints” in isolation. DoorDash problems are multi-sided: an intervention can help customers while hurting Dashers or merchants, so strong candidates explicitly define primary, secondary, and guardrail metrics before proposing experiments.
Pitfall: Over-fragmenting the analysis into endless cuts.
Listing every possible segment sounds thorough but can signal lack of prioritization. Start with the order lifecycle, identify where the metric moved most, then segment within that stage using hypotheses; if many comparisons are run, mention false discovery risk and validation on a holdout period.
Connections
Interviewers may pivot from this topic into A/B testing, causal inference, marketplace experimentation, or ETA model evaluation. Be ready to discuss switchback experiments, interference, power for low-base-rate metrics, and how offline diagnostics translate into online decision-making.
Further reading
-
Trustworthy Online Controlled Experiments by Kohavi, Tang, and Xu — practical foundation for experiment design, guardrails, novelty effects, and decision quality.
-
Causal Inference: The Mixtape by Scott Cunningham — accessible treatment of difference-in-differences, fixed effects, and causal identification.
-
Mostly Harmless Econometrics by Angrist and Pischke — deeper reference for regression, natural experiments, and credible empirical strategy.
Featured in interview prep guides
Practice questions
- Diagnose and experiment to reduce late deliveriesDoorDash · Data Scientist · Technical Screen · hard
- Diagnose cold-food spike and design experimentsDoorDash · Data Scientist · Onsite · hard
- Investigate Causes of Cold Food Deliveries and SolutionsDoorDash · Data Scientist · Technical Screen · medium
- Investigate Causes of Increased Driver Wait TimeDoorDash · Data Scientist · Technical Screen · medium
- Identify Key Metrics to Address Delivery DelaysDoorDash · Data Scientist · Technical Screen · medium
- Diagnose Causes of High Out-of-Stock Rate in GroceriesDoorDash · Data Scientist · Onsite · hard
- Diagnose Cold Food Deliveries with Key Metrics AnalysisDoorDash · Data Scientist · Onsite · medium
- Investigate Causes of Cold Meal DeliveriesDoorDash · Data Scientist · Technical Screen · medium
- Diagnose why average waiting time increasedDoorDash · Data Scientist · Onsite · medium
Related concepts
- DoorDash Three-Sided Marketplace Segmentation and Diagnostics
- Delivery Driver Payment And Cost SystemsSystem Design
- DoorDash Experimentation, Diagnostic Questions & Marketplace Metrics
- Operational Excellence, Observability, And Production Readiness
- Debugging, Observability, And Production OperationsSoftware Engineering Fundamentals
- Product Diagnostics And Root Cause Analysis