Product Debugging And Funnel Analysis
Asked of: Product Manager
Last updated
What's being tested
Interviewers probe your ability to diagnose product health using metric decomposition, prioritize fixes, and recommend measurable product changes that move business outcomes. They want to see structured root-cause thinking across user-facing funnels, sensible guardrails for risk (fraud/disputes/quality), and a clear communication plan tying analysis to prioritized product work. At Meta scale, the emphasis is on actionable insights that a Product Manager can own without getting lost in engineering or statistical minutiae.
Core knowledge
-
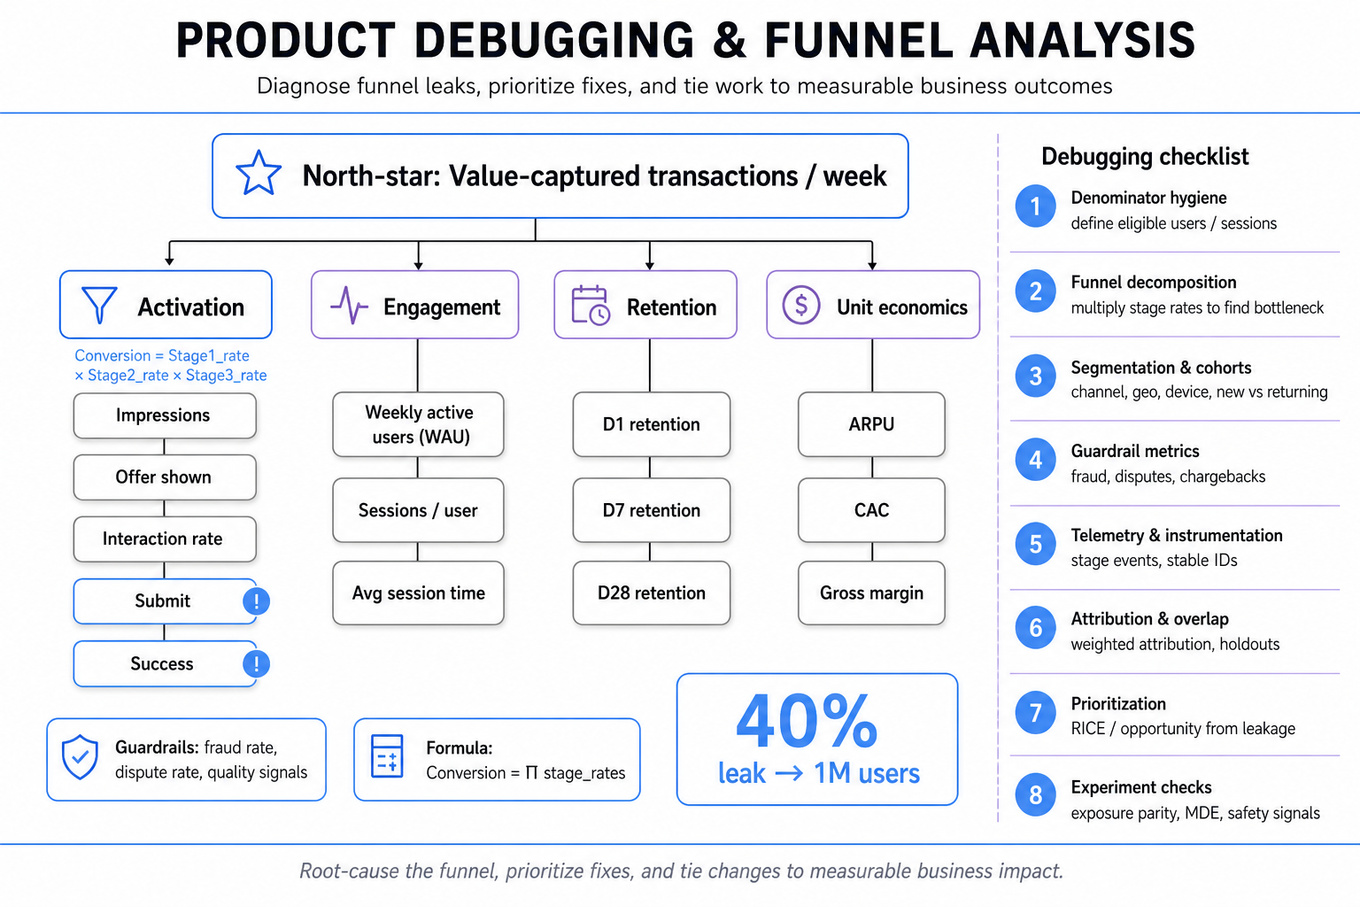
North-star framing: pick one metric that captures long-term value (e.g., value-captured transactions/week for payments). Support with a metric tree linking activation, engagement, retention, and unit economics down to KPIs.
-
Funnel decomposition: express overall conversion as a product of stage rates, e.g. Conversion = Stage1_rate × Stage2_rate × ...; decompose by segment to locate bottlenecks.
-
Denominator hygiene: always define the denominator (active users, eligible sessions, impressions). Mistakes here cause misleading rate changes; compare like-for-like cohorts or normalized time windows.
-
Segmentation & cohort analysis: slice by acquisition channel, geography, device, new vs returning, and cohort by user-signup week to separate product regressions from population shifts.
-
Guardrail metrics: track fraud rate, dispute rate, chargeback rate, and quality signals alongside growth metrics; ensure optimizations don’t worsen them.
-
Telemetry & instrumentation: instrument stage-level events (offer shown, interaction, submit, success, error code) with stable IDs; ensure sampling and late-arriving events are understood when interpreting drops.
-
Attribution & weighting: when multiple experiments or launches overlap, use weighted attribution and holdout cohorts; avoid naive "before/after" claims when other campaigns changed.
-
Prioritization frameworks: use RICE (Reach, Impact, Confidence, Effort) or opportunity scoring from funnel leakage (e.g., fix a 40% leak affecting 1M users > optimize a 1% metric).
-
Experiment sanity checks: verify experiment exposure parity, sample size / MDE reasoning, and monitor leading indicators (activation) and safety guardrails, stopping early only for safety signals.
-
Customer-centric root cause: convert metric drop into user stories (e.g., payment decline → unclear error messaging, unsupported card type, fraud decline). Recommend experiments that change user experience, not just backend tuning.
-
Unit economics & retention linkage: for payments, model per-user lifetime value: LTV ≈ ARPU × average lifetime; consider how transaction value and frequency both affect LTV.
-
Quick math for impact: use back-of-envelope: ; this helps prioritize fixes with clear ROI.
Worked example — "Define Meta Pay Success"
Start by clarifying scope and constraints: which products (wallet, in-app payments), time horizon, target geos, and whether regulatory/fraud constraints limit optimization. Frame the answer around three pillars: (1) North-star definition (value-captured transactions/week or active payers), (2) funnel KPIs (activation: payment method added, first transaction; retention: repeat transactions/time window; safety: dispute/fraud rates), and (3) prioritization and tradeoffs (user-experience vs risk controls). Show a metric tree that links Active Payers = Eligible Users × Activation_rate × Retention_rate; pick concrete thresholds (e.g., disputes <0.5% guardrail). A key tradeoff to flag: reducing friction (simpler flow) increases conversion but may increase fraud; propose staged rollout with risk-scored cohorts and stricter monitoring. Close by saying, "If I had more time, I'd run a two-arm pilot for bill-splitting vs donations in targeted markets, build a sample-size calc for the pilot (MDE 5% on conversion), and instrument post-launch cohort retention."
A second angle — "Product Metrics & Debugging Scenarios"
This prompt often focuses on incident triage and telemetry rather than product definition. Apply the same funnel decomposition but prioritize fast diagnostics: confirm whether the drop is global or segment-specific, check recent deploys/cross-product experiments, and inspect error-code distributions and p95 latency for related services. Here, privacy (e.g., data sampling or iOS/ATT changes) may explain apparent drops — translate technical signals into product impact (e.g., reduced event coverage biases conversion down). The different constraint is tempo: in an incident you prioritize rapid hypotheses (instrumentation, UI regression, backend errors) and short corrective experiments (rollback, feature-flag toggles) over longer strategic changes.
Common pitfalls
Pitfall: Mixing denominators — saying "conversion down 20%" without confirming whether the eligible pool changed (e.g., new eligibility rule) will lead to wrong remediation and misplaced engineering effort.
Pitfall: Blaming infrastructure too fast — defaulting to "it's the backend" without segmenting by error codes or user journeys misses UX-caused drops (confusing copy, button placement, or session timeouts).
Pitfall: Over-optimizing a vanity metric — optimizing
MAUgrowth without tracking value-captured or unit economics can drive low-quality users who increase costs (higher disputes/fraud), so always pair growth with guardrails.
Connections
Interviewers may pivot to experiment design (sample size, MDE, A/A tests), growth loops (how payment flows feed product virality), or risk/financial controls (fraud detection tradeoffs). Be ready to translate metric decisions into experiments or cross-functional work with risk, engineering, and analytics.
Further reading
-
Lean Analytics — practical frameworks for metric trees and choosing a north-star.
-
AARRR Pirate Metrics (Dave McClure) — concise breakdown of acquisition→activation→retention framing.
Practice questions
- Hiking App: Design, Metrics, and Go-to-MarketMeta · Product Manager · Onsite · medium
- Behavioral Stories: Technical Depth, Data Experimentation, FailureMeta · Product Manager · Onsite · medium
- Product Metrics & Debugging ScenariosMeta · Product Manager · Onsite · hard
- Meta Pay: Metrics & PrioritizationMeta · Product Manager · Onsite · medium
- Define Meta Pay SuccessMeta · Product Manager · Technical Screen · hard
Related concepts
- Product Metrics, Funnels, And KPI DiagnosisAnalytics & Experimentation
- Product Metrics, Funnels, And SegmentationAnalytics & Experimentation
- Product Metric Design And Diagnostic Deep DivesAnalytics & Experimentation
- Product Metrics, Root-Cause Analysis And VisualizationAnalytics & Experimentation
- Job Application Funnel AnalysisAnalytics & Experimentation
- Root Cause Analysis And Metric Debugging