60-Minute Product, Analysis, And SQL Round Triage
Asked of: Product Manager
Last updated
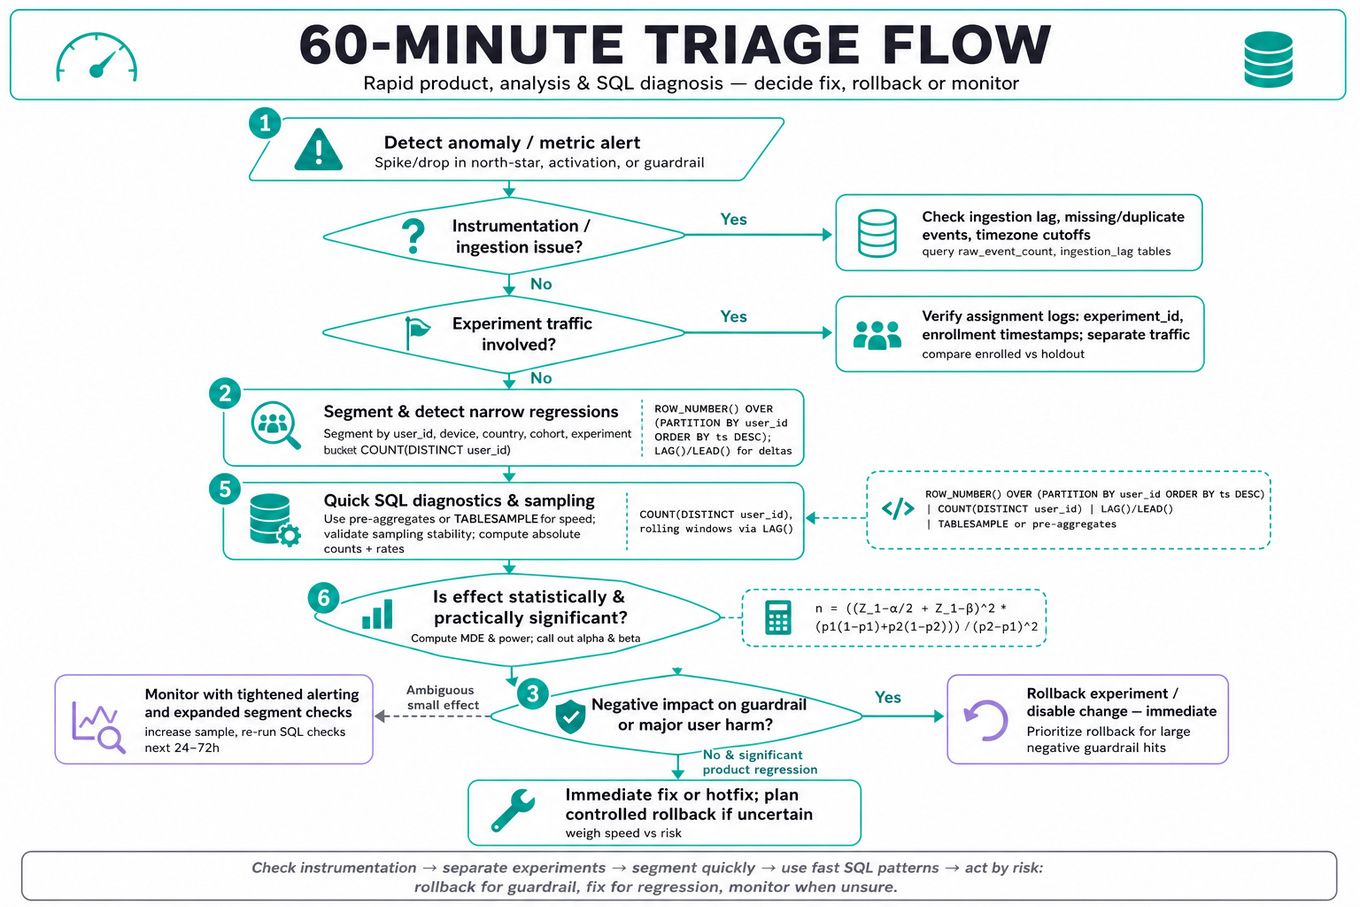
What's being tested
Interviewers are probing your ability to triage product issues end-to-end: form crisp hypotheses, pick the right product metrics, run focused SQL diagnostics, and recommend product or experiment actions that balance speed and risk. Meta cares because PMs must quickly decide whether a metric change is instrumentation/infra, a regression, an experiment effect, or a real user-behavior shift—and then prioritize fixes or rollouts.
Core knowledge
-
Metric taxonomy: know the difference between health metrics (
DAU,MAU, crash rate), north star (engagement or value capture), activation/conversion (funnel rates), and guardrail metrics (latency, abuse). -
High-cardinality segmentation: use user-level keys (
user_id) and segment by device, country, cohort, platform, or experiment bucketing to surface narrow regressions that aggregate metrics hide. -
Cohort & retention math: retention = returning users at t / users in cohort; lifetime metrics need right-censoring and cohort alignment to avoid survivorship bias.
-
Change attribution: check experiment traffic first—use assignment logs,
experiment_id, and enrollment timestamps to separate experiment-driven lifts from organic shifts. -
Quick SQL patterns:
ROW_NUMBER() OVER (PARTITION BY user ORDER BY ts DESC)for last-event-per-user;COUNT(DISTINCT user_id)for unique users; rolling windows viaLAG()/LEAD()to compute deltas. -
Sampling & scale tradeoffs: full-scan
GROUP BYacross billions of events is slow; use pre-aggregates/materialized views orTABLESAMPLEfor quick hypothesis checks, and always validate sampling stability by multiple runs. -
Significance & MDE: when recommending experiments, compute Minimum Detectable Effect (MDE) with
and call out power, alpha, and expected baseline p1.
-
Instrumentation checks: missing events, duplicate keys, pipeline delays, and timezone/partition cutoffs create false signals—query raw event counts and ingestion lag tables before product changes.
-
Signal vs. noise: use ratios with denominators that are stable; prefer absolute counts + rates and plot both to avoid misleading relative changes on small bases.
-
Roll-forward vs. rollback decisions: if an experiment shows large negative impact on guardrail metrics, prioritize rollback; for ambiguous signals prioritize more data or targeted canary rollouts.
-
Communication framing: always present: observation → possible causes (top 3) → quick checks performed → recommended next step (monitor/rollback/experiment/patch) with time-to-resolution estimate.
-
Privacy & sampling: when pulling user-level data, use hashed IDs and respect aggregation thresholds to avoid exposing PII; validate cohorts against privacy rules before sharing.
Worked example — Triage: sudden drop in DAU
First 30 seconds: ask sharp clarifying questions—exact time window, whether a release/deployment or experiment coincided, which platforms are affected, and whether DAU is computed by event X or a derived table. Frame your triage around three pillars: instrumentation, segment analysis, and funnel/feature checks. Start with a quick SQL to compare raw event ingestion counts vs. previous day and check for pipeline lag; then run GROUP BY platform, country, app_version on user_id unique counts to localize. Next, inspect experiments: join assignment logs to user_id and verify whether a treatment rollout aligns with the timestamp. Tradeoff to call out: deep forensic on logs gives certainty but costs hours—initial triage should favor narrow, high-leverage checks (ingestion + top 3 segments) to get a rollback decision window. Close by recommending immediate action (e.g., rollback release if instrumentation ok and guardrails broken; otherwise monitor 2–4 hours + run a focused experiment) and say "if I had more time, I'd pull server logs and the feature flag history, run a user-session-level replay, and validate against pre-aggregated metrics."
A second angle — Ambiguous A/B result on feed click-through
Same diagnostic skillset applies but the framing shifts: there you expect randomized assignment and need to validate randomization integrity and metric stability. Start by checking assignment balance across key covariates (platform, country, prior activity level) using AVG() and COUNT() by experiment_id. Then audit metric definition: are clicks deduplicated and counted in the same window used for the experiment? If the conversion lift is small and p≈0.06, explicate power and MDE concerns, propose either extending the experiment or switching to a more sensitive metric (e.g., session-level clicks per user). The core transfer: both cases require quick SQL checks, segment-level breakdowns, and an action plan that trades speed for confidence.
Common pitfalls
Pitfall: Assuming correlation implies causation.
Many candidates jump from a metric change to a product bug without validating experiments, releases, or instrumentation; always check assignment and ingestion first.
Pitfall: Over-aggregating too early.
Reporting only globalDAUcan hide platform- or cohort-specific regressions; failing to segment leads to wrong rollbacks.
Pitfall: Ignoring sample size and variability.
Reporting percent lift without confidence intervals or explaining underpowered tests makes your recommendation unreliable—call out MDE, power, and minimum runtime.
Connections
Interviewers may pivot into experimentation design (power calculations, blocking, multiple-hypothesis correction) or data engineering handoff (how to request logs, SLAs on materialized views). Be ready to propose instrumentation fixes you would ask the engineering team to implement.
Further reading
- Trustworthy Online Controlled Experiments (Kohavi et al.) — canonical reference on A/B testing pitfalls and best practices.
Related concepts
- SQL Product AnalyticsData Manipulation (SQL/Python)
- Case Interview Framing And Structured Communication
- SQL Analytical Querying And Data ModelingData Manipulation (SQL/Python)
- SQL Analytical QueryingData Manipulation (SQL/Python)
- SQL Aggregations, Joins, And Metric Queries
- Intervals, Sliding Windows, And Time-Ordered StateCoding & Algorithms