Supervised ML Workflows, Interpretability And Deployment
Asked of: Data Scientist
Last updated
What's being tested
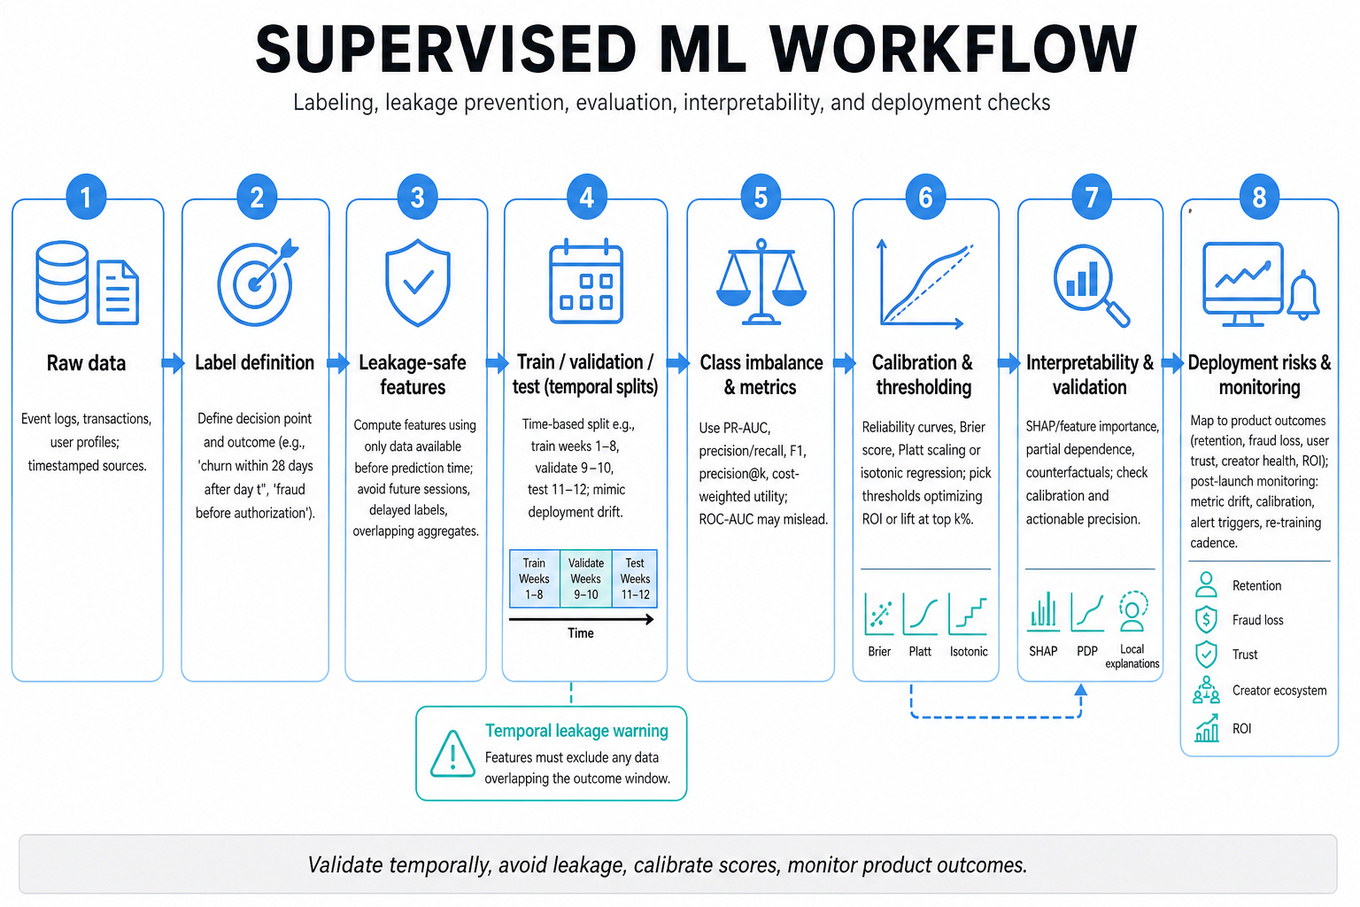
Interviewers are probing whether you can take a messy business prediction problem and turn it into a defensible supervised machine learning workflow: define the label, build leakage-safe features, choose evaluation metrics, interpret the model, and reason about deployment risks. At TikTok scale, a Data Scientist is expected to connect model quality to product outcomes such as retention, fraud loss, user trust, creator ecosystem health, and intervention ROI. The strongest answers show statistical discipline: temporal validation, class imbalance handling, calibration, threshold selection, and post-launch monitoring from a metric lens. You are not being tested on serving infrastructure internals; you are being tested on whether the model would be valid, useful, explainable, and measurable in production.
Core knowledge
-
Problem framing starts with the prediction target, decision point, and action. For churn, define “churn within 28 days after day ”; for fraud, define whether a transaction is fraudulent based only on information available before authorization. A vague label creates noisy training data and misleading offline metrics.
-
Temporal leakage is the most common supervised ML failure. Features must be computed using data available before the prediction timestamp. If predicting churn on Monday, do not include future sessions, future support tickets, delayed labels, or aggregates whose window overlaps the outcome period.
-
Train/validation/test splits should mimic deployment. Prefer time-based validation over random splits for churn, fraud, ranking quality, and user behavior modeling because user behavior, abuse patterns, and product surfaces drift. A typical split is train on weeks 1–8, validate on weeks 9–10, test on weeks 11–12.
-
Class imbalance changes metric choice and thresholding. For rare fraud or churn,
accuracycan be meaningless. Use precision, recall,F1, PR-AUC, lift at top %, and cost-weighted utility.ROC-AUCcan look strong even when precision at actionable thresholds is poor. -
Calibration matters when scores drive decisions. If a model says a user has 0.8 churn risk, roughly 80% of similar users should churn. Use reliability curves, Brier score, Platt scaling, or isotonic regression. Calibration is especially important when ranking users for retention offers or fraud review queues.
-
Threshold selection should optimize the business decision, not just a statistical metric. For binary classification, choose threshold using expected utility:
For churn, false positives may waste incentives; for fraud, false negatives may create direct loss. -
Feature engineering should reflect behavior and recency. Strong churn features include sessions in last 1/7/28 days, change in watch time, creator interactions, notification opens, failed payments, customer support contacts, and tenure. Use rolling windows, ratios, deltas, and cohort-normalized features rather than only lifetime totals.
-
Baseline models are part of a strong answer. Start with logistic regression for interpretability and calibration, then compare against tree-based models such as
XGBoost,LightGBM, or random forests. Deep models may help with high-dimensional behavior sequences, but interview answers should justify complexity with measurable lift. -
Model evaluation should include segment-level performance. Report metrics overall and by country, device type, new vs tenured users, creator vs viewer, payment tier, or traffic source. A model with strong global
PR-AUCcan still underperform or create unfair treatment in important cohorts. -
Interpretability requires matching the tool to the question. VIF diagnoses multicollinearity among predictors, often using . SHAP explains model predictions by attributing contribution to features. Under collinearity, SHAP credit can be split or unstable across near-duplicate features, while VIF flags the redundancy directly.
-
Deployment readiness for a Data Scientist means defining acceptance criteria, guardrail metrics, and monitoring plans. Track prediction distribution, feature missingness, calibration drift, precision/recall on delayed labels, intervention take rate, and downstream product metrics such as
DAU, retention, fraud loss, appeal rate, or user complaints. -
Unsupervised methods can support supervised workflows but rarely replace them when labels exist. K-means can segment users or initialize anomaly groups, using Lloyd’s iterations to minimize within-cluster SSE:
But clusters need interpretation, stability checks, and validation against business outcomes.
Worked example
For Predict Customer Churn with Machine Learning Workflow, a strong candidate would first clarify: “What counts as churn, when is the prediction made, and what action will the business take?” They might assume the task is to predict whether an active user on day will be inactive for the next 28 days, using only data up to day , so the model can trigger a retention intervention. The answer should be organized around four pillars: label definition, leakage-safe feature construction, model/evaluation strategy, and deployment measurement.
For features, they would propose recency/frequency/monetization-style behavior: sessions in the last 1/7/28 days, watch-time deltas, content diversity, notification engagement, social interactions, payment failures, tenure, and prior retention offer exposure. For modeling, they might start with logistic regression as a calibrated baseline, then compare LightGBM or XGBoost for nonlinear interactions. For evaluation, they should avoid accuracy and instead use PR-AUC, recall at fixed precision, lift in the top decile, calibration curves, and segment-level performance.
A specific tradeoff to flag is recall versus intervention cost: a low threshold catches more likely churners but may waste discounts or annoy users who would have stayed anyway. A polished answer closes by saying: “If I had more time, I would run an A/B test on the intervention policy, not just the model score, because the business goal is incremental retention, not offline AUC.”
A second angle
For Explain SHAP vs VIF under collinearity, the same workflow discipline appears in the interpretability and validation stage rather than model building. If two predictors are near duplicates, such as “sessions last 7 days” and “active days last 7 days,” VIF may be high because one feature can be linearly predicted from the other. SHAP may still generate attributions, but the credit assignment can be unstable: contribution may shift between correlated features depending on background data, model structure, or retraining sample. A strong Data Scientist would say VIF answers “are my predictors redundant or coefficients unstable?” while SHAP answers “what drove this model prediction?” They would recommend grouping correlated features, testing attribution stability, and validating whether removing one duplicate changes performance or interpretation.
Common pitfalls
Pitfall: Optimizing for
accuracyon an imbalanced classification problem.
In churn or fraud, a model that predicts “not churn” or “not fraud” for everyone can have high accuracy and zero business value. A better answer names PR-AUC, precision at top , recall at fixed false-positive rate, expected cost, and calibration.
Pitfall: Describing deployment as “put the model in production” without measurement.
For a Data Scientist, deployment readiness means defining launch criteria and monitoring metrics: score distribution drift, feature missingness, delayed-label performance, calibration, affected-user volume, and business impact through an experiment or holdout. Avoid going deep into infrastructure mechanics unless asked.
Pitfall: Treating interpretability tools as interchangeable.
Saying “SHAP tells us multicollinearity, so we do not need VIF” is wrong. VIF diagnoses predictor redundancy in the design matrix; SHAP explains model output contributions and can become ambiguous under correlated features. The stronger answer explains what each tool can and cannot claim.
Connections
Interviewers may pivot from this topic into causal inference, especially whether a churn intervention actually caused retention lift versus merely targeting users who would have stayed. They may also ask about A/B testing, ranking metrics, model calibration, fairness across cohorts, or anomaly diagnosis when offline and online metrics diverge.
Further reading
-
Interpretable Machine Learning — Christoph Molnar — practical coverage of SHAP, feature importance, partial dependence, and interpretability caveats.
-
The Elements of Statistical Learning — Hastie, Tibshirani, Friedman — rigorous treatment of supervised learning, regularization, classification, trees, and model assessment.
-
Lundberg and Lee, “A Unified Approach to Interpreting Model Predictions,”
NeurIPS 2017— the original SHAP paper and useful background for attribution discussions.
Featured in interview prep guides
Practice questions
- Design multimodal deployment under compute limitsTikTok · Data Scientist · Onsite · easy
- Design an ad-selection system across objectivesTikTok · Data Scientist · Technical Screen · hard
- Explain SHAP vs VIF under collinearityTikTok · Data Scientist · Technical Screen · hard
- Implement K-means and run two iterationsTikTok · Data Scientist · Technical Screen · medium
- Choose linear regression or decision tree appropriatelyTikTok · Data Scientist · Technical Screen · medium
- Personalize Ad Delivery Using Machine Learning TechniquesTikTok · Data Scientist · Technical Screen · medium
- Predict User Churn with Effective Modeling TechniquesTikTok · Data Scientist · Onsite · medium
- Predict Customer Churn with Machine Learning WorkflowTikTok · Data Scientist · Onsite · medium
- Design Real-Time Credit Card Fraud Detection SystemTikTok · Data Scientist · Onsite · hard
Related concepts
- Machine Learning Project LifecycleMachine Learning
- Production ML Systems, Evaluation, And SafetyML System Design
- Applied Machine Learning Modeling And EvaluationMachine Learning
- Production ML Pipelines And System DesignML System Design
- Production ML Infrastructure and MonitoringBehavioral & Leadership
- Machine Learning Model Design And EvaluationMachine Learning