1.1 Scale From Zero to Millions of Users
Why This Chapter Matters in Interviews
System design interviews are not about memorizing architectures. They are about demonstrating that you can reason about how systems evolve under pressure. Almost every interview begins with a deceptively simple question: "Design X." The candidate who immediately draws a complex distributed architecture will lose to the candidate who starts simple and scales up with clear reasoning at each step.
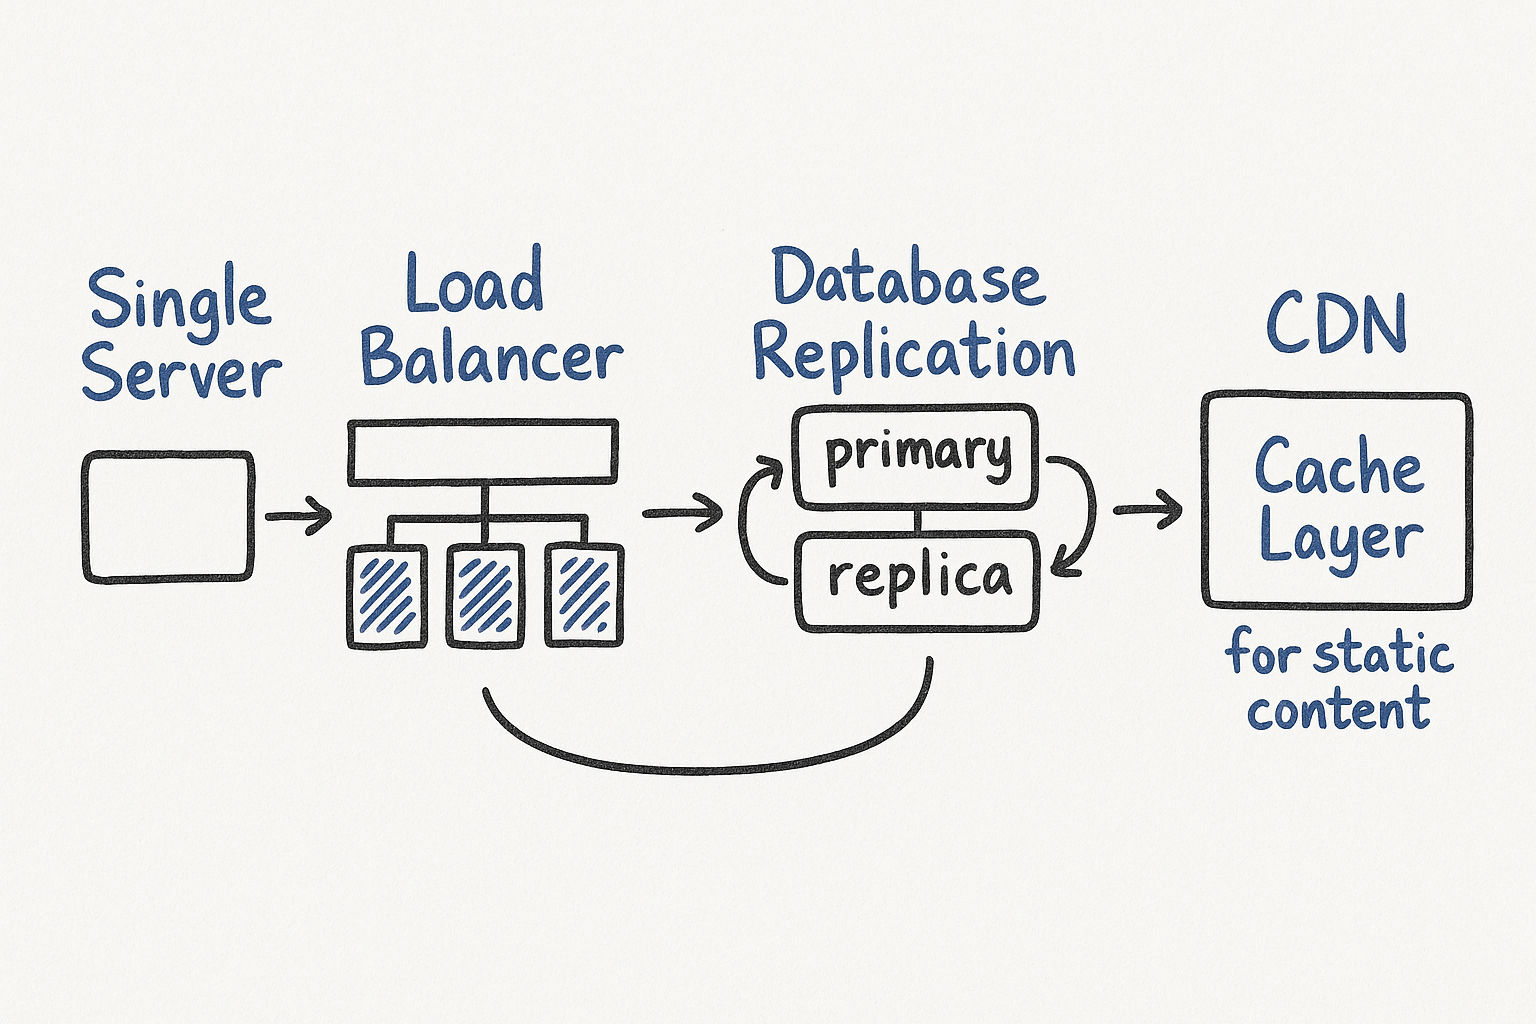
This chapter walks through the journey of taking a single-server setup to an architecture that handles millions of users. Every concept here — load balancing, caching, database replication, CDNs — will reappear in later design problems. Think of this as your vocabulary. Master it, and you will have the building blocks for every system design question you encounter.
Here is what makes this topic so powerful in interviews: it is a story. You are telling the interviewer a narrative of growth. "We started here, we hit this bottleneck, so we did this." That narrative structure is what separates a great answer from a mediocre one.
Stage 1: Single Server Setup
Everything starts here. One server handles web traffic, the application, and the database. When the interviewer says "design a basic version," this is your starting point.
What it looks like:
User requests DNS resolution → gets your server's IP
User sends HTTP requests to that IP
Server runs your application code and talks to the database on the same machine
Concrete numbers to keep in mind: A single well-provisioned server (say, 8 cores, 32 GB RAM) running a typical web application can handle roughly 500-1,000 requests per second for simple CRUD operations. If your responses require heavy computation or large database queries, that number drops to 100-300 QPS. These numbers are useful anchors for interviews.
When it breaks: The moment traffic exceeds what one machine can handle, or when the database and application compete for the same CPU and memory. You will also see problems when your database grows large enough that queries slow down, or when any single hardware failure takes your entire system offline.
Here is how you would explain this in an interview:
"I would start with the simplest possible setup — a single server running the application and database. For our initial user base of, say, a few thousand users, this handles everything fine. A single server can comfortably serve 500-1,000 QPS for straightforward read-write operations. But the moment we start growing beyond that, we hit two problems: the application and database are fighting for the same CPU and memory, and we have a single point of failure. If this server goes down, everything goes down."
Interview tip: Always start with this setup. It shows the interviewer you are grounded in reality, not just drawing boxes from memory. The interviewer wants to see you evolve the design, not present the final state.
What to Monitor at This Stage
Even at the single-server stage, you should mention monitoring. This signals operational maturity:
CPU utilization — when consistently above 70%, it is time to think about scaling
Memory usage — if your database is eating all the RAM, the application suffers
Disk I/O — databases are I/O hungry; saturated disks mean slow queries
Response latency (p50, p95, p99) — the first sign of trouble is usually p99 latency creeping up
Stage 2: Separate the Database
The first scaling move is almost always to pull the database onto its own server. This gives you independent scaling: the application server (which is mostly CPU-bound) and the database server (which is mostly I/O-bound) no longer compete for the same resources.
This separation also means you can choose different hardware profiles for each. Your application server might need lots of CPU cores and moderate memory, while your database server needs fast SSDs, lots of RAM for caching, and fewer but faster cores.
The performance impact is real. After separating the database, many teams see a 30-50% improvement in response times simply because the two workloads are no longer interfering with each other.
Relational vs. Non-Relational Databases
This is a decision point that interviewers love to probe. Here is the honest framework:
| Choose Relational (SQL) When | Choose Non-Relational (NoSQL) When |
|---|---|
| Data has clear relationships and structure | Data is unstructured or semi-structured |
| You need ACID transactions | You need very low latency at massive scale |
| Your query patterns are well-defined | Your schema changes frequently |
| Consistency matters more than raw throughput | Availability matters more than strict consistency |
| You need complex joins and aggregations | Your access pattern is mostly key-value lookups |
| Your data fits a normalized schema naturally | You have denormalized, document-shaped data |
In practice, most interview designs should default to relational databases unless you have a specific reason not to. Interviewers will be skeptical if you reach for NoSQL without justification.
Here is a good way to articulate the choice in an interview:
"I will go with PostgreSQL here because our data is inherently relational — users have posts, posts have comments, comments have likes. We need transactional guarantees when a user creates a post and we update their post count. If we later find that a specific access pattern, like a feed timeline, needs denormalized fast reads, we can add a NoSQL store alongside the relational DB for that specific use case."
Types of NoSQL Databases
If you do choose NoSQL, know the categories:
| Type | Examples | Best For |
|---|---|---|
| Key-Value | Redis, DynamoDB | Session storage, caching, simple lookups |
| Document | MongoDB, CouchDB | Content management, user profiles, catalogs |
| Wide-Column | Cassandra, HBase | Time-series data, write-heavy workloads |
| Graph | Neo4j, Amazon Neptune | Social networks, recommendation engines |
Interview tip: Saying "I would use NoSQL" is too vague. Specify which type and why. "I would use Cassandra for the message store because we need high write throughput with time-ordered data" is much stronger.
Stage 3: Vertical vs. Horizontal Scaling
When your single application server is overloaded, you have two options:
Vertical scaling (scale up): Get a bigger machine — more CPU, more RAM. This is simple, but it has a hard ceiling. The largest AWS instance (as of recent years) has around 448 vCPUs and 24 TB of memory. That sounds like a lot, but for a system serving millions of users, it is not enough. More importantly, a single server means a single point of failure.
Horizontal scaling (scale out): Add more servers of the same size. This is the approach that real large-scale systems use. It introduces complexity (how do you route traffic? how do you share state?) but removes the ceiling. Need more capacity? Add more machines.
| Factor | Vertical Scaling | Horizontal Scaling |
|---|---|---|
| Simplicity | Very simple, no code changes | Requires architectural changes |
| Cost curve | Exponential (big machines cost disproportionately more) | Linear (add commodity hardware) |
| Failure impact | Total outage if machine dies | One machine down, others still serve traffic |
| Upper limit | Hard ceiling (biggest available machine) | Virtually unlimited |
| State management | Easy (everything is local) | Must externalize state |
Concrete example to use in interviews: "A single server with 32 GB RAM might handle 1,000 QPS. If I double the RAM to 64 GB, I might get to 1,500 QPS — not a linear improvement because the bottleneck shifts. But if I add a second identical 32 GB server behind a load balancer, I get close to 2,000 QPS because the workload is distributed. Horizontal scaling gives us linear capacity growth."
Interview move: When you mention horizontal scaling, the interviewer expects you to immediately address the next problem: how does the user reach the right server? This is your natural transition to load balancing.
Stage 4: Load Balancer
A load balancer sits between users and your application servers. It distributes incoming requests across multiple servers, solving two problems at once:
No single point of failure — if one server dies, traffic reroutes to healthy ones
Better resource utilization — requests spread evenly instead of hammering one machine
Users now connect to the load balancer's public IP. The application servers sit behind it on a private network, which also improves security since the application servers are not directly exposed to the internet.
Load Balancing Algorithms
Common algorithms you should know:
| Algorithm | How It Works | Best For |
|---|---|---|
| Round Robin | Simple rotation through servers | Servers with identical capacity, stateless requests |
| Weighted Round Robin | Rotation with weights per server | Mixed hardware (give stronger servers more traffic) |
| Least Connections | Send to server with fewest active connections | Requests with varying processing times |
| IP Hash | Hash the client IP to pick a server | When you need session affinity without sticky sessions |
| Least Response Time | Send to server with fastest recent response | Heterogeneous environments |
Layer 4 vs. Layer 7 Load Balancing
This is a follow-up interviewers sometimes ask:
Layer 4 (Transport): Routes based on IP and port. Very fast because it does not inspect the request content. Think of it as a traffic cop directing cars without knowing what is inside them.
Layer 7 (Application): Routes based on HTTP headers, URL path, cookies, etc. Slower but smarter. You can route /api/users to one set of servers and /api/videos to another. This enables microservice routing.
Here is how you would explain this in an interview:
"I would put an L7 load balancer at the edge because we need to route different API paths to different backend services. For example, read-heavy endpoints like the feed go to servers optimized for reads, while write-heavy endpoints like post creation go to a separate pool. The load balancer does health checks every 10 seconds and removes unhealthy servers from the rotation within 30 seconds."
Health Checks
The load balancer needs to know which servers are healthy. It does this by periodically hitting a health check endpoint (like /health) on each server. If a server fails to respond a configured number of times (say, 3 consecutive failures), the load balancer stops routing traffic to it.
Types of health checks:
Shallow: Just checks if the server process is running (returns 200 OK)
Deep: Checks database connectivity, cache connectivity, disk space — everything the server needs to function
Interview tip: Mention that you would implement a deep health check that verifies database connectivity. A server that is "up" but cannot reach the database is worse than a server that is down — it will accept requests and then fail them.
Stage 5: Database Replication
Your application servers are now horizontally scaled, but the database is still a single point of failure. Database replication fixes this with a primary-replica model:
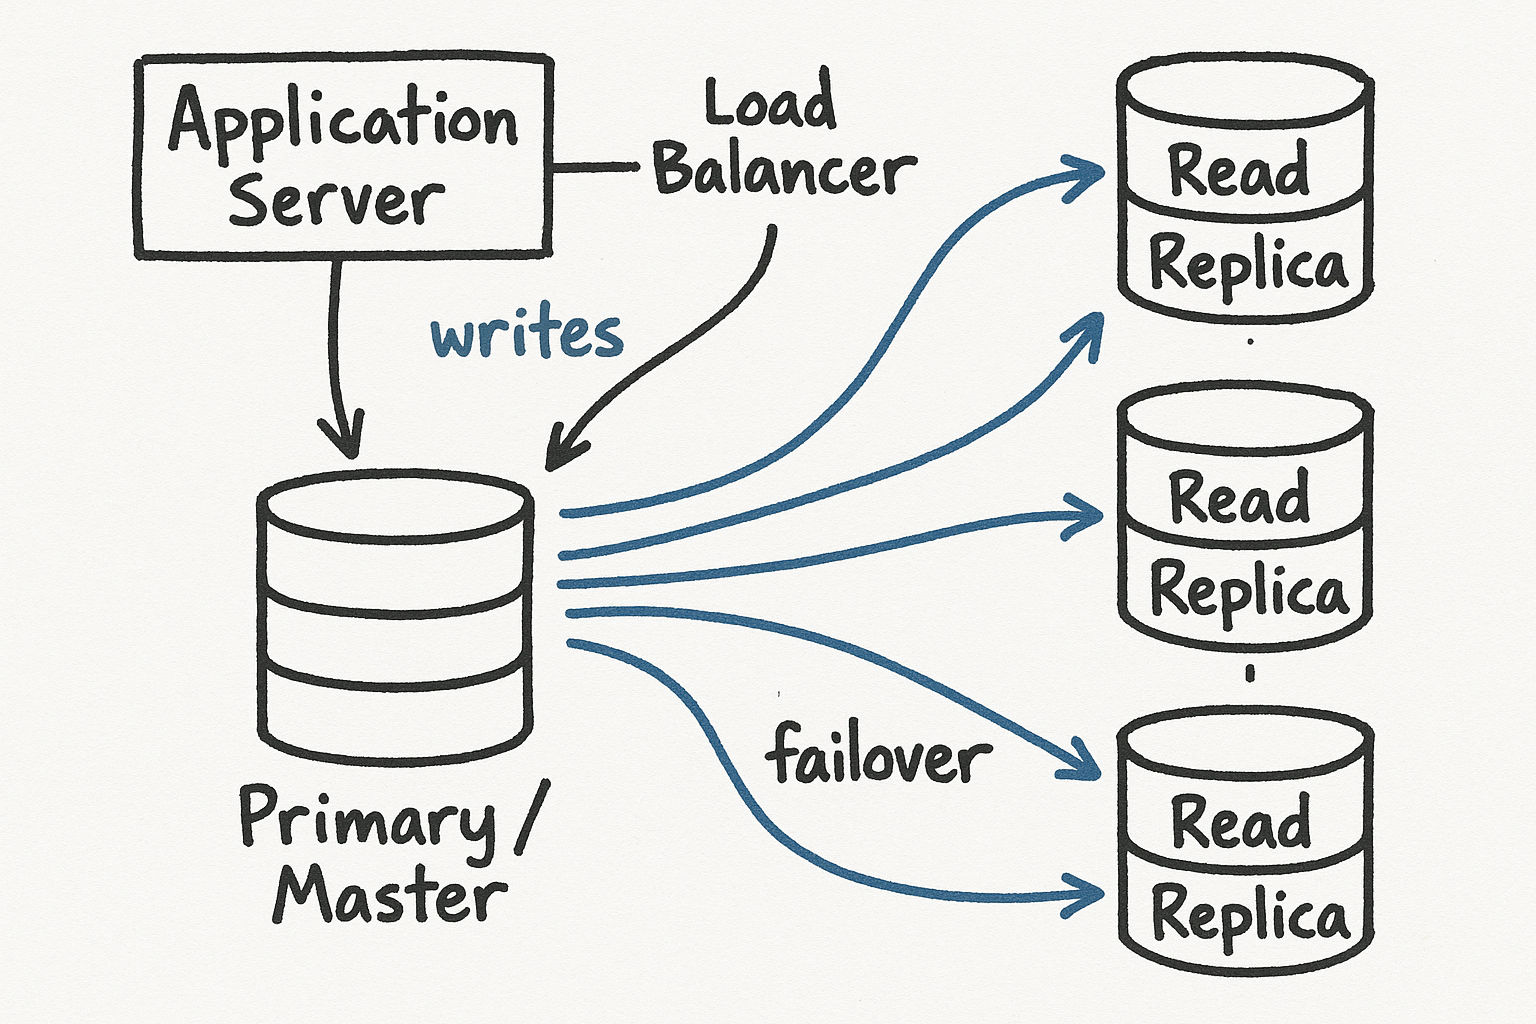
Primary (master): handles all write operations
Replicas (slaves): handle read operations, each a copy of the primary
Since most applications are read-heavy (often 90%+ reads), this dramatically improves performance. If the primary goes down, a replica gets promoted. If a replica goes down, reads route to other replicas.
How Replication Actually Works
When you say "replication" in an interview, the interviewer might probe for details. Here is what happens under the hood:
A write hits the primary database
The primary writes the change to its write-ahead log (WAL) — a sequential, append-only log of all changes
The WAL is streamed to replicas (either synchronously or asynchronously)
Each replica applies the WAL entries to its own copy of the data
Synchronous vs. asynchronous replication:
| Mode | How It Works | Tradeoff |
|---|---|---|
| Synchronous | Primary waits for at least one replica to confirm the write | Stronger consistency, but higher write latency |
| Asynchronous | Primary confirms the write immediately, replicas catch up later | Lower write latency, but risk of data loss if primary crashes |
| Semi-synchronous | Primary waits for one replica, rest are async | Balance of safety and performance |
Replication Lag and Its Consequences
This is the critical concept interviewers want to hear about. With asynchronous replication, there is always a delay between when a write hits the primary and when it appears on replicas. This is replication lag, and it typically ranges from milliseconds to a few seconds.
The classic problem: A user updates their profile, the write goes to the primary, and the user immediately refreshes the page. The read goes to a replica that has not received the update yet. The user sees their old data and thinks the update failed.
Solutions to discuss in interviews:
Read-your-own-writes consistency: After a write, route that user's subsequent reads to the primary for a short window (say, 5 seconds). This guarantees they see their own changes.
Monotonic reads: Ensure a user always reads from the same replica within a session, so they never see data go "backward."
Causal consistency: If operation B depends on operation A, ensure any replica that has seen B has also seen A.
Failover Mechanics
When the primary goes down, a replica must be promoted. This is called failover, and it is more complex than it sounds:
Detection: A monitoring system detects the primary is unresponsive (usually after several missed heartbeats, taking 10-30 seconds)
Election: A replica is chosen to become the new primary (usually the one with the least replication lag)
Promotion: The chosen replica stops accepting replication streams and starts accepting writes
Reconfiguration: Other replicas and the application layer are updated to point to the new primary
Recovery: When the old primary comes back, it becomes a replica and catches up
What can go wrong during failover:
If the old primary had writes that were not yet replicated, those writes are lost (with async replication)
Split-brain: both the old and new primary accept writes simultaneously, causing data conflicts
Application connections still pointing to the old primary will fail until they reconnect
Interview tip: When discussing database replication, always mention replication lag and failover. These are the hard parts, and demonstrating awareness of them shows depth.
Stage 6: Caching
Database queries are expensive. A cache stores the results of frequent queries in memory, so you do not hit the database every time. Adding a cache layer is often the single highest-impact optimization you can make. A well-implemented cache can reduce database load by 80-90% and cut response times from 50ms to 2ms.
Concrete numbers: A single Redis instance can handle 100,000+ operations per second with sub-millisecond latency. Compare that to a PostgreSQL query that might take 5-50ms. Caching is not an optimization — it is a fundamental architectural pattern.
Caching Strategies
There are several caching strategies, and knowing which to use when is what interviewers look for:
| Strategy | How It Works | Best For |
|---|---|---|
| Cache-Aside (Lazy Loading) | App checks cache first; on miss, reads from DB and populates cache | General purpose, most common |
| Write-Through | App writes to cache and DB simultaneously | When you need cache to always be current |
| Write-Behind (Write-Back) | App writes to cache only; cache asynchronously writes to DB | High write throughput (risk of data loss) |
| Read-Through | Cache itself fetches from DB on miss (cache is aware of DB) | When you want the cache layer to manage DB interaction |
| Refresh-Ahead | Cache proactively refreshes entries before they expire | Predictable access patterns, low-latency requirements |
Cache-aside is the most common pattern in interviews. Here is the flow:
Application receives a request
Check the cache for the data
Cache hit: Return the cached data immediately (fast path, ~1ms)
Cache miss: Query the database (~10-50ms), store the result in cache with a TTL, return to the user
Cache Invalidation Strategies
"There are only two hard things in computer science: cache invalidation and naming things." This is not just a joke — cache invalidation is genuinely the hardest part of caching. Here are the approaches:
TTL (Time-To-Live): Every cached entry expires after a set time. Simple, but you either serve stale data (long TTL) or miss the cache too often (short TTL). This is the most common approach because it is simple and works well enough for most cases.
Short-lived data (stock prices): TTL of 1-5 seconds
Medium-lived data (user profiles): TTL of 5-15 minutes
Long-lived data (product catalog): TTL of 1-24 hours
Event-driven invalidation: When data changes, explicitly delete or update the cache entry. More complex but more accurate. Example: when a user updates their profile, delete the cached profile. The next read will trigger a cache-aside miss and refresh the cache.
Versioned keys: Include a version number in the cache key. When data changes, increment the version. Old cache entries become unreachable and eventually expire. This avoids race conditions with explicit deletes.
Cache Stampede (Thundering Herd)
This is a failure mode that interviewers love to ask about. Here is what happens:
A popular cache entry expires
Hundreds of requests simultaneously discover the cache miss
All of them hit the database at the same time with the same query
The database gets overwhelmed
Solutions:
Locking: When a cache miss occurs, only one request is allowed to query the database. Others wait for the cache to be populated. This is usually implemented with a distributed lock (e.g., Redis SETNX).
Stale-while-revalidate: Serve the stale cached value while one background request refreshes it. Users get slightly stale data but the database is protected.
Jittered TTLs: Instead of all entries expiring at exactly the same time, add random jitter to TTLs (e.g., 300 plus or minus 30 seconds). This spreads expirations over time.
Cache Eviction Policies
When the cache is full, something has to go. The eviction policy determines what gets removed:
LRU (Least Recently Used): Evict the entry that has not been accessed the longest. This is the default for most caches and works well for most workloads.
LFU (Least Frequently Used): Evict the entry that has been accessed the fewest times. Better for workloads with stable hot keys.
FIFO (First In, First Out): Evict the oldest entry. Simple but not as effective as LRU for most use cases.
Random: Evict a random entry. Surprisingly effective in some workloads and very simple to implement.
Interview tip: When discussing caching, always mention at least three things: the caching strategy (cache-aside vs. write-through), how you handle invalidation, and what eviction policy you would use. These three together show you understand caching beyond the basics.
Stage 7: Content Delivery Network (CDN)
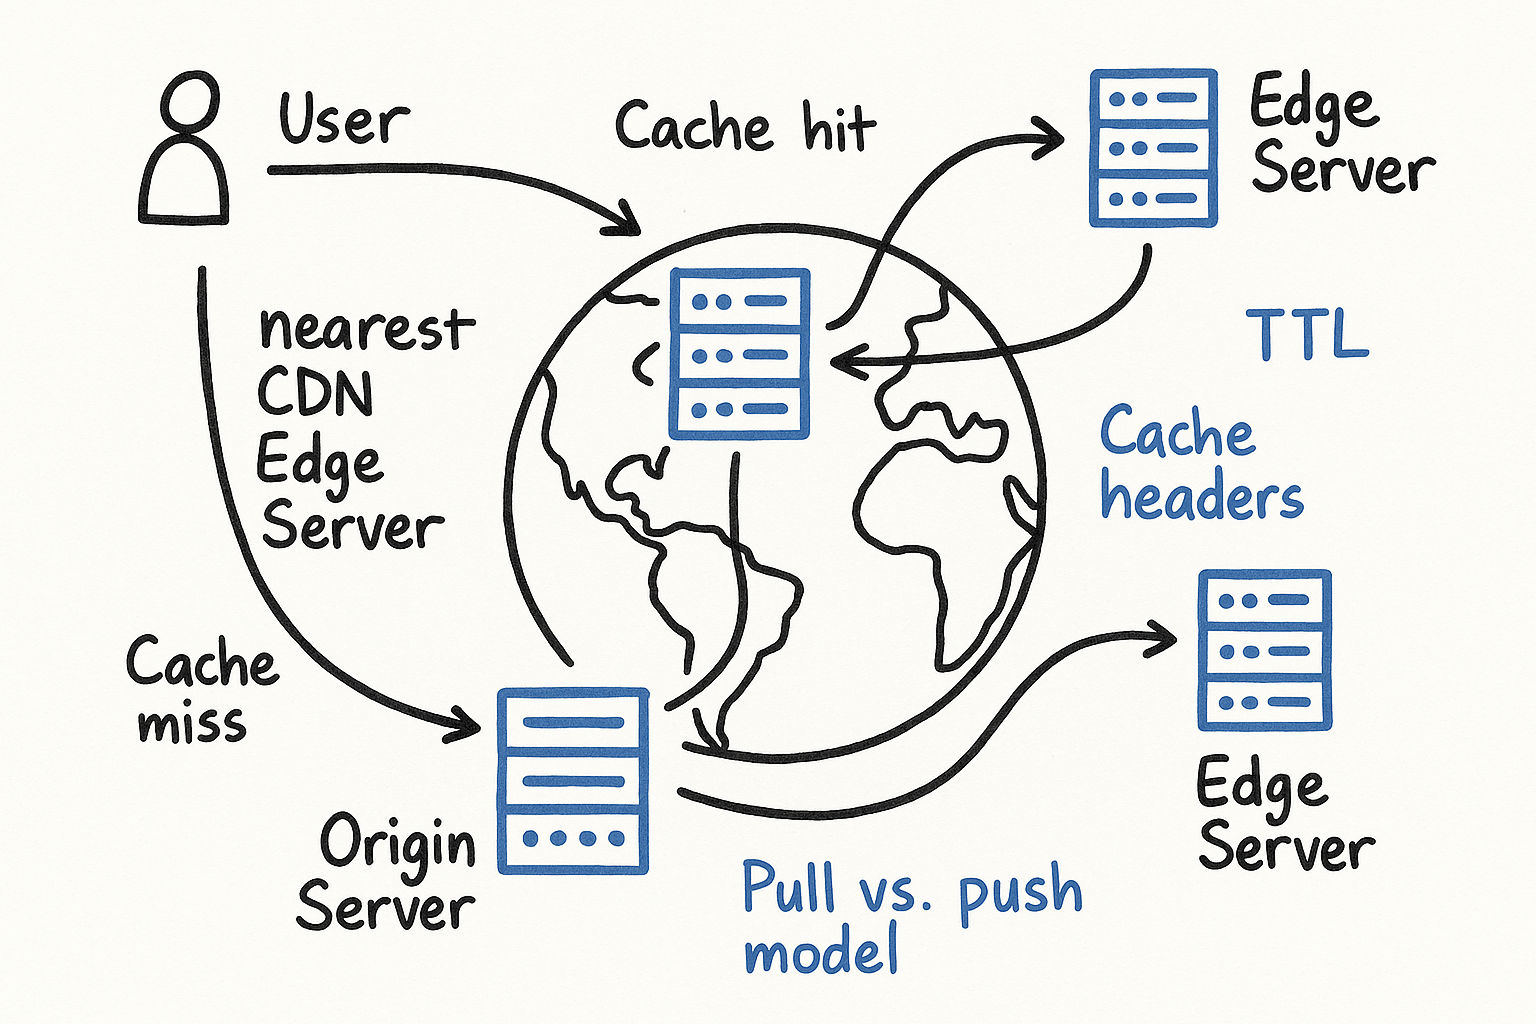
A CDN is a network of geographically distributed servers that cache static content (images, CSS, JavaScript, videos) close to users. A user in Tokyo should not wait for a response from a server in Virginia when a cached copy exists in a Tokyo edge server.
The impact is significant: Without a CDN, a user 10,000 miles from your server adds ~150ms of network latency per request. With a CDN edge server nearby, that drops to 5-20ms. For a page that loads 50 assets, that is the difference between a 7.5-second load time and a 1-second load time.
How CDNs Work
User requests a resource (e.g., an image)
DNS routes the request to the nearest CDN edge server (using anycast or GeoDNS)
Edge hit: The edge server has the resource cached → serves it immediately
Edge miss: The edge server fetches it from your origin server, caches it locally, then serves it
Push vs. Pull CDNs
| Approach | How It Works | Best For |
|---|---|---|
| Pull CDN | Edge fetches content from origin on first request, then caches it | Most web applications — content is cached on demand |
| Push CDN | You explicitly upload content to the CDN ahead of time | Large files, video streaming — you control exactly what is cached |
Pull CDNs are more common and easier to manage. You just point your DNS at the CDN provider and it handles everything. The downside is the first request for any piece of content has a cache miss.
Push CDNs give you more control but require you to manage the upload process. This makes sense for content like videos where you know in advance what needs to be distributed.
Cache Headers and CDN Behavior
CDNs respect HTTP cache headers, so your origin server controls caching behavior:
Cache-Control: max-age=86400 — CDN caches this for 24 hours
Cache-Control: no-cache — CDN must revalidate with origin before serving
Cache-Control: no-store — CDN must not cache this at all (use for private data)
ETag / Last-Modified — CDN can check with origin if the content has changed without re-downloading it
CDN Cost Considerations
CDN providers charge for data transfer out from edge servers. A few things to keep in mind:
Do not cache infrequently accessed content — it costs money without real benefit
Set appropriate TTLs — longer TTLs mean fewer origin fetches, which saves money
Use compression (gzip/brotli) to reduce the size of transferred content
For very large files (video), consider a push CDN to avoid repeated origin fetches
Edge Computing
Modern CDNs offer more than just caching. Edge computing (like Cloudflare Workers or AWS Lambda@Edge) lets you run code at the edge:
A/B testing without hitting your origin
Request routing and header manipulation
Authentication checks at the edge
Personalized content assembly
Interview tip: When you mention CDN in an interview, do not just say "we add a CDN for static content." Explain what specifically you would cache (images, JS bundles, API responses for public data), what TTL you would set, and whether you would use a push or pull approach.
Stage 8: Stateless Application Tier
Up to this point, your application servers might be storing session data (who is logged in, what is in their cart) locally. This is a problem because the load balancer must route the same user to the same server every time (sticky sessions), which limits flexibility.
The fix: move state out of the application servers into a shared store (like Redis or a dedicated session database). Now every server is identical and interchangeable — any server can handle any request.
This is what "stateless" means in practice. The application servers themselves hold no user-specific data. They are disposable.
Why Statelessness Matters So Much
| With State (Sticky Sessions) | Without State (Stateless) |
|---|---|
| Load balancer must track session-to-server mapping | Any request can go to any server |
| If a server dies, all its users lose their sessions | If a server dies, users are unaffected |
| Cannot easily autoscale — new servers have no sessions | Autoscaling is seamless — just add or remove servers |
| Deployments require draining sessions | Zero-downtime deployments are straightforward |
Here is how you would explain this in an interview:
"I want to make sure our application tier is completely stateless. All session data goes into Redis. This means every application server is identical and disposable — if one crashes, the load balancer routes to another one and the user does not notice because their session is in Redis. This also makes autoscaling trivial: we can spin up new servers during peak hours and shut them down when traffic drops, without worrying about session migration."
Where to Store State
Redis/Memcached: Best for session data, temporary state, and anything that needs sub-millisecond access
Relational database: Best for persistent state that needs ACID guarantees
Object storage (S3): Best for large binary data (images, files)
Interview tip: The transition from stateful to stateless is a great moment to mention autoscaling. Stateless servers can be autoscaled based on CPU, memory, or request count without any session management complexity.
Stage 9: Multiple Data Centers
For global availability and disaster recovery, you deploy your architecture across multiple data centers in different geographic regions.
Why this matters: A single data center, no matter how well-architected internally, is still a single point of failure for an entire geographic region. Natural disasters, power grid failures, network fiber cuts — any of these can take out an entire data center.
Key Challenges
Traffic routing: Use GeoDNS to direct users to the nearest data center. A user in Europe goes to the EU data center; a user in Asia goes to the APAC data center. If one data center goes down, all traffic routes to the remaining ones.
Data synchronization: This is the hard part. Your databases must replicate across data centers, which introduces significant latency (cross-continent round trips are ~150ms). You have two choices:
Active-passive: One data center handles all writes, the other is a hot standby. Simpler, but writes from remote users are slow.
Active-active: Both data centers handle reads and writes. Better user experience, but you now have conflict resolution challenges — what happens when two users update the same record in different data centers simultaneously?
Session and cache synchronization: Your Redis sessions need to be available in both data centers, either through cross-DC replication or by using a global session store.
Failover testing: You should regularly test that failover actually works. Netflix's Chaos Monkey is the famous example — they randomly kill services and even entire regions in production to ensure resilience.
| Topology | Writes | Reads | Failover Complexity | Consistency |
|---|---|---|---|---|
| Active-Passive | Single DC | Both DCs | Medium — promote standby | Strong (single writer) |
| Active-Active | Both DCs | Both DCs | Low — already serving traffic | Eventual (conflict resolution needed) |
Stage 10: Message Queues and Async Processing
As your system grows, not every operation needs to happen synchronously. A message queue decouples producers (things that create work) from consumers (things that process work).
Example: When a user uploads a photo, you do not need to generate thumbnails before responding. Instead, put a message on the queue ("generate thumbnails for photo X") and respond to the user immediately. A separate worker picks up the message and does the work in the background.
How Message Queues Work
Producer sends a message to the queue (e.g., "process order #12345")
The message sits in the queue until a consumer is ready
Consumer picks up the message, processes it, and acknowledges completion
If the consumer crashes before acknowledging, the message goes back in the queue and another consumer picks it up
Common Use Cases
Email/notification sending — do not block the API response while sending an email
Image/video processing — resizing, transcoding, thumbnail generation
Analytics and logging — write events to a queue, process them in batch
Search index updates — after a database write, queue an index update for Elasticsearch
Order processing — validate payment, update inventory, send confirmation
Message Queue Technologies
| Technology | Best For | Key Feature |
|---|---|---|
| RabbitMQ | Task queues, work distribution | Message acknowledgment, routing, priority queues |
| Apache Kafka | Event streaming, high throughput | Persistent log, replay capability, 1M+ messages/sec |
| Amazon SQS | Simple queue without managing infrastructure | Fully managed, automatic scaling |
| Redis Streams | Lightweight streaming when you already have Redis | Low latency, built into Redis |
Key benefits:
Producers and consumers scale independently
The queue acts as a buffer during traffic spikes — if traffic doubles, messages queue up and consumers process them at their own pace
Failed tasks can be retried without affecting the user
You get natural rate limiting and backpressure
Interview tip: Whenever you identify a component that does work the user does not need to wait for, mention a message queue. It shows you understand async processing and system decoupling.
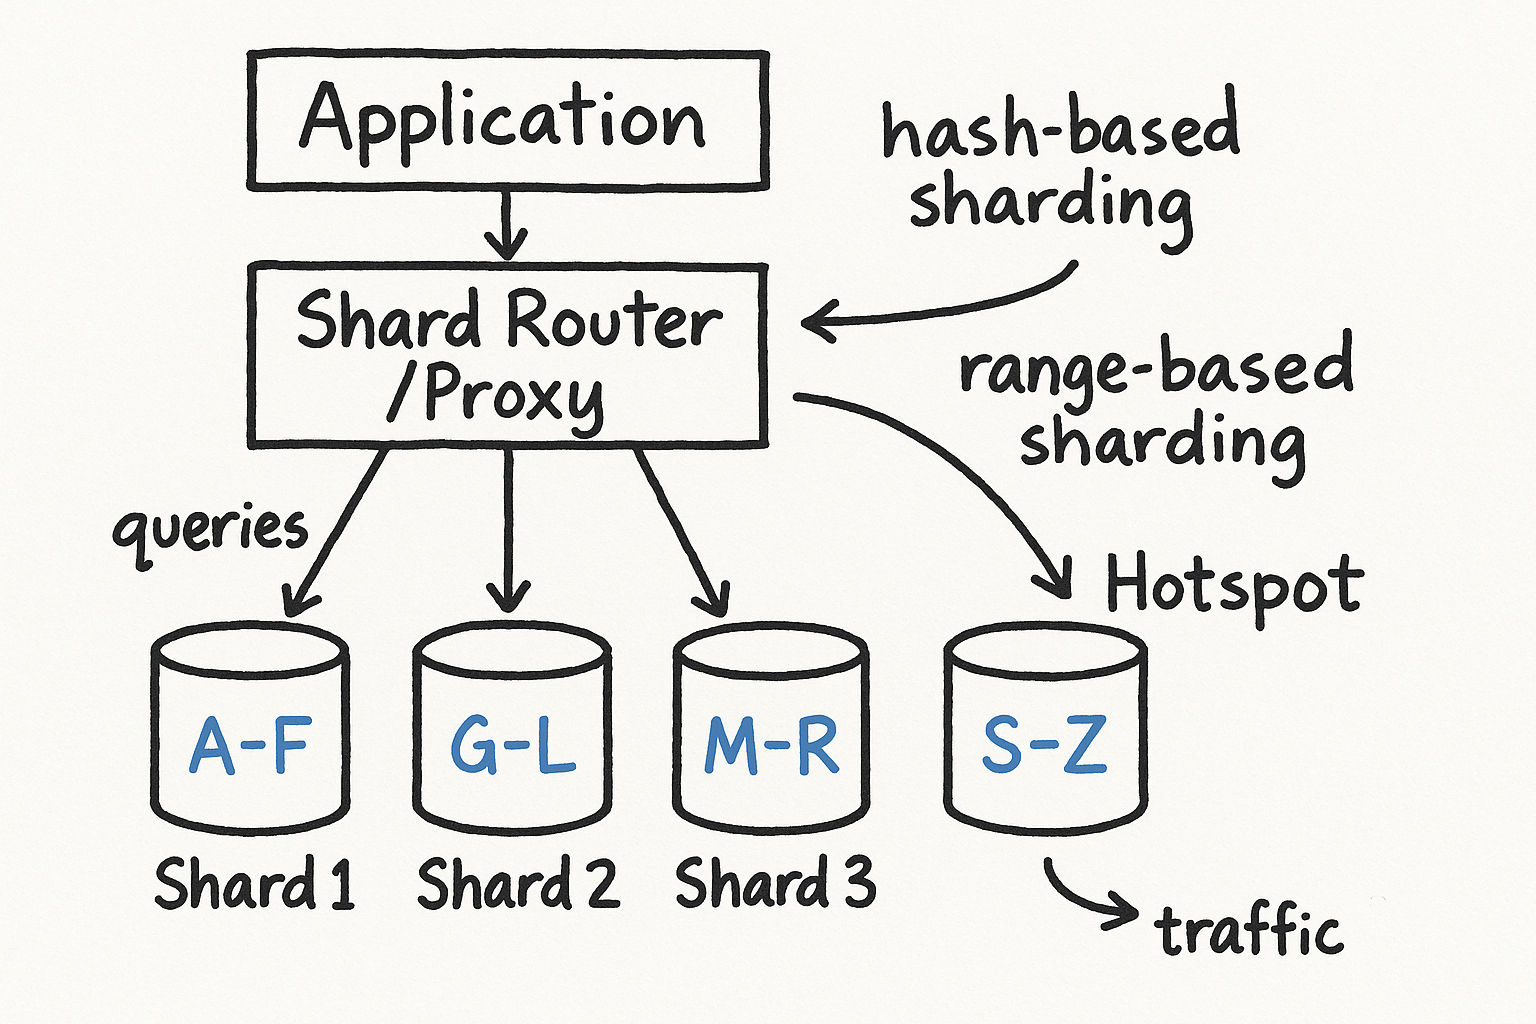
Stage 11: Database Sharding
When your database grows beyond what a single server (even a powerful one with replicas) can handle, you need to split the data across multiple database servers. This is sharding (also called horizontal partitioning).
Why Sharding Becomes Necessary
A single PostgreSQL server can typically handle:
Up to a few TB of data comfortably
10,000-50,000 QPS for simple queries
Write throughput of 5,000-20,000 inserts/second
When you exceed these limits, adding read replicas helps with reads but not with writes. Sharding splits the data itself, so each shard handles a fraction of the total load.
Sharding Strategies
Hash-based sharding: Hash a key (like user_id) and use modulo to determine which shard holds the data. Example: shard = hash(user_id) % num_shards. Distributes data evenly but makes range queries hard.
Range-based sharding: Shard by ranges. Users with IDs 1-1M go to shard 1, 1M-2M to shard 2, etc. Simple and supports range queries, but can create hot spots if traffic is not evenly distributed.
Directory-based sharding: A lookup service maps each key to a shard. Maximum flexibility but the directory is an additional component that can become a bottleneck.
| Strategy | Even Distribution | Range Queries | Complexity | Resharding |
|---|---|---|---|---|
| Hash-based | Excellent | Difficult | Low | Hard (rehashing) |
| Range-based | Can have hotspots | Easy | Medium | Medium |
| Directory-based | Controllable | Easy | High | Easy (update directory) |
Sharding Challenges
This is what interviewers really want to discuss — not just that you shard, but that you understand the pain:
Joins across shards: You can no longer JOIN tables that live on different shards. You either denormalize (duplicate data) or do application-level joins.
Resharding: Adding new shards means moving data. Consistent hashing helps minimize data movement.
Celebrity/hotspot problem: One shard might get disproportionate traffic (e.g., a celebrity user with millions of followers). Solutions include further splitting that shard or dedicated shards for hot keys.
Referential integrity: Foreign key constraints do not work across shards. Your application must enforce consistency.
Distributed transactions: A single transaction spanning multiple shards is complex and slow (two-phase commit). Avoid if possible.
Here is how you would explain sharding in an interview:
"We would shard our user database by user_id using consistent hashing. With 10 shards, each handles roughly 10% of our users. We use consistent hashing instead of simple modulo so that when we add a shard, we only need to move about 1/N of the data instead of rehashing everything. For queries that need data across shards — like a global leaderboard — we would precompute that asynchronously and store it in a separate aggregation table."
Interview tip: Only introduce sharding when you have demonstrated that simpler approaches (caching, read replicas) are not sufficient. Sharding is a last resort because of the operational complexity it introduces.
Monitoring and Observability at Every Stage
A system that you cannot observe is a system you cannot debug, scale, or improve. At every stage of scaling, you should be adding monitoring. This is something many candidates forget to mention, and bringing it up naturally shows operational maturity.
The Three Pillars of Observability
Metrics: Numerical measurements over time — CPU usage, QPS, latency percentiles, cache hit rate, error rate. Tools: Prometheus, Datadog, CloudWatch.
Logs: Detailed records of individual events — request logs, error logs, audit trails. Tools: ELK stack (Elasticsearch, Logstash, Kibana), Splunk.
Traces: End-to-end request paths through distributed systems — "this request hit the load balancer, then service A, then the database, and took 230ms total." Tools: Jaeger, Zipkin, AWS X-Ray.
Key Metrics by Component
| Component | Critical Metrics |
|---|---|
| Load Balancer | Active connections, request rate, error rate (5xx), latency |
| Application Servers | CPU, memory, QPS, response time (p50/p95/p99), error rate |
| Database | Query latency, connections, replication lag, disk usage, slow queries |
| Cache | Hit rate, miss rate, memory usage, eviction rate, latency |
| Message Queue | Queue depth, consumer lag, processing rate, error rate |
Here is how to mention this in an interview: "At each stage of our architecture, I would set up monitoring and alerting. Specifically, I would track cache hit rate — if it drops below 90%, something is wrong with our caching strategy. I would alert on replication lag exceeding 5 seconds, and on p99 latency exceeding our SLA. Distributed tracing would help us identify which component is the bottleneck when latency spikes."
Putting It All Together
Here is the mental model to carry into every interview:
| Stage | What You Add | What Problem It Solves | When You Need It |
|---|---|---|---|
| Separate DB | Independent scaling | Resource contention | Early — almost always the first move |
| Horizontal scaling + LB | Multiple app servers | Single point of failure, throughput ceiling | When one server cannot handle the load |
| DB replication | Read replicas | DB bottleneck, DB availability | When reads overwhelm a single DB |
| Cache | In-memory data store | Repeated expensive queries | When DB queries dominate latency |
| CDN | Edge servers | Latency for static content | When you have global users |
| Stateless tier | Shared session store | Server affinity, deployment flexibility | When you need autoscaling |
| Multi-DC | Geographic distribution | Global latency, disaster recovery | When you need regional availability |
| Message queue | Async processing | Tight coupling, traffic spikes | When you have background work |
| Sharding | Data partitioning | Write throughput, data volume | When a single DB cannot hold all data |
| Monitoring | Observability | Debugging, scaling decisions | From day one, but deepen at each stage |
When an interviewer asks you to "scale this system," walk through these stages in order. Not every system needs every stage — but you should be able to reason about when each one becomes necessary and why.
The key phrase to remember: "We add complexity only when the current architecture can no longer meet requirements." Every stage introduces operational overhead, and a great candidate shows they understand the cost of each addition, not just the benefit.