1.2 Back-of-the-Envelope Estimation
Why This Chapter Matters in Interviews
Back-of-the-envelope estimation is not about getting the exact right number. It is about demonstrating that you can reason quantitatively under uncertainty. Interviewers use estimation questions to test whether you can make reasonable assumptions, do basic arithmetic without a calculator, and use the results to make design decisions.
A candidate who says "we need a cache" without knowing the data size is guessing. A candidate who calculates that the working set is 200 GB and therefore fits in a single Redis instance is making an informed decision. That difference matters.
The best part about estimation skills is that they compound. Once you can estimate QPS, storage, and bandwidth confidently, every subsequent system design question becomes easier because you can quickly sanity-check your architecture against real numbers.
The Numbers Everyone Should Know
Before you can estimate anything, you need reference points. These numbers do not need to be exact — they need to be in the right ballpark. Memorize the order of magnitude, not the precise value.
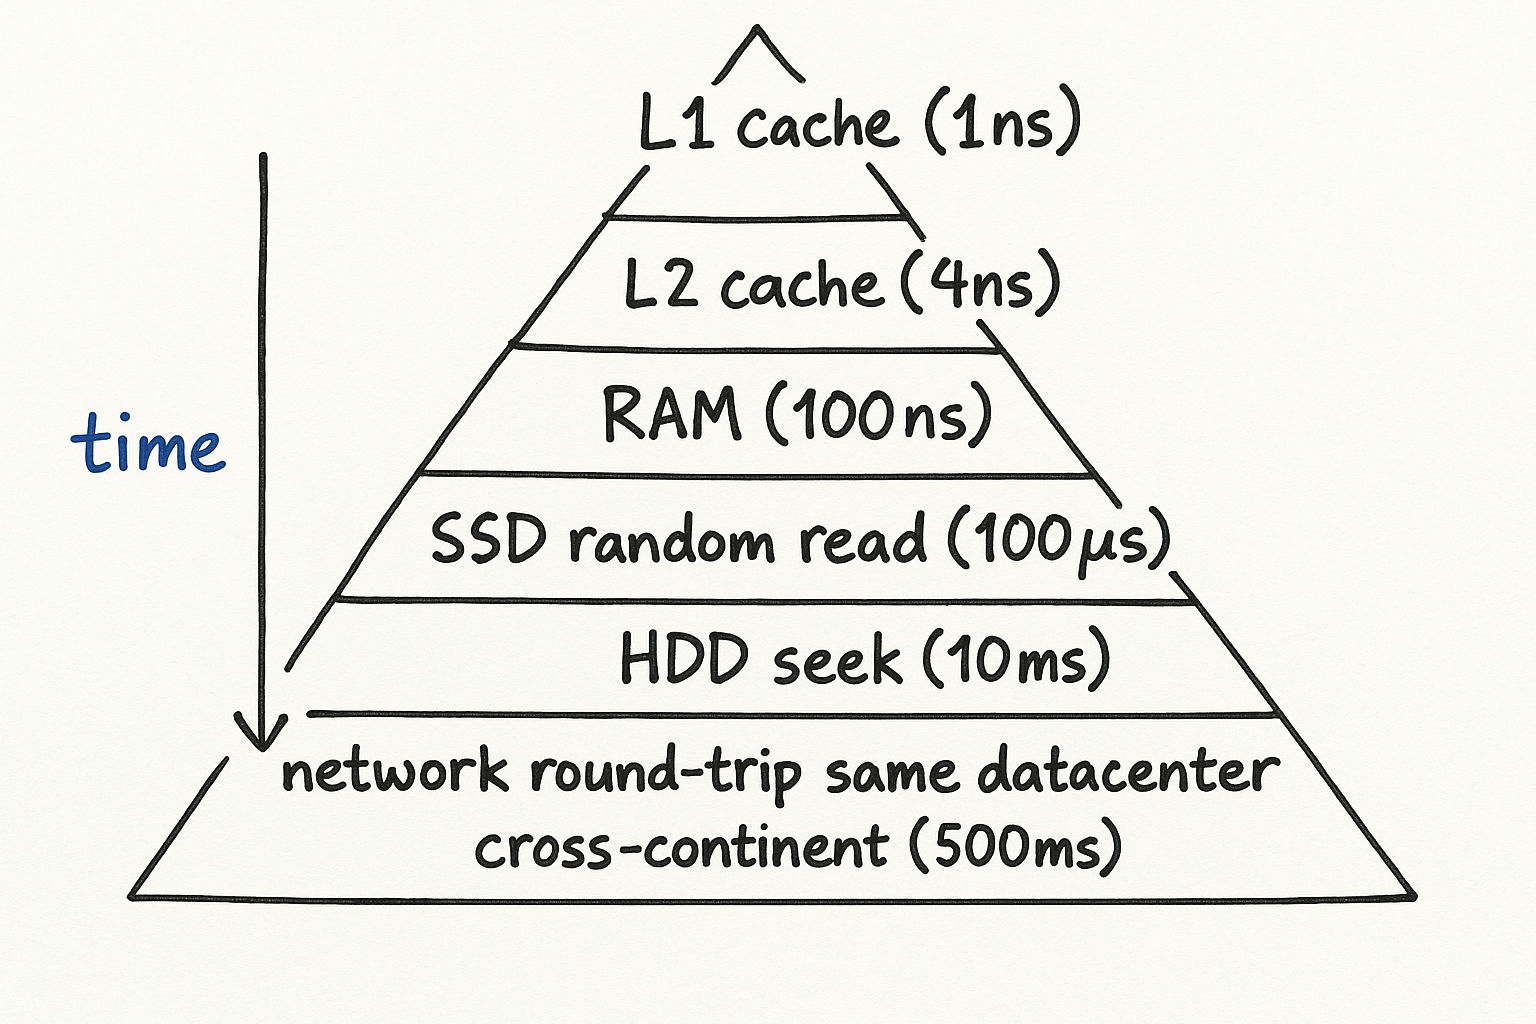
Latency Numbers
| Operation | Time | Notes |
|---|---|---|
| L1 cache reference | 0.5 ns | On the CPU die itself |
| L2 cache reference | 7 ns | Still on the CPU, but slower |
| Main memory reference | 100 ns | ~200x slower than L1 |
| SSD random read | 150 us | ~1,000x slower than memory |
| HDD random read | 10 ms | ~100x slower than SSD |
| Send 1 KB over 1 Gbps network | 10 us | Network is faster than disk for small payloads |
| Read 1 MB sequentially from memory | 250 us | Memory bandwidth is excellent for sequential access |
| Read 1 MB sequentially from SSD | 1 ms | SSDs shine at sequential reads |
| Read 1 MB sequentially from HDD | 20 ms | HDDs are acceptable for sequential, terrible for random |
| Round trip within same datacenter | 500 us | Same building, different rack |
| Round trip cross-continent | 150 ms | Speed of light is the bottleneck |
The takeaway: Memory is ~1,000x faster than SSD, and SSD is ~10x faster than HDD. Network round trips within a datacenter are cheap; cross-continent round trips are expensive. These ratios matter more than the exact numbers.
Here is how to use these in an interview:
"If each API call requires a database read that takes about 5ms on SSD, and we need to serve 10,000 QPS, that means we need enough database connections to handle 10,000 x 5ms = 50,000ms of work per second, so roughly 50 concurrent connections. But if we add a Redis cache with sub-millisecond reads, a 90% cache hit rate means only 1,000 requests per second actually hit the database, reducing our need to just 5 concurrent connections."
Interview tip: You do not need to recite these numbers from memory. What matters is knowing the relative order of magnitude. Memory is nanoseconds, SSD is microseconds, HDD is milliseconds, cross-continent is hundreds of milliseconds. That hierarchy is what drives design decisions.
Power-of-Two Reference Table
Working in powers of 2 is essential for estimation because computer systems are built on binary. Here is your reference:
| Power | Exact Value | Approximate Size | Common Usage |
|---|---|---|---|
| 10 | 1,024 | 1 Thousand (1 KB) | A short text message |
| 16 | 65,536 | 64 KB | A typical TCP window size |
| 20 | 1,048,576 | 1 Million (1 MB) | A high-res photo |
| 24 | 16,777,216 | 16 MB | A large JSON API response |
| 30 | 1,073,741,824 | 1 Billion (1 GB) | RAM on a basic server |
| 32 | 4,294,967,296 | 4 GB | Addressable space with 32-bit integers |
| 40 | ~1.1 x 10^12 | 1 Trillion (1 TB) | A large database |
| 50 | ~1.1 x 10^15 | 1 Quadrillion (1 PB) | Large-scale data warehouse |
Practical shortcuts for interviews:
2^10 is approximately 10^3 (a thousand)
2^20 is approximately 10^6 (a million)
2^30 is approximately 10^9 (a billion)
So to convert between binary and decimal: every 10 bits is roughly 3 decimal digits
Example of using powers of 2 in estimation:
"Each user record is about 1 KB. We have 100 million users. That is 100M x 1 KB = 100 GB. Since 100 GB fits comfortably in memory on a large server (which might have 256 GB RAM), we could potentially cache all user records in a single Redis instance."
Common Size References
These are useful anchors when you need to estimate how big things are:
| Data Type | Typical Size |
|---|---|
| A UUID / GUID | 16 bytes (128 bits) |
| A tweet / short text message | 140-280 bytes |
| A typical JSON API response | 1-10 KB |
| A user profile record in a database | 0.5-2 KB |
| A compressed web page (HTML + CSS) | 50-200 KB |
| A JPEG photo (web quality) | 200-500 KB |
| A JPEG photo (high resolution) | 2-5 MB |
| A minute of MP3 audio | 1 MB |
| A minute of 720p video | 5-10 MB |
| A minute of 1080p video | 15-25 MB |
| A minute of 4K video | 50-100 MB |
Availability Numbers (SLA Calculations)
Systems are often described by their "nines" of availability. This section is critical because interviewers expect you to know what availability targets mean in practical terms.
| Availability | Downtime/Year | Downtime/Month | Downtime/Week | Downtime/Day |
|---|---|---|---|---|
| 99% (two nines) | 3.65 days | 7.3 hours | 1.68 hours | 14.4 minutes |
| 99.5% | 1.83 days | 3.65 hours | 50.4 minutes | 7.2 minutes |
| 99.9% (three nines) | 8.77 hours | 43.8 minutes | 10.1 minutes | 1.44 minutes |
| 99.95% | 4.38 hours | 21.9 minutes | 5.04 minutes | 43.2 seconds |
| 99.99% (four nines) | 52.6 minutes | 4.38 minutes | 1.01 minutes | 8.6 seconds |
| 99.999% (five nines) | 5.26 minutes | 26.3 seconds | 6.05 seconds | 864 ms |
Most web services target three to four nines. Five nines is extremely difficult and expensive to achieve — it means your system can only be down for about 5 minutes per year total.
Calculating Combined Availability
When two components are in series (both must work), multiply their availabilities:
Service A at 99.9% + Service B at 99.9% = 99.9% x 99.9% = 99.8%
When two components are in parallel (either can serve traffic), the formula is:
1 - (1 - 0.999) x (1 - 0.999) = 1 - 0.001 x 0.001 = 99.9999%
This is why redundancy matters so much. Two servers each at 99.9% availability, running in parallel behind a load balancer, give you 99.9999% — six nines. But three services in series, each at 99.9%, give you only 99.7%.
Here is how to use this in an interview:
"Our system has a load balancer, an application tier, a cache, and a database — four components in series. If each is at 99.9%, our overall availability is 99.9%^4 = 99.6%, which is less than three nines. That is about 1.5 days of downtime per year. To improve this, we should add redundancy at each layer — two load balancers, multiple app servers, Redis cluster, and database replicas. With redundancy, each layer approaches 99.99%, and the overall system stays above 99.9%."
Interview tip: When an interviewer asks about availability requirements, always translate the nines into actual downtime. Saying "we need four nines" is less impactful than saying "we can only be down for 52 minutes per year, which means our deployment process, database failover, and any incident response must all happen within that budget."
A Framework for Estimation
When an interviewer asks "how much storage does this system need?" or "how many servers do we need?", follow this process:
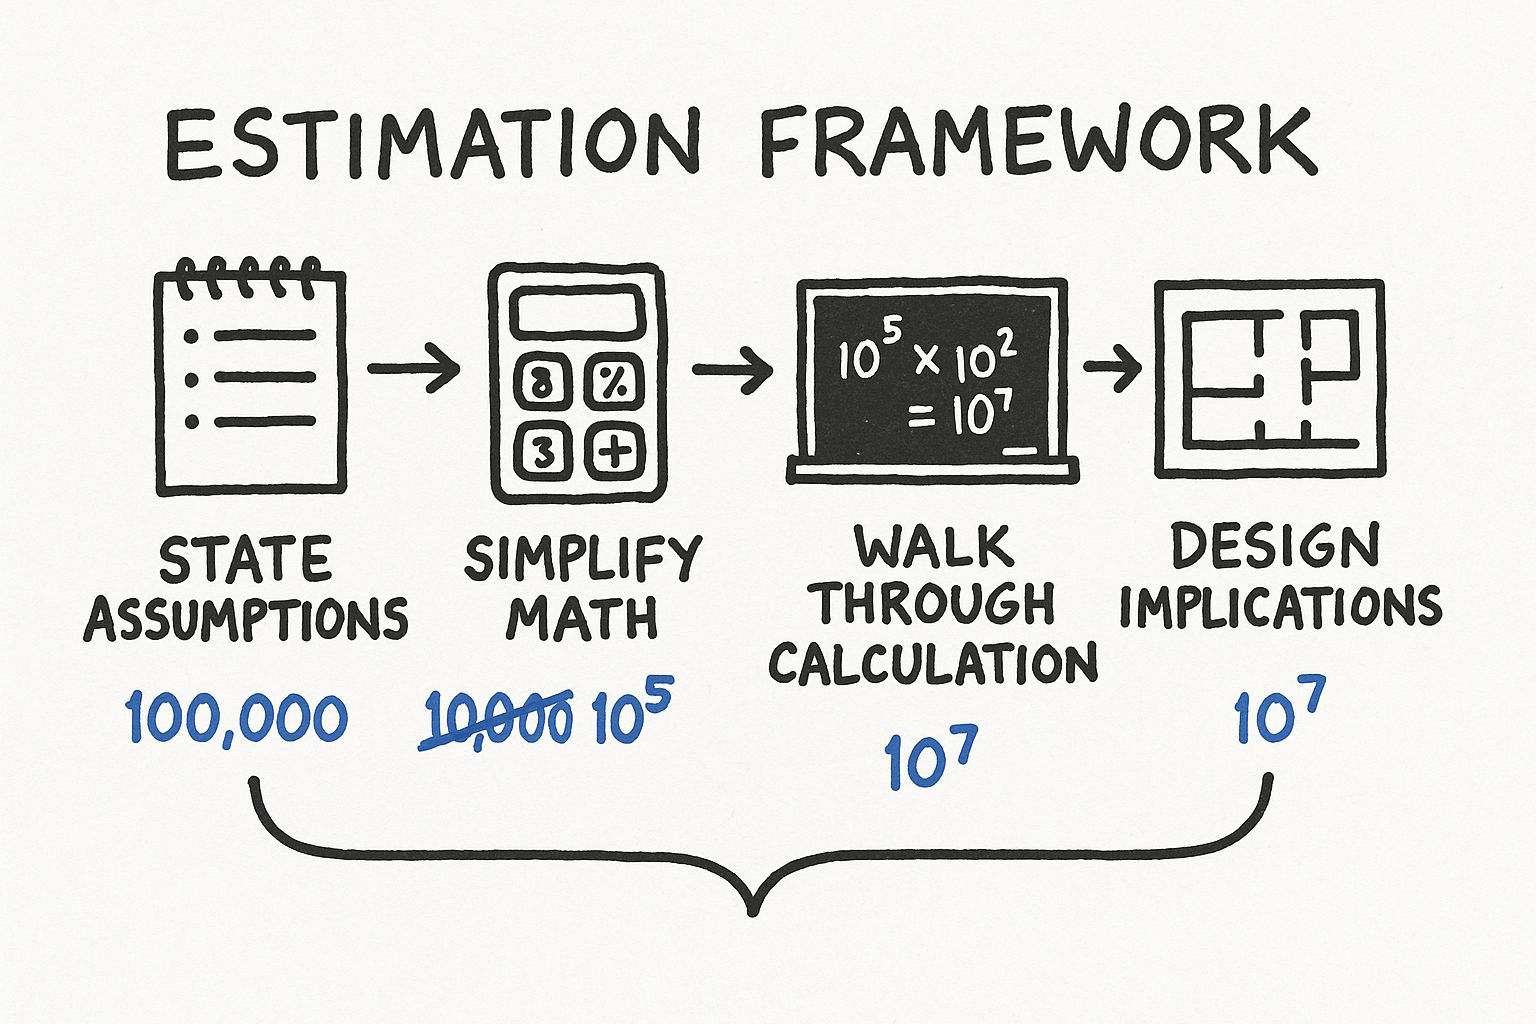
Step 1: State Your Assumptions Clearly
This is the most important step. Every estimation starts with assumptions, and interviewers want to see yours. State them explicitly.
Example: "I will assume we have 100 million daily active users. Each user makes an average of 5 requests per day. Each request involves about 2 KB of data."
Do not worry about getting assumptions exactly right. Worry about making them reasonable and transparent. The interviewer will correct you if something is wildly off — that is a collaborative moment, not a failure.
Good assumptions have these qualities:
They are based on something concrete (industry benchmarks, common sense, problem constraints)
They are round numbers (easy to compute with)
They are stated before any calculation begins
Bad assumptions are:
Unstated — the interviewer cannot evaluate reasoning they cannot see
Unreasonable — 10 billion daily active users for a new startup
Too precise — "each user sends exactly 3.7 messages per day" (false precision)
Step 2: Simplify the Math
Round aggressively. In estimation, 10 million and 12 million are the same number. Use powers of 10 and simple fractions.
Conversions that help:
1 day = 86,400 seconds, approximately 100,000 seconds (10^5). This is the single most useful conversion.
1 million requests/day = ~12 requests/second (10^6 / 10^5 = 10, but closer to 12)
1 billion requests/day = ~12,000 QPS
1 month is approximately 2.5 million seconds (convenient for monthly calculations)
1 year is approximately 30 million seconds
Quick QPS conversion table:
| Daily Requests | Approximate QPS | Peak QPS (3x) |
|---|---|---|
| 1 million | 12 | 36 |
| 10 million | 120 | 360 |
| 100 million | 1,200 | 3,600 |
| 1 billion | 12,000 | 36,000 |
| 10 billion | 120,000 | 360,000 |
Step 3: Walk Through the Calculation
Show your work. Do not just announce a number. Interviewers are evaluating your reasoning process, not your final answer.
Example — estimating storage for a photo sharing service:
"Assumptions: 50 million DAU, 10% upload a photo daily, average photo size is 500 KB."
New photos per day: 50M x 0.1 = 5 million
Storage per day: 5M x 500 KB = 2.5 TB/day
Storage per year: 2.5 TB x 365 = approximately 900 TB, roughly 1 PB/year
Now you can reason about it: "At roughly 1 PB per year, we would need a distributed storage system like S3 or HDFS. A single machine will not handle this. We should also think about a CDN to serve these images efficiently and reduce load on our storage layer."
Step 4: Derive Design Implications
The estimation should lead somewhere. Convert the number into a decision. This is what separates a good estimation from a great one.
QPS thresholds and their implications:
| QPS Range | What It Means | Architecture Implications |
|---|---|---|
| Less than 100 | Very low traffic | Single server is fine |
| 100-1,000 | Moderate traffic | Single server, but plan for scaling |
| 1,000-10,000 | Significant traffic | Need horizontal scaling, load balancing, caching |
| 10,000-100,000 | High traffic | Multiple data centers, heavy caching, async processing |
| 100,000+ | Massive traffic | Multi-region, edge computing, specialized infrastructure |
Storage thresholds:
| Storage Range | What It Means | Architecture Implications |
|---|---|---|
| Less than 10 GB | Tiny | Single database server, no special handling |
| 10 GB - 1 TB | Moderate | Single database with proper indexing |
| 1-10 TB | Large | Need sharding strategy or managed distributed database |
| 10-100 TB | Very large | Distributed database, data partitioning essential |
| 100 TB+ | Massive | Dedicated distributed storage (HDFS, S3), data lifecycle policies |
Memory/cache thresholds:
| Cache Size | What It Means | Architecture Implications |
|---|---|---|
| Less than 10 GB | Small | Single Redis instance handles this easily |
| 10-100 GB | Moderate | Single large Redis instance or small cluster |
| 100 GB - 1 TB | Large | Redis cluster with multiple shards |
| 1 TB+ | Very large | Distributed cache, consider what really needs caching |
Worked Examples
Practice estimation problems are the best way to build confidence. Here are several worked examples covering different resource types.
Example 1: Estimate QPS for a Twitter-like Service
"Estimate the read and write QPS for a Twitter-like service with 300 million monthly active users."
Assumptions:
300M monthly active users (MAU)
DAU is roughly 50% of MAU = 150M DAU
Each user views their timeline 5 times per day (reads)
Each timeline load fetches 20 tweets
5% of users tweet at least once per day
Average tweeting user posts 2 tweets per day
Read QPS:
Timeline reads per day: 150M x 5 = 750M
Tweet fetches per day: 750M x 20 = 15 billion (but these come from cache, not DB)
Timeline QPS: 750M / 100K = 7,500 QPS
Peak timeline QPS: 7,500 x 3 = 22,500 QPS
Write QPS:
Tweets per day: 150M x 0.05 x 2 = 15M tweets/day
Write QPS: 15M / 100K = 150 QPS
Peak write QPS: 150 x 3 = 450 QPS
Design implication: "The read-to-write ratio is about 50:1. This is extremely read-heavy, which means we should invest heavily in caching (precomputed timelines in Redis) and read replicas. The write path is modest — 450 peak QPS is easily handled by a single database primary. The real challenge is fan-out: when a user with 10 million followers tweets, that single write needs to be delivered to 10 million timelines."
Example 2: Estimate Storage for YouTube
"Estimate the daily storage requirement for YouTube."
Assumptions:
500 hours of video uploaded per minute (this is roughly the real number)
Average video quality: 720p
720p video: approximately 1.5 GB per hour (compressed)
YouTube stores multiple resolutions: 360p, 480p, 720p, 1080p, 4K
Total storage per hour of source video (all resolutions): approximately 5 GB
Calculation:
Hours uploaded per day: 500 hours/min x 60 min x 24 hours = 720,000 hours/day
Raw storage per day: 720,000 x 5 GB = 3.6 PB/day
Per year: 3.6 PB x 365 = approximately 1.3 EB (exabytes) per year
Design implication: "At 3.6 PB per day, this absolutely requires a distributed object storage system. You cannot use a traditional database for video blobs. We are talking about a custom-built storage infrastructure on the scale of Google's Colossus file system. We also need aggressive CDN caching — popular videos should never be fetched from origin storage."
Example 3: Estimate Bandwidth for Netflix
"Estimate the peak bandwidth Netflix needs to serve its users."
Assumptions:
200 million subscribers
At peak time (evening), roughly 10% are streaming simultaneously = 20 million concurrent streams
Average stream quality: 5 Mbps (between 1080p and 4K)
Calculation:
Peak bandwidth: 20M x 5 Mbps = 100 million Mbps = 100 Tbps
Design implication: "100 Tbps is an enormous amount of bandwidth. This is why Netflix operates its own CDN (Open Connect). They place custom hardware directly inside ISP networks so that video traffic never crosses the broader internet. Without this, the internet backbone could not handle it."
Example 4: Estimate Memory for a Session Store
"How much memory do we need for a session store for a service with 50 million DAU?"
Assumptions:
50M DAU
Not all users are active simultaneously — assume peak concurrent users is 10% = 5M
Each session object: 2 KB (user ID, auth token, preferences, recent activity)
Sessions expire after 30 minutes of inactivity
Calculation:
Peak memory: 5M x 2 KB = 10 GB
Design implication: "10 GB fits easily in a single Redis instance (which can handle up to ~100 GB). We do not need a Redis cluster for sessions alone. However, we should run at least two Redis instances with replication for high availability — if our session store goes down, every user gets logged out."
Estimation for Different Resource Types
Different types of resources require different estimation approaches. Here is a framework for each:
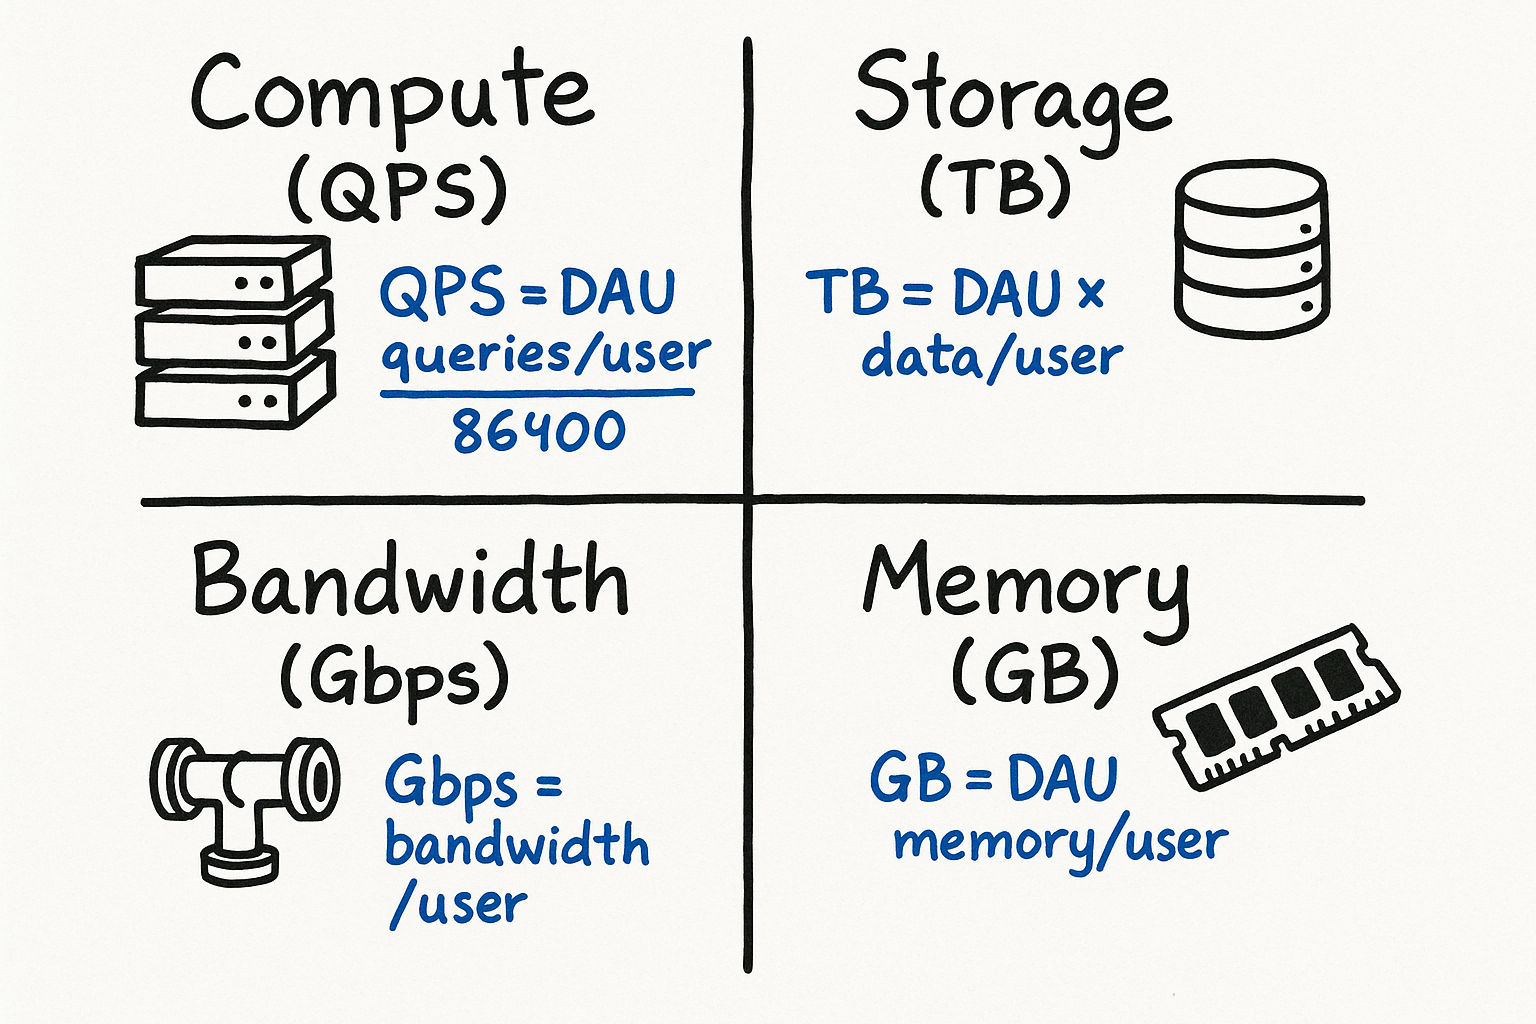
Compute Estimation
To estimate how many servers you need:
Calculate peak QPS
Estimate how many requests one server can handle (typically 1,000-10,000 QPS for a web server, depending on complexity)
Divide peak QPS by per-server capacity
Add 30-50% headroom for safety
Example: 50,000 peak QPS with servers that each handle 5,000 QPS = 10 servers. Add 50% headroom = 15 servers.
Storage Estimation
Calculate daily new data
Determine retention period (do you keep data forever? 90 days? 7 years?)
Multiply to get total storage
Add 2-3x for replication (typically 3 replicas)
Bandwidth Estimation
Calculate peak QPS (both reads and writes)
Multiply by average payload size
Account for protocol overhead (HTTP headers, TLS — roughly 20% overhead)
Separate ingress (incoming) from egress (outgoing) — they are often very different
Memory Estimation
Identify the hot data set (what gets accessed frequently)
Estimate its size
Apply cache hit rate target (e.g., to cache 90% of requests, you need the top 10-20% of data in memory, thanks to the Pareto principle)
Common Estimation Patterns
QPS Estimation
Given DAU, estimate queries per second:
QPS = DAU x (average queries per user per day) / 86,400
Peak QPS = QPS x 2 to 5 (depending on traffic pattern)
For social media: peak is typically 3x average
For e-commerce during flash sales: peak can be 10-20x average
For global services: peak depends on time zones (less spiky than single-region)
Example: 100M DAU, 10 queries/user/day
QPS = 100M x 10 / 100K = 10,000
Peak QPS = 20,000-50,000
Storage Estimation
Daily new data = DAU x (% who create content) x (average content size)
Annual storage = daily x 365
Total storage with replication = annual x replication factor x retention years
Bandwidth Estimation
Incoming bandwidth = Write QPS x average request size
Outgoing bandwidth = Read QPS x average response size
Total bandwidth = incoming + outgoing (but outgoing usually dominates)
Practice Problem: Estimate the Storage for a Messaging Platform
Try this before reading the answer:
"Estimate the daily storage requirement for a messaging platform with 500 million daily active users."
One reasonable approach:
500M DAU
Average user sends 40 messages/day
Average message size: 100 bytes of text
20% of messages include a media attachment averaging 200 KB
Text storage per day:
500M x 40 x 100 bytes = 2 x 10^12 bytes = 2 TB/day
Media storage per day:
500M x 40 x 0.2 x 200 KB = 800 x 10^9 KB = 800 TB/day
Total: ~800 TB/day (media dominates by ~400x)
Design implication: Media storage is the real challenge. You need a blob storage solution (like S3), and text can go in a regular database. This kind of insight — derived from estimation — is exactly what interviewers want to hear.
Follow-up considerations an interviewer might ask:
"What about message metadata?" — Sender, recipient, timestamp, read status adds maybe 200 bytes per message, which is negligible compared to media.
"What about message retention?" — If we keep messages for 5 years, that is 800 TB x 365 x 5 = approximately 1.5 EB of media. This requires a storage lifecycle policy — move old media to cheaper cold storage.
"What about encryption?" — End-to-end encryption adds negligible overhead to message size (a few hundred bytes for keys and metadata).
Practice Problem: Estimate the Cost of a CDN
"Roughly how much would it cost to serve 1 billion page views per month, where each page averages 2 MB of content, using a CDN?"
Calculation:
Total data transfer: 1B x 2 MB = 2 PB/month
CDN pricing varies, but a rough average is /bin/zsh.02-0.08 per GB for high-volume customers
At /bin/zsh.04/GB: 2 PB = 2,000 TB = 2,000,000 GB
Cost: 2,000,000 x /bin/zsh.04 = ,000/month
Design implication: "At K/month just for CDN, we should aggressively optimize asset sizes. Compressing images, using modern formats like WebP and AVIF, minifying JavaScript — if we cut average page size from 2 MB to 500 KB, we save K/month. Also, setting long cache TTLs on static assets reduces origin fetches and further reduces cost."
Common Mistakes and How to Avoid Them
Mistake 1: Not Stating Assumptions
The interviewer cannot evaluate your reasoning if they cannot see your starting point. Always begin with "Let me state my assumptions" and list them explicitly.
Bad: "So the storage would be about 500 TB." (Where did this come from?)
Good: "Let me assume 100M DAU, 10% create content daily, average content size is 500 KB. So daily storage is 100M x 0.1 x 500 KB = 5 TB per day, and yearly is about 1.8 PB."
Mistake 2: False Precision
Saying "the QPS is 11,574" is worse than saying "roughly 12,000." You are not computing a tax return. In estimation, being within 2-5x of the real answer is considered good. Being within 10x is acceptable.
Round your intermediate numbers aggressively. If you calculate 8,640,000 at an intermediate step, just call it 10 million and move on. The time you save on arithmetic is better spent on analysis.
Mistake 3: Stopping at the Number
An estimation is only useful if it informs a design decision. Always connect the number to "so this means we need X."
Bad: "We will need about 50 TB of storage per year."
Good: "We will need about 50 TB per year. That means a single PostgreSQL instance can handle this for the first 2-3 years, but we should plan for sharding or moving to a distributed database by year 3. With 3x replication, we are looking at 150 TB of actual disk, which is about K/month on AWS EBS."
Mistake 4: Forgetting Peak vs. Average
Systems must handle peak traffic, not just average. Peak is typically 2-5x average for most web applications. For e-commerce during Black Friday, peak might be 10-20x average.
A useful rule of thumb: Design your system to handle 3x your calculated average QPS. This covers normal daily peaks (evenings, lunch hours). For known spike events (product launches, sporting events), plan for 10x.
Mistake 5: Ignoring Replication and Redundancy
When estimating storage, remember that production systems replicate data. A 100 TB dataset with 3x replication requires 300 TB of actual storage. With backups, that might be 400-500 TB total.
Mistake 6: Confusing Throughput and Latency
High throughput does not mean low latency. A system might process 100,000 requests per second but each request takes 500ms. These are different dimensions and both matter.
Mistake 7: Not Accounting for Growth
A system designed for today's numbers will be undersized next year. Good estimations include a growth projection: "At 20% annual growth, in 3 years our storage needs triple."
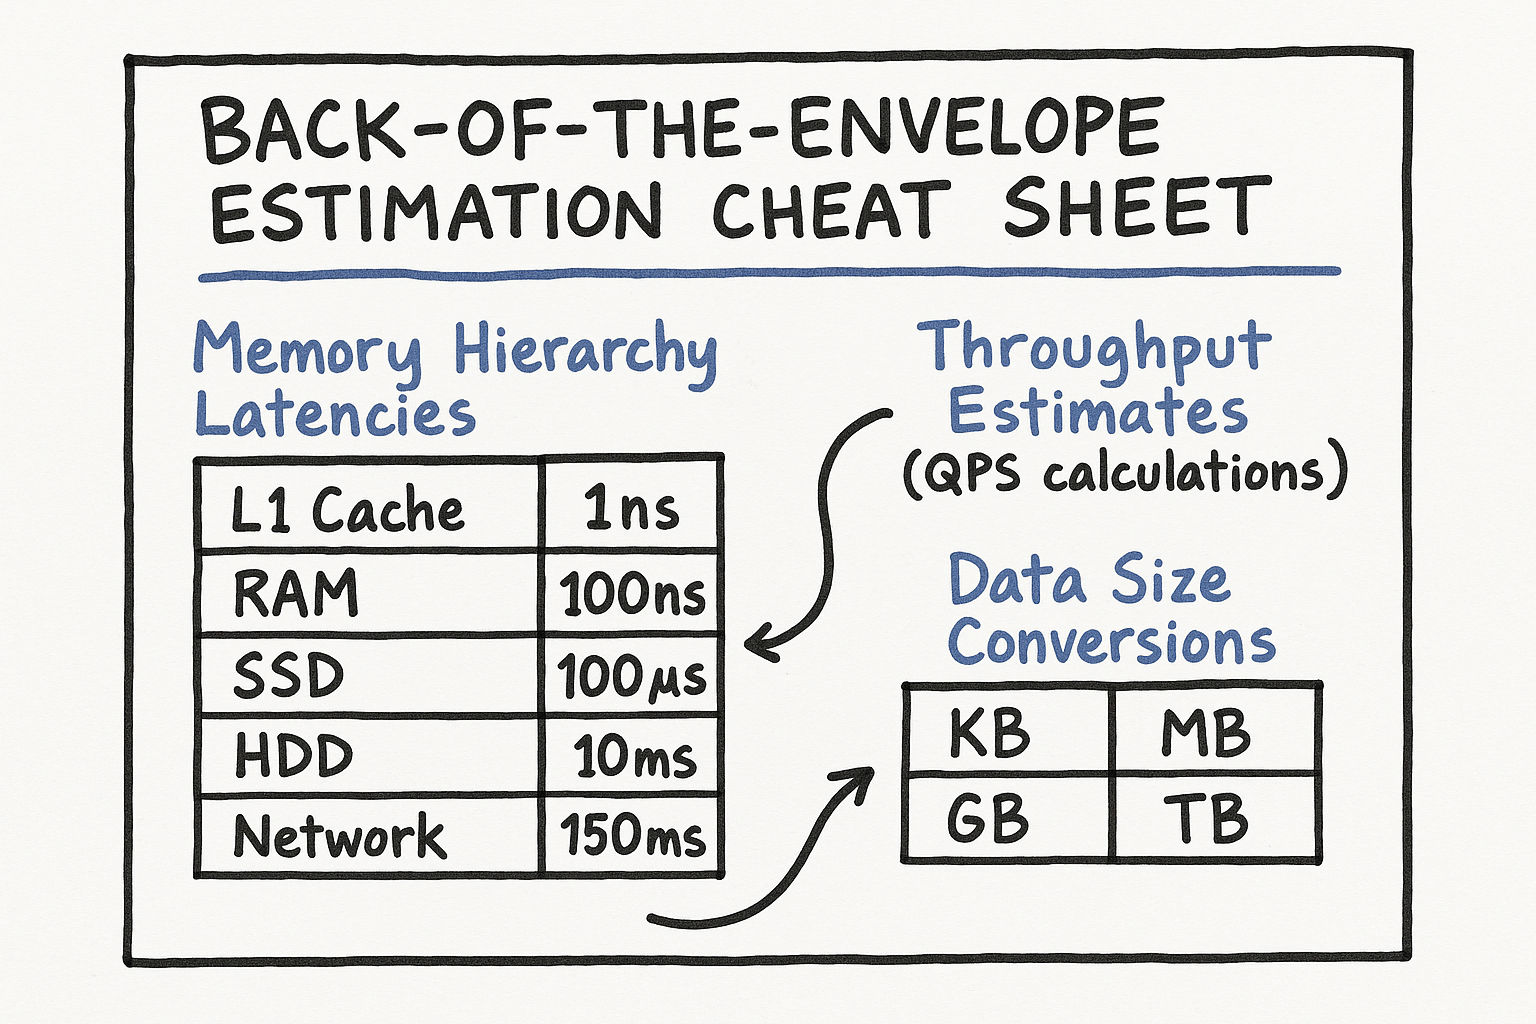
Quick Reference: Estimation Cheat Sheet
Here is a one-page reference you can internalize before interviews:
Time conversions:
1 day = ~100,000 seconds
1 month = ~2.5 million seconds
1 year = ~30 million seconds
Data conversions:
1 KB = 1,000 bytes (approximately)
1 MB = 1,000 KB
1 GB = 1,000 MB
1 TB = 1,000 GB
1 PB = 1,000 TB
Traffic conversions:
1M requests/day = ~12 QPS
1B requests/day = ~12,000 QPS
Server capacity rules of thumb:
A web server handles 1,000-10,000 QPS (depending on complexity)
A single Redis instance handles 100,000+ ops/sec
A single PostgreSQL server handles 10,000-50,000 simple QPS
A single machine can hold up to ~256 GB RAM (common large instance)
A single SSD can do ~10,000 random IOPS
The Pareto principle for caching: 20% of the data serves 80% of the requests. Caching the top 20% of your dataset usually gives you a 80%+ cache hit rate.
Interview tip: The goal of estimation is not mathematical precision — it is informed decision-making. Every number you calculate should connect to an architectural choice. If a number does not change your design, you probably did not need to calculate it.
Advanced Estimation: System Capacity Planning
Beyond single-dimension estimates, real interviews sometimes ask you to think about capacity planning holistically — combining compute, storage, bandwidth, and memory estimates into a complete picture.
Worked Example: Capacity Plan for an Instagram-like Service
"Design the capacity plan for a photo-sharing service with 200 million DAU."
Traffic estimation:
200M DAU
Average user views 30 photos per day (reads) and uploads 0.5 photos per day (writes)
Read requests: 200M x 30 = 6B/day = 70,000 QPS
Write requests: 200M x 0.5 = 100M/day = 1,200 QPS
Read-to-write ratio: approximately 60:1 (very read-heavy)
Storage estimation:
100M new photos per day
Average photo after compression: 300 KB
We store 3 sizes per photo (thumbnail, medium, full): 300 KB + 100 KB + 50 KB = 450 KB total per photo
Daily storage: 100M x 450 KB = 45 TB/day
Yearly storage: 45 TB x 365 = 16.4 PB/year
With 3x replication: approximately 50 PB/year
Bandwidth estimation:
Read bandwidth: 70,000 QPS x 300 KB average photo size = 21 GB/s = 168 Gbps
Write bandwidth: 1,200 QPS x 300 KB = 360 MB/s = approximately 3 Gbps
This confirms we need a CDN — serving 168 Gbps from our origin servers would be prohibitively expensive and slow
Cache estimation:
Following the 80/20 rule: 20% of photos get 80% of views
Daily unique photos viewed: assume 500 million unique photos
Hot set (top 20%): 100 million photos x 300 KB = 30 TB
This does not fit in a single cache — we need a distributed cache cluster (e.g., 30 Redis nodes with 1 TB each, or use CDN edge caching as the primary photo cache)
Compute estimation:
Each application server handles 5,000 QPS
For 70,000 read QPS: 14 servers (plus 50% headroom = 21 servers)
For image processing (thumbnail generation): 1,200 uploads/sec, each taking about 2 seconds of CPU time = need 2,400 CPU-seconds per second = approximately 40 processing workers (assuming 64-core machines)
Summary capacity plan:
| Resource | Estimate | Infrastructure |
|---|---|---|
| Read QPS | 70,000 (peak ~200,000) | 21 application servers + CDN |
| Write QPS | 1,200 (peak ~3,600) | 4 upload servers |
| Daily new storage | 45 TB | Distributed object storage (S3) |
| Annual storage | 50 PB (with replication) | S3 + lifecycle policies for cold storage |
| Photo cache | 30 TB hot set | CDN edge cache + distributed Redis |
| Read bandwidth | 168 Gbps | CDN handles most of this |
| Image processing | 40 worker machines | Background job queue |
Design implication: "The key insight from this capacity plan is that reads absolutely dominate. We need aggressive CDN caching — if our CDN hit rate is 95%, only 3,500 QPS reach our application servers, which is trivially handled by a handful of servers. The write path is modest but the storage growth is massive — 50 PB per year means we must have data lifecycle policies that move old content to cheaper cold storage tiers."
Estimation Under Pressure
In live interviews, you will not have a calculator. Here are tricks for doing math quickly:
Multiply large numbers: Break them into powers of 10.
500M x 40 = 5 x 10^8 x 4 x 10^1 = 20 x 10^9 = 20 billion
Division shortcuts:
Dividing by 86,400 (seconds per day)? Just divide by 100,000. You are off by 15%, which is fine.
Dividing by 30 (days per month)? Approximate as dividing by 32 (which is 2^5), then adjust slightly.
Percentage calculations:
5% of 200 million = 10 million (move decimal, divide by 2)
0.1% of 1 billion = 1 million (move decimal three places)
Sanity checks:
After every calculation, ask: "Does this number make sense?" If you calculate that a messaging app needs 1 EB of storage per day, something went wrong.
Compare to known systems: YouTube stores about 500 hours of video per minute. Netflix serves about 100 Tbps at peak. WhatsApp handles about 100 billion messages per day.
Interview tip: If you make an arithmetic mistake during the interview, it is totally fine to catch and correct it. Say "Wait, let me double-check that — 500 million times 40 is 20 billion, not 2 billion. Let me adjust." Self-correction demonstrates care and precision, which interviewers value highly.
Putting It All Together: The Estimation Mindset
The goal of back-of-the-envelope estimation is not mathematical precision — it is informed decision-making. Every number you calculate should connect to an architectural choice. Here is the mental process:
What am I trying to decide? (Do we need sharding? How big should the cache be? Can one server handle this?)
What numbers do I need to answer that question? (QPS, storage size, memory requirement)
What assumptions produce those numbers? (DAU, actions per user, data size per action)
Calculate with generous rounding (powers of 10, simple fractions)
State the design implication ("This means we need X" or "This confirms Y is sufficient")
If a number does not change your design, you probably did not need to calculate it. Focus your estimation effort on the numbers that sit at decision boundaries — the difference between "one server" and "need sharding," or between "fits in memory" and "must go to disk."
Practice this cycle on every system design problem you encounter, and estimation will become a natural part of your design thinking rather than a separate skill.