Market Sizing Interview Questions for Product Managers: Framework, Examples, and Estimation Drills
Quick Overview
Learn a six-step market sizing framework for PM interviews, see worked estimation examples, avoid common mistakes, and practice with linked questions.
A market sizing prompt sounds simple until the interviewer asks, "How many smart TVs are sold worldwide each year?" and waits. You have no research tab, no spreadsheet, and no perfect starting number. What you do have is a chance to show the core product-management skill behind the question: turning ambiguity into a decision-ready model.
The best answers are not lucky guesses. They define the market, choose a defensible structure, state assumptions, calculate cleanly, test the result, and explain what the estimate means for the product. This guide gives you that complete workflow, with worked examples and drills you can practice aloud.

Start by browsing Product Manager product and decision-making questions on PracHub. Attempt one estimation prompt before reading its solution; the gap between your first structure and the written solution will tell you what to train.
Quick answer: how do you solve a market sizing question?
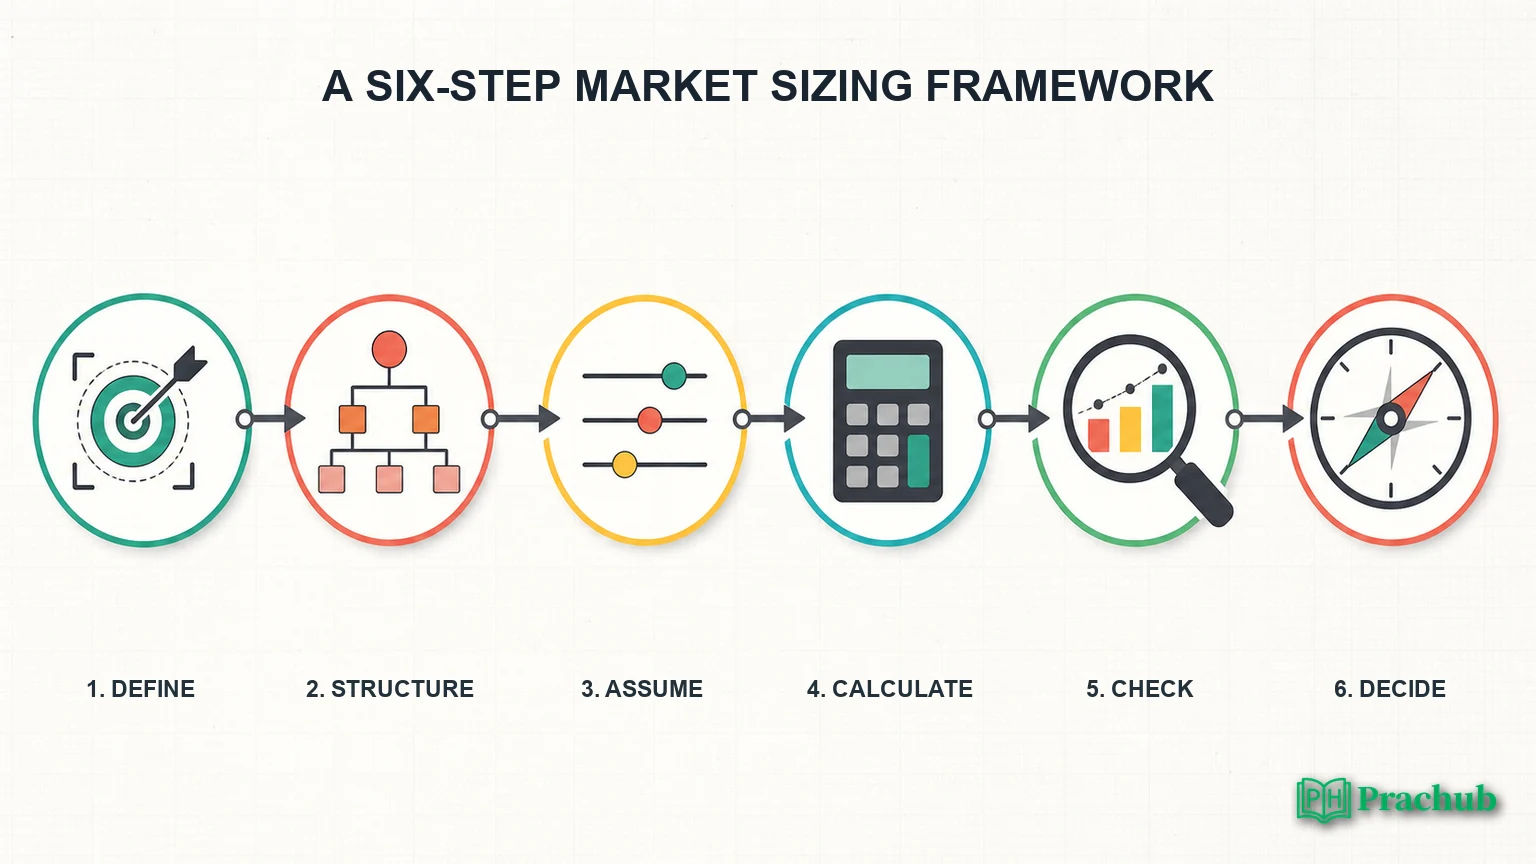
Use this six-step sequence:
| Step | What to do | What the interviewer learns |
|---|---|---|
| 1. Define | Clarify geography, customer, unit, time period, and whether the answer is volume or revenue. | You control ambiguity before calculating. |
| 2. Structure | Choose a top-down, bottom-up, replacement-cycle, or funnel model. | You can decompose a vague problem. |
| 3. Assume | Use rounded anchors and explain why each assumption is reasonable. | You make uncertainty visible instead of hiding it. |
| 4. Calculate | Write the equation, track units, and keep the arithmetic auditable. | You can reason quantitatively under pressure. |
| 5. Check | Use a second method, range, or known comparison to test the order of magnitude. | You catch your own errors. |
| 6. Decide | Translate the estimate into a product recommendation or next research step. | You think like a PM, not only a calculator. |
Your final number matters less than whether the reasoning chain is coherent, easy to challenge, and useful for a decision. A strong candidate can revise one assumption without rebuilding the entire answer.
What market sizing questions actually test
Market sizing is often grouped with estimation or Fermi questions, but in PM interviews it is rarely just mental math. Interviewers watch how you define a user, select the important drivers, communicate uncertainty, and move from analysis to action.
Five signals usually matter:
- Scoping: Do you clarify what is included and excluded?
- Decomposition: Can you build a mutually exclusive model without double-counting?
- Assumption quality: Are your estimates grounded in familiar anchors or explained logic?
- Numerical control: Can you keep units, percentages, and orders of magnitude straight?
- Product judgment: Can you explain what you would do with the answer?
The last signal separates a PM answer from a classroom exercise. After estimating the market, identify the reachable segment, the assumption to validate first, and the evidence that would change your recommendation.
A six-step market sizing framework that works
Step 1: define the target precisely
Before calculating, clarify whether the interviewer wants units, revenue, users, transactions, capacity, or TAM. Confirm geography, customer, time period, and product boundaries.
For "How big is the smart-TV market?" useful questions include: worldwide or one country, unit shipments or revenue, consumer purchases only, and one year or the installed base? Two short clarifications can prevent ten minutes of solving the wrong problem.
Step 2: choose the model before the numbers
Say the equation out loud before supplying assumptions. For annual smart-TV units, a replacement-cycle model might be:
households x TVs per household / replacement years x smart-TV share
For a paid app, a demand funnel might be:
eligible users x problem incidence x willingness to pay x annual price
This lets the interviewer correct your structure early and prevents you from inventing numbers first, then trying to connect them afterward.
Step 3: state assumptions as ranges
Use round numbers because false precision wastes time. If you think a variable lies between 20% and 30%, choose 25% for the base case and say you will test the range later. Explain the driver: replacement frequency, adoption, household penetration, conversion, price, or usage.
You need only a small set of anchors: population, households, working days, hours per day, and common price bands. The real skill is deriving unfamiliar numbers from familiar ones.
Step 4: calculate in an auditable order
Keep units beside every figure. Convert percentages before multiplying, round when the decision will not change, and pause after each major step. If a result jumps from millions to billions, name the conversion aloud.
If you notice an arithmetic error, correct it calmly and continue. Transparent recovery is better than defending a broken number.
Step 5: sanity-check the result
Test the answer using an independent anchor. If you estimate 40 million annual TV sales in a country with about 130 million households, that implies roughly one TV purchase per three households each year. Ask whether that matches the assumed number of TVs and replacement cycle.
Give a range, identify the most sensitive assumption, and name the real-world data you would request next. A range shows judgment; a precise point estimate often shows overconfidence.
Step 6: turn the estimate into a product decision
Close with an implication. A large market may still be unattractive if acquisition is expensive, the segment is fragmented, or willingness to pay is weak. A smaller market may be compelling if retention, margins, or strategic leverage are unusually strong.
A good close sounds like this: "The base case suggests a roughly $400 million paid market. I would first validate willingness to pay and retention in two high-intent segments because those assumptions create most of the range."
Top-down vs bottom-up: which approach should you use?
| Approach | Start with | Works best for | Main risk |
|---|---|---|---|
| Top-down | Population, households, businesses, or total spend | Consumer adoption, large categories, user counts | Broad percentages can hide weak segmentation. |
| Bottom-up | One store, team, customer, transaction, or sales unit | B2B products, physical locations, operational markets | An unrepresentative unit can distort the total. |
| Replacement cycle | Installed base divided by useful life | Phones, TVs, cars, appliances, enterprise hardware | It may miss first-time buyers and secondary markets. |
| Funnel | Eligible users through adoption and payment stages | Apps, subscriptions, new features, marketplaces | Correlated conversion assumptions can compound error. |
You can combine methods: solve with a demand funnel, then check against supplier capacity or another independent anchor. The second model only needs enough detail to expose a 10x mistake.
Worked example 1: annual U.S. smart-TV sales
Prompt: Estimate how many smart TVs are sold in the United States each year.
Clarify that we want consumer unit sales in a typical year, including replacements and first purchases. Use a replacement-cycle model.
- Assume roughly 130 million households.
- Assume 95% have a TV: about 124 million TV households.
- Assume 2.2 active TVs per TV household: about 273 million installed TVs.
- Assume a seven-year average replacement cycle: about 39 million replacement purchases per year.
- Add roughly 3 million units for new households and additional screens.
- Assume 90% of new TVs are smart TVs: approximately 38 million smart TVs per year.
Present a range of perhaps 30 to 50 million because TVs per household, replacement time, and smart share are uncertain. The most important sensitivity is the replacement cycle: moving from seven years to nine years reduces replacement demand substantially.
The PM implication is not simply "large market." If demand is replacement-driven, growth may depend on premium screens, services, operating-system share, or retail partnerships.
Worked example 2: a paid family meal-planning app
Prompt: Estimate the annual U.S. market for a paid family meal-planning app.
Define this as subscription revenue from households, excluding advertising and grocery commissions. Use a funnel:
- Start with 130 million households.
- Assume 70% cook at home several times per week: 91 million.
- Assume 30% experience a recurring planning problem serious enough to seek a solution: 27 million.
- Assume 15% would pay for a strong product: about 4.1 million paying households.
- At $8 per month, annual revenue per household is $96.
- The base-case paid market is therefore about $394 million per year.
Give a broad range because willingness to pay dominates the result. At 8% paid conversion, the market is near $210 million; at 25%, it approaches $650 million. A PM should validate that variable with pricing research and a paid pilot before investing heavily.
Then distinguish TAM, SAM, and SOM. If the serviceable segment is busy families using online grocery delivery and a realistic three-year share is 3%, the near-term opportunity may be closer to $12 million annually.
Market sizing questions to practice
Rotate across different model types so you learn decomposition rather than memorizing one template:
- How many electric-vehicle charging sessions occur in California each day?
- How many smart TVs are sold worldwide each year?
- Estimate the annual U.S. revenue of a peer-to-peer payments app.
- Estimate the daily data streamed by a global video platform.
- What is the market for an AI meeting assistant among U.S. knowledge workers?
- Estimate the addressable market for a premium family meal-planning app.
- How many sales professionals would adopt a new LinkedIn workflow?
- How many customer-support tickets could an AI agent resolve each year?
For every prompt, finish with one product implication and one piece of data you would gather next. That habit keeps the exercise connected to actual PM work.
Practice market sizing questions on PracHub
These drills cover consumer volume, infrastructure scale, revenue estimation, and opportunity sizing. Each complete title in the first column opens the question and written solution.
| PracHub question | Practice focus | Why it helps |
|---|---|---|
| Market Sizing & Product Metrics Drill | Starbucks locations, smart-TV sales, and product metrics | Combines two estimation models with the PM step of defining success. |
| YouTube Data Throughput Estimation | Users, watch time, bitrate, units, and sensitivity | Builds discipline with technical assumptions and unit conversions. |
| Market Sizing & Revenue Diagnostics | Views, revenue, regional drivers, and product implications | Moves from a number to strategy and diagnostic reasoning. |
| LinkedIn Product Case Opportunity Sizing | User segmentation, serviceable market, and adoption | Tests whether your segments support a realistic launch decision. |
Common mistakes that cost candidates
- Starting before defining the market: confirm whether the output is units, revenue, users, or capacity.
- Using one giant percentage: split demand into eligibility, problem frequency, adoption, and payment when those stages matter.
- Double-counting segments: make categories mutually exclusive or state the overlap.
- Inventing precision: round, provide a range, and identify the sensitive variable.
- Skipping the sanity check: convert the total back to a per-person or per-household figure.
- Ending at the number: recommend the next product decision and the evidence that could reverse it.
A seven-day estimation practice plan
| Day | Focus | What to do |
|---|---|---|
| Day 1 | Baseline | Answer one prompt in 15 minutes. Record where your structure, arithmetic, or communication broke. |
| Day 2 | Top-down models | Solve two population or household questions and finish each with a range. |
| Day 3 | Bottom-up models | Size a B2B SaaS market and a physical-location market from one operating unit. |
| Day 4 | Funnels and TAM | Build TAM, SAM, and SOM for a subscription product without treating them as the same number. |
| Day 5 | Technical estimation | Estimate traffic, storage, or data volume while keeping units visible. |
| Day 6 | Pressure test | Have a partner interrupt assumptions and ask follow-ups while you revise the model aloud. |
| Day 7 | Full simulation | Run three timed prompts, then redo only the weakest one after reviewing its solution. |
Frequently asked questions
What is a market sizing interview question?
It asks you to estimate volume, revenue, users, transactions, or capacity with limited data. Interviewers evaluate the definition, structure, assumptions, calculation, and validation.
Do product managers really get market sizing questions?
Yes. Estimation can appear inside strategy, analytical, execution, or technical rounds. Frequency varies, so prepare the reasoning pattern rather than assuming every loop has a standalone sizing question.
How accurate does my answer need to be?
A defensible order of magnitude matters more than false precision. State assumptions, give a range, and explain how you would validate sensitive inputs.
Should I use top-down or bottom-up market sizing?
Use the model with the clearest drivers. Top-down suits broad adoption; bottom-up suits B2B and operational markets. Use the other method as a quick check when possible.
What is the difference between TAM, SAM, and SOM?
TAM is broad theoretical demand, SAM is the portion you can serve, and SOM is the realistic share you can capture. Do not present TAM as a revenue forecast.
What numbers should I memorize?
Keep a short anchor sheet for population, households, workforce, days per year, and common price ranges. Practice deriving everything else.
Final takeaway
Market sizing interviews reward calm structure. Define the market, choose a model, state rounded assumptions, calculate visibly, test the result, and close with a product decision. That sequence is more valuable than memorizing a collection of polished answers.
Use PracHub's Product Manager product and decision-making questions to practice the framework against different companies and prompt types. Attempt the problem under time pressure, compare your structure with the written solution, and repeat until the reasoning survives follow-up questions.
Sources and Further Reading
- Best PM Jobs: Estimation Interview Questions for Product Managers
- ZeroPitch: PM Estimation Questions, Framework, and Examples
- PracHub Product Manager Product and Decision-Making Questions
- PracHub Google APM Interview Guide
Research note: This guide was checked on August 23, 2026. Interview formats and question mixes vary by company, role, level, and interviewer.
Related Articles
Product Alliance Review 2026: Are Its $570 PM Interview Courses Worth It?
Product Alliance review 2026: compare its $570 PM courses, $650 bundle, curriculum, refund policy, strengths, limitations, and alternatives.
Google Product Manager Resume Guide: Product Impact, Metrics, and Leadership Examples
Build a Google Product Manager resume that proves product impact, metrics, technical judgment, launches, and cross-functional leadership with examples.
Technical Product Manager Interview Questions: APIs, Metrics, Systems, and Product Trade-Offs
Prepare for Technical Product Manager interviews with API design, product metrics, system boundaries, reliability, and practical trade-off frameworks.
Capital One Product Manager Mini Case Interview Guide: Market Sizing, Metrics, and Product Judgment
Prepare for the Capital One PM mini case with market sizing, metrics, product judgment, a worked example, and linked practice questions.
Comments (0)