Technical Interview Pass Rates by Round: A PracHub Candidate-Reported Study
Quick Overview
An analysis of 1,407 PracHub candidate reports estimating progression rates for online assessments, take-homes, technical screens, and onsites, with sample sizes, uncertainty, and reporting-bias limits.
Technical Interview Pass Rates by Round: A PracHub Candidate-Reported Study
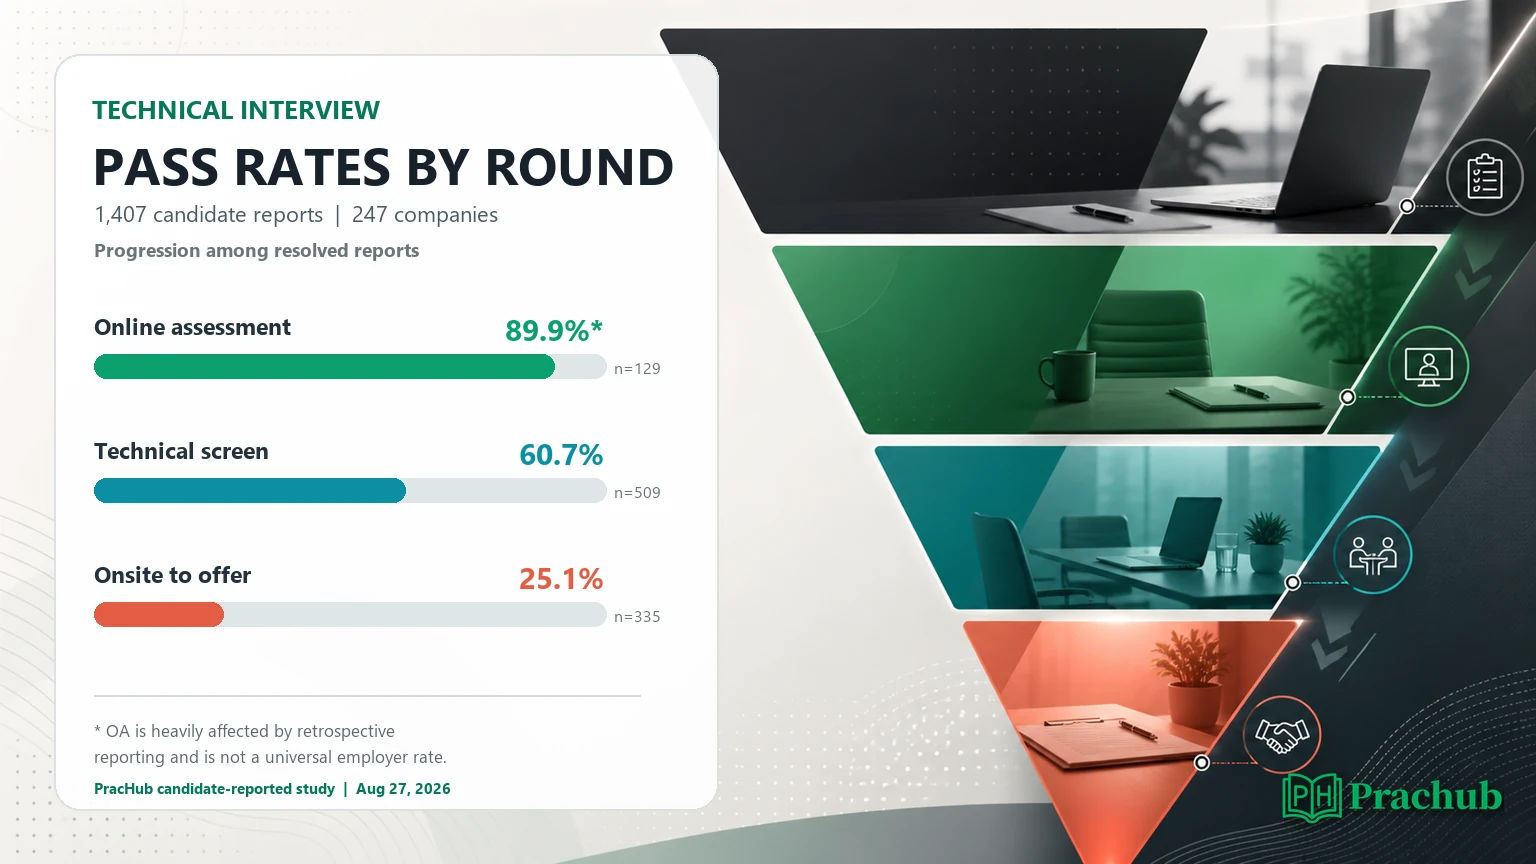
Across 1,407 public candidate reports on PracHub, the clearest bottleneck is the onsite. Among 335 onsite reports with an explicit offer or rejection outcome, 84 ended in an offer: a 25.1% candidate-reported progression rate. Technical screens produced a 60.7% progression rate among 509 resolved reports.
Those numbers are not universal employer pass rates. PracHub reports are self-selected, company processes differ, and 843 stories did not end with a clean offer-or-rejection label. The online-assessment and take-home figures are especially inflated by retrospective reports from candidates who later described a full loop.
Browse the underlying PracHub interview experiences to see how candidates describe individual stages. This study turns the structured round and outcome fields into a transparent directional benchmark, while keeping the missing data visible.
The quick answer: the onsite is the most reliable bottleneck
The onsite result is the most interpretable finding: 25.1% of resolved onsite reports ended in an offer, with a 95% Wilson interval of 20.7% to 30.0%. That is 84 offers and 251 rejections.
The technical-screen figure is useful but more selection-sensitive. Of 509 resolved technical-screen reports, 309 recorded a later stage or offer and 200 ended in rejection, producing 60.7%. The OA and take-home numbers should be read primarily as evidence of reporting bias, not as realistic odds.
| Reported stage | Reports naming stage | Resolved reports | Progressed | Candidate-reported progression | 95% interval | Unresolved |
|---|---|---|---|---|---|---|
| Online assessment | 248 | 129 | 116 | 89.9% | 83.5%-94.0% | 119 |
| Take-home project | 37 | 36 | 36 | 100.0% | 90.4%-100.0% | 1 |
| Technical screen | 863 | 509 | 309 | 60.7% | 56.4%-64.9% | 354 |
| Onsite | 685 | 335 | 84 | 25.1% | 20.7%-30.0% | 350 |
The practical benchmark is not “I should have a 60.7% chance.” It is that later-stage conversion falls sharply, and the onsite requires consistency across several independent signals rather than one correct solution.
What “pass rate” means in this study
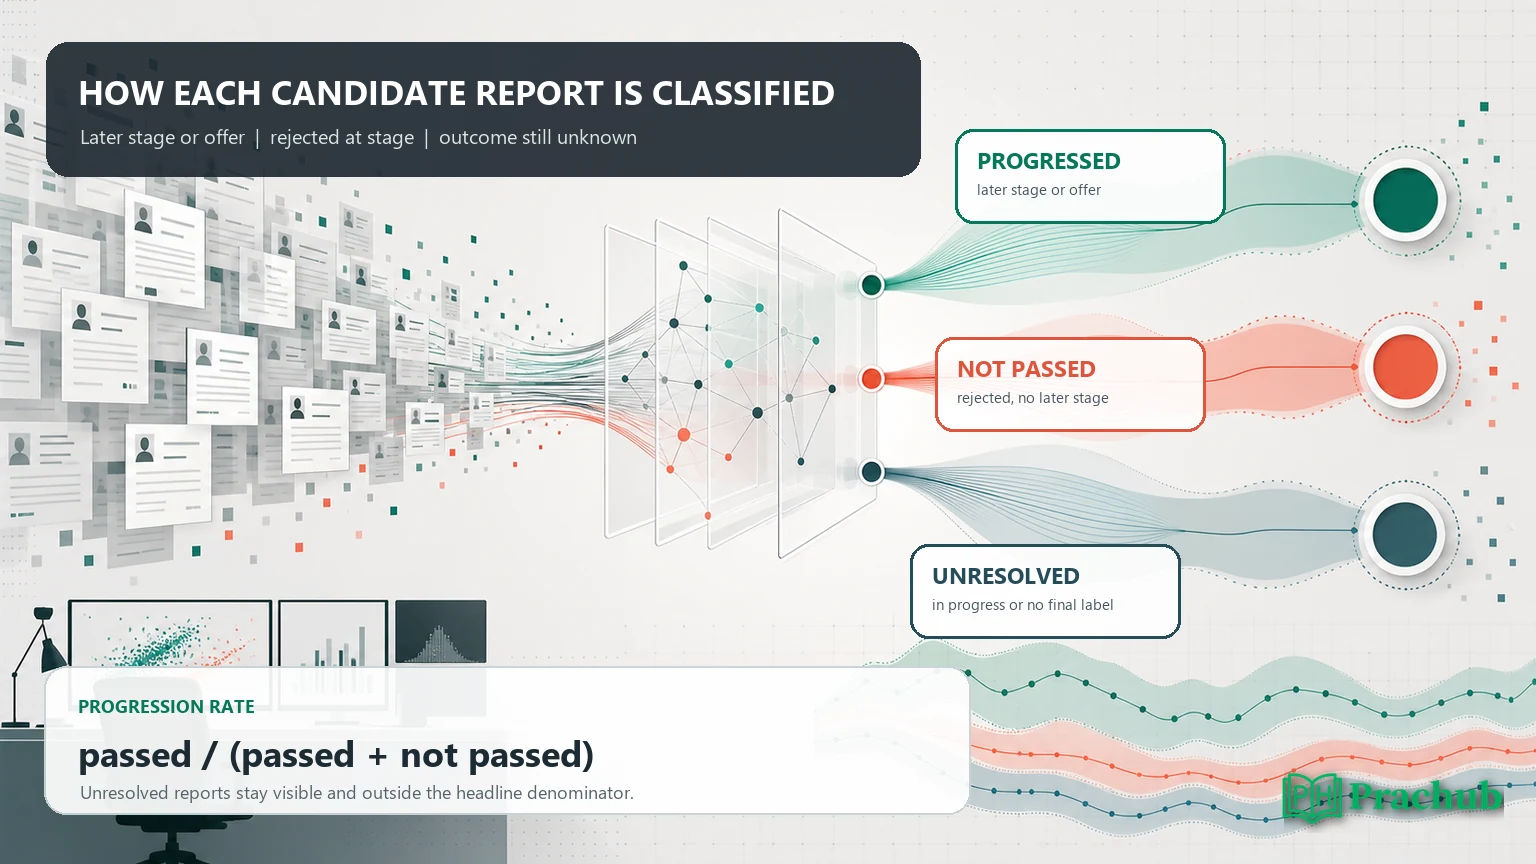
A candidate-reported pass rate is the share of resolved reports that show progression beyond a named stage. It is not the percentage of all applicants an employer advances, and it is not a prediction for one candidate.
We counted a stage as passed when the same report listed a later standardized stage or recorded an offer. We counted it as not passed when the report ended in rejection without a later stage. Unknown, in-progress, ghosted, withdrawn, and missing outcomes were marked unresolved rather than guessed.
For comparability, the analysis used this broad order: HR screen, online assessment, take-home project, technical screen, onsite, then offer. Real companies can swap or repeat stages, so the standardized order is an analytical convenience rather than a claim about every hiring loop.
How the PracHub study was built
The snapshot was retrieved on August 27, 2026 from PracHub's public interview-experience feed. It contained 1,407 unique reports across 247 companies. Of those, 1,387 were reported in 2025 or 2026, so old records do not drive the result. Restricting the calculation to those two years changed the technical-screen rate from 60.7% to 61.1% and the onsite rate from 25.1% to 25.0%.
The role mix is broader than software engineering alone: 743 reports were labeled Software Engineer, 309 Data Scientist, 101 Machine Learning Engineer, and the remainder covered data, infrastructure, research, product, and other technical positions. Seniority included 150 intern or new-grad reports, 194 Senior+ reports, and 1,063 general reports.
PracHub's source fields also matter. The snapshot contained 1,405 curated candidate reports gathered from public accounts and two direct user submissions. This is a study of reported experiences, not a randomized survey, an ATS export, or an employer audit.
Round-by-round findings
Online assessments: 89.9% is not a credible universal OA rate
The resolved OA sample showed 116 progressions and 13 rejections. Taken literally, that is 89.9%. But 119 other OA reports were unresolved, and candidates who reach later interviews are more likely to mention the earlier assessment when recounting their full journey.
If every unresolved OA report were treated as a failure, the rate would fall to 46.8%. If all were treated as passes, it would be 94.8%. That range is too wide for a personal probability estimate. The useful conclusion is simply that PracHub's retrospective reports under-capture candidates who disappear immediately after an OA.
Take-homes: the sample is too selected to benchmark
All 36 resolved take-home reports showed progression, but the entire stage appeared in only 37 stories. A 100% result with this collection method does not mean take-homes are easy. It means candidates who failed a take-home were rarely represented as a resolved, take-home-only report.
Treat this row as a warning about denominator quality. A precise percentage can still be misleading when the sample is small and the missingness is directional.
Technical screens: 60.7% progressed among resolved reports
Technical screens had the largest usable sample: 509 resolved outcomes from 863 reports that named the stage. Of those, 309 showed a later round or offer and 200 ended in rejection. The 95% interval over resolved reports was 56.4% to 64.9%.
This rate can still run high because a later-stage retrospective naturally includes the earlier screen. It is best read as evidence that the technical screen is a major filter, but not as severe as the onsite in this dataset.
Onsites: 25.1% ended in an offer among resolved reports
The onsite has a cleaner success definition because the next meaningful outcome is usually an offer. In the resolved sample, 84 reports ended in an offer and 251 ended in rejection.
Even here, 350 onsite reports were unresolved. Some were still in progress; others lacked a final outcome or reported no response. The 25.1% figure describes the resolved stories only. It does not convert unresolved candidates into silent rejections.
Why unresolved reports change the interpretation
Excluding unresolved records gives a clear formula, but it can create bias if missing outcomes are not random. To make that visible, we also calculated extreme bounds by treating every unresolved report first as a failure and then as a pass.
The technical-screen range becomes 35.8% to 76.8%; the onsite range becomes 12.3% to 63.4%. Neither extreme is realistic. Their job is to show how much uncertainty remains when candidates do not return to update a story.
That is why the resolved-sample 95% interval and the all-report missing-outcome bounds answer different questions. The interval describes sampling uncertainty inside the resolved group. The bounds expose outcome uncertainty outside it.
How these results compare with employer-side benchmarks
Ashby's 2026 Recruiting Operations Benchmarks reported about 24% passthrough at the onsite stage, close to PracHub's 25.1% resolved onsite result. Ashby also reported about 35% at screens and much higher conversion after the onsite. The datasets are not interchangeable: Ashby analyzes employer ATS records, while PracHub analyzes self-selected candidate accounts across technical roles.
A HackerRank employer survey reported an average 34% phone-screen-to-onsite rate, while the largest group of respondents reported only 10% to 19%. That spread shows why one “industry average” can hide company size, recruiter calibration, role scarcity, and process design.
An interviewing.io analysis of an Opendoor process found that onsite conversion moved from under 30% toward 40% after the company changed who conducted phone screens. The lesson is useful for candidates too: pass rates partly reflect the funnel and interview system, not only candidate ability.
Does seniority change the result?
The descriptive split is interesting but not causal. Intern and new-grad reports showed a 46.2% onsite progression rate among 39 resolved reports, while Senior+ reports showed 24.6% among 69. Technical-screen progression was 68.6% for early-career reports and 78.0% for Senior+.
| Segment | Technical-screen progression | Resolved screen reports | Onsite progression | Resolved onsite reports |
|---|---|---|---|---|
| Intern and New Grad | 68.6% | 51 | 46.2% | 39 |
| Senior+ | 78.0% | 91 | 24.6% | 69 |
Do not conclude that junior onsites are twice as easy. The companies, roles, funnel shapes, and reporting behavior differ between the groups. Senior loops also include more design, scope, and leadership calibration. The table is a hypothesis generator, not a controlled comparison.
How to use pass-rate data without psyching yourself out
For an online assessment, optimize completion and recoverability. Read the rules, choose a familiar language, secure easy test cases, and leave time for edge cases. A perfect score can still be followed by resume screening or verification.
For a technical screen, make reasoning observable. Clarify inputs, state a baseline, improve it, write runnable code, test aloud, and respond to hints. A correct silent solution gives the interviewer less evidence than a well-explained and well-tested one.
For an onsite, prepare for consistency rather than one heroic round. A loop can combine coding, system design, behavioral judgment, debugging, and project depth. Reviewers are aggregating independent signals, so one memorized question rarely carries the whole decision.
After any round, keep the pipeline moving. Record what happened, send only a concise logistics follow-up when appropriate, and continue other applications. A benchmark is useful for planning; it is a poor reason to refresh a portal every hour.
Practice the skills evaluated across rounds
These PracHub question-bank records train common interview skills. They are practice material, not predictions of your exact assessment or interview.
| PracHub question | Practice focus | Why it helps |
|---|---|---|
| Find the Earliest Pair with a Target Sum | Arrays, hashing, edge cases | Builds a clean clarify-code-test routine for timed screens. |
| Design a Concurrent Image Processing Service | Concurrency, retries, cancellation | Trains implementation and reliability trade-offs for practical rounds. |
| Implement a Set with Readable Snapshots | Data structures, state, complexity | Tests invariants and communication when requirements evolve. |
| Compute a Depth-Weighted Sum of a Nested List | Recursion, traversal, testing | Reinforces structured reasoning and boundary-case coverage. |
| Design an Alert Notification Service for Downstream Consumers | System design, delivery, failure handling | Prepares you to defend APIs, guarantees, and operational choices. |
Frequently asked questions
What is the average technical interview pass rate?
There is no universal rate. In this PracHub candidate-reported study, 60.7% of resolved technical-screen reports showed progression, while 25.1% of resolved onsite reports ended in an offer. Employer-side datasets can differ because they include all candidates in an ATS rather than only people who publish an experience.
Which technical interview round rejects the most candidates?
The onsite was the strongest bottleneck in the resolved PracHub sample: 251 rejections versus 84 offers. That does not mean the onsite removes the most applicants in absolute volume; online assessments and resume screens may process many more people whose outcomes never become public reports.
Is a 25% onsite pass rate normal?
It is plausible as a directional benchmark. PracHub's resolved onsite reports produced 25.1%, and Ashby's 2026 employer-side benchmark reported about 24% onsite passthrough. Company, level, source, and hiring demand can move the number substantially, so do not treat one-quarter as a guaranteed personal chance.
Why does the PracHub OA rate look so high?
Because the feed is retrospective and self-selected. Candidates who later describe a technical screen or onsite often include the OA in the same story, while people rejected immediately after an OA are less likely to publish a complete account. The 89.9% resolved-report number therefore overstates a population-wide OA pass rate.
Does solving every coding question guarantee a pass?
No. Interviewers can evaluate clarification, code quality, testing, complexity, communication, behavioral signals, verification, and role fit. In multi-round loops, the decision combines evidence across interviewers. A complete solution helps, but it does not erase weak reasoning or a mismatch elsewhere in the process.
Final takeaway
The most defensible headline is simple: among resolved PracHub candidate reports, roughly one in four onsite stories ended in an offer. Technical screens showed higher progression, while OA and take-home percentages were too affected by retrospective reporting to use as literal odds.
Use the numbers to allocate preparation time, not to predict your fate. Practice representative questions, make your reasoning visible, and prepare for a sequence of signals rather than a single pass-or-fail trick. The PracHub question library lets you build that practice across coding, systems, data, and behavioral rounds.
Sources and Further Reading
- PracHub Interview Experiences
- Ashby 2026 Recruiting Operations Benchmarks
- HackerRank Tech Recruiting Benchmark Report
Research note: the PracHub snapshot was retrieved on August 27, 2026. Candidate reports are self-selected, round order varies by employer, and missing outcomes are not assumed to be failures or passes.
Comments (0)