TestGorilla Google Sheets Simulation: Check Formulas, Lookups, and Workbook Results
Quick Overview
Identify the named TestGorilla spreadsheet simulation, then rebuild an original staffing-capacity workbook and verify exact lookups, role-specific shortfalls, native pivot totals, and source-range expansion.
Prepare for a TestGorilla Google Sheets simulation by proving what the workbook calculates. A lookup can return a number and still select the wrong role. A pivot can look complete while excluding the last row. A staffing total can balance even though one team remains short of hours.
Read the named product in your invitation, then practise its published spreadsheet skills. This guide uses an original staffing-capacity exercise with checkable formulas, a native Google Sheets pivot, and deliberate input changes. For the broader interview explanation, try PracHub’s How adapt to Google Sheets?.
Evidence boundary: Official TestGorilla pages support the product and skill descriptions below. Google documentation supports spreadsheet feature behavior. The workbook, numbers, defects, and preparation advice are original PracHub practice material or editorial inference. We did not find two independent, same-cycle candidate reports establishing this exact simulation’s current flow, so we do not claim its private questions, scoring rules, or employer cutoff.
Identify the simulation before practising
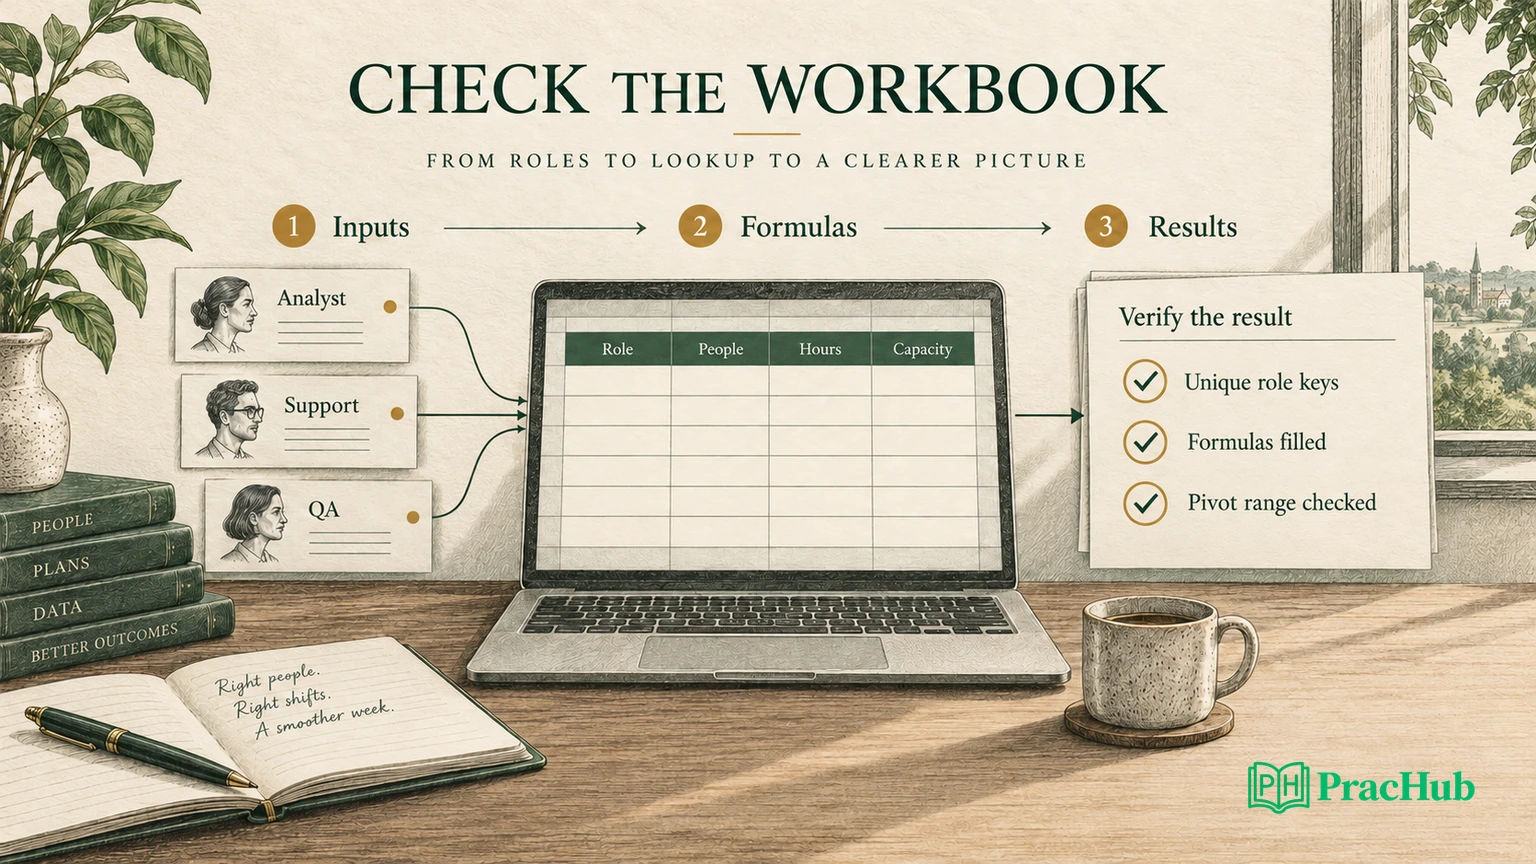
Official fact, checked October 11, 2026: TestGorilla’s named Spreadsheet Simulation: Google Sheets (Intermediate) lists fundamental data handling, conditional formulas, lookup formulas, and pivot tables. Use those four skills to choose your practice tasks. They do not establish which workbook your employer selected or how the employer combines the result with other evidence.
The provider’s March 2024 release notes already describe a Google Sheets simulation. Treat it as an established product rather than a newly launched 2026 assessment. Current provider pages also contain inconsistent presentation labels for the spreadsheet offering. Do not infer a universal multiple-choice format or fixed timer from a related catalog card.
Read the invitation for the exact test name, permitted tools, deadline, working environment, and submission instructions. Separate the deadline for opening an assessment from any timer shown after you start. If an instruction is absent, verify it with the employer or the candidate support channel before relying on an online account of someone else’s test.
Preparation inference: Practising an editable workbook is sensible for these published skills. It does not mean that every TestGorilla assessment gives candidates the same Google interface, task sequence, or ability to revisit a submitted answer. Follow the screen you receive.
Build the original staffing-capacity workbook
Open the original Google Sheets answer workbook. It contains only synthetic practice data. Use File → Make a copy for an editable version. To attempt the task without the answer, rebuild the input blocks below in a blank sheet named Staffing, then compare your formulas and summary with the workbook.
The business question is narrow: how many required working hours cannot be covered in each shift? One row represents one shift and role. People assigned to one role cannot cover another role in this exercise. Hours are productive hours per person for that role, and people counts are nonnegative whole numbers. These assumptions are part of the practice task.
Put the following inputs in Staffing!A1:D7. Use numeric values for People and Required hours. Labels such as Mon and Tue identify shifts here, rather than calendar dates across several weeks.
| Shift | Role | People | Required hours |
|---|---|---|---|
| Mon | Analyst | 2 | 15 |
| Mon | Support | 3 | 14 |
| Tue | Analyst | 3 | 16 |
| Tue | QA | 2 | 10 |
| Wed | Support | 2 | 9 |
| Wed | QA | 3 | 14 |
Put this mapping in J1:K4. The role labels must be unique, and every required hours-per-person value must be populated and numeric. Zero is permitted when it means no available productive hours; a blank means the value is unknown.
| Role | Hours/person |
|---|---|
| Analyst | 6 |
| Support | 5 |
| QA | 4 |
Add headers E through H: Hours/person, Capacity hours, Shortfall hours, and Status. Keep the mapping separate from the calculations so you can inspect and change it without hunting for hardcoded constants inside formulas. When a new role has different hours, update the mapping and extend its lookup range.
Use an exact lookup and inspect its prerequisites
Enter this formula in E2 and fill down through E7. The examples use English function names and comma separators; your sheet’s locale may use different separators.
=VLOOKUP(B2,$J$2:$K$4,2,FALSE)
Official feature behavior: Google’s VLOOKUP documentation distinguishes exact matching with FALSE from approximate matching and notes that VLOOKUP returns the first matching entry. Here, role names require exact matching. The dollar signs keep the mapping range fixed while B2 moves to B3, B4, and later rows.
Check the first, middle, and last filled formulas. E2 should read the Analyst value, E5 the QA value, and E7 the QA value again. A correct first row does not prove the range stayed fixed after copying. Likewise, a numeric result does not prove the mapping has only one matching role.
Try changing B2 to Engineering in your copy. The unknown role should expose a lookup failure. Resolve the missing mapping or incorrect input explicitly. Replacing every error with zero would make an unknown role appear to have a known zero-hour capacity and blur an important distinction.
Now temporarily change J3 from Support to Analyst. The mapping contains two Analyst rows with different hours. A first-match result cannot establish which conflicting value is correct. Inspect duplicate keys before accepting a lookup-based answer, and restore Support afterward. Do not delete a conflicting row without understanding which value is intended.
Calculate capacity and positive shortfall
Enter these formulas in F2, G2, and H2, then fill the three columns through row 7.
=C2*E2
=MAX(0,D2-F2)
=IF(G2>0,"Shortfall","Covered")
Capacity multiplies assigned people by available hours per person. Shortfall takes the positive part of required hours minus capacity. Status describes that calculated shortfall. Google’s IF documentation explains the true and false branches; the label here follows the practice rule rather than an undocumented assessment scoring convention.
For Monday’s Analyst row, two people at six hours provide 12 hours against 15 required, leaving three hours short. Monday’s Support row has 15 hours of capacity against 14 required, leaving zero shortfall. Do not report negative shortfall as spare capacity unless the task specifically asks for a separate surplus measure.
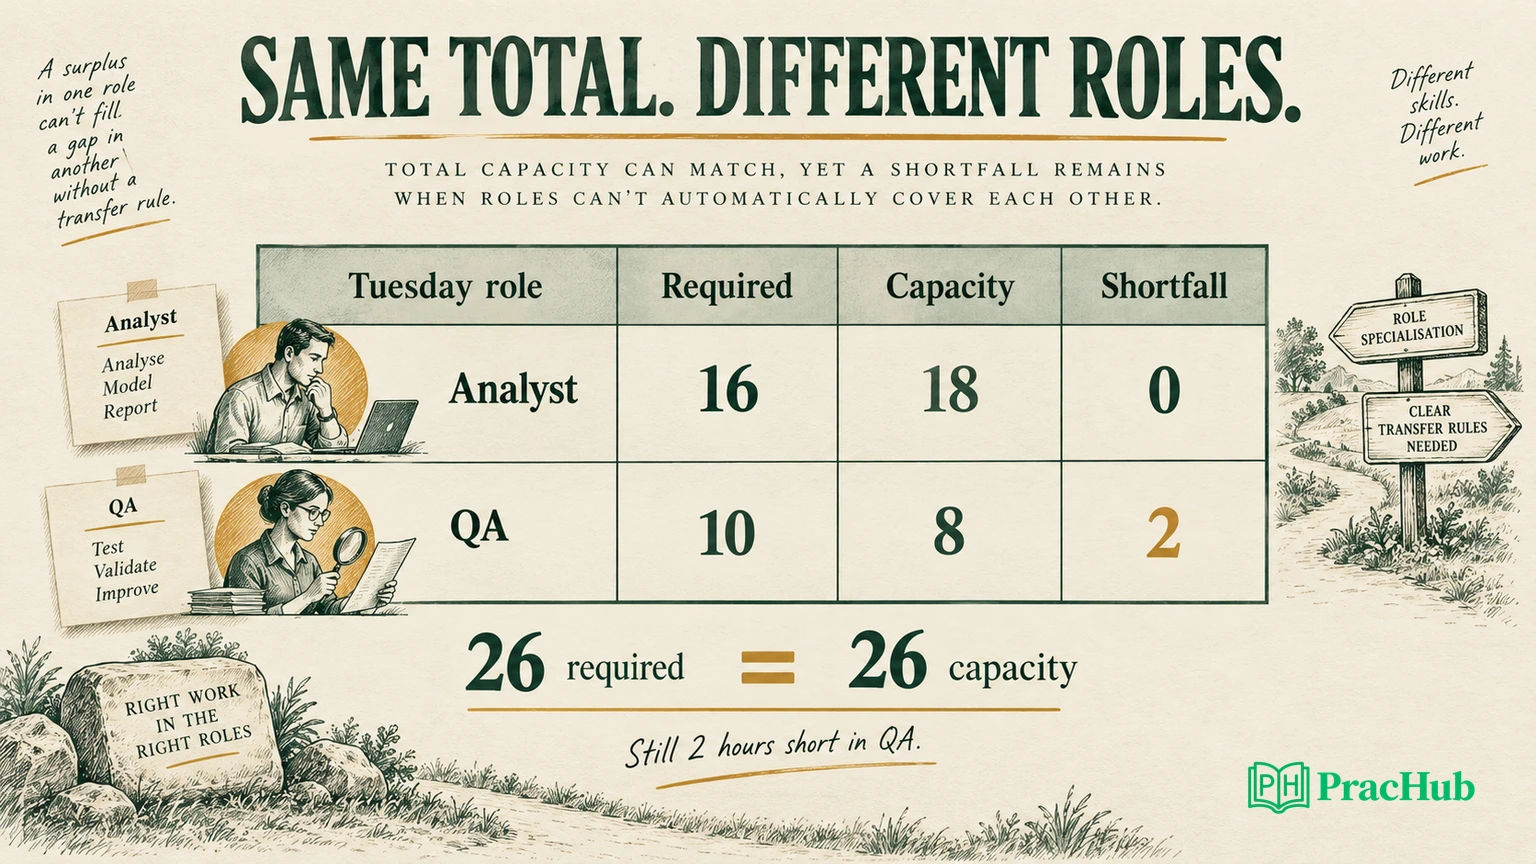
Tuesday is the important counterexample. Analyst capacity is 18 against 16 required; QA capacity is eight against ten required. Total Tuesday capacity and demand both equal 26. The shift still has a two-hour QA shortfall because this exercise does not allow roles to substitute for each other.
A total-level MAX(0,total demand-total capacity) answers a different question. Across all shifts, it returns three hours, while summing valid row shortfalls returns seven. The subtraction is arithmetically correct but violates the role-specific constraint. Explain that constraint before recommending staffing changes.
Configure a pivot that answers the same question
Select Staffing!A1:H7, choose Insert → Pivot table, and place the result on a sheet named Summary. Add Shift as the row field. Add Required hours, Capacity hours, and Shortfall hours as values, each summarized by SUM. Include totals. Do not add the mapping block or a manually typed subtotal row to the source range.
The completed workbook contains a native Google Sheets pivot at Summary!A4. The expected results are:
| Shift | Required hours | Capacity hours | Shortfall hours |
|---|---|---|---|
| Mon | 29 | 27 | 3 |
| Tue | 26 | 26 | 2 |
| Wed | 23 | 22 | 2 |
| Grand Total | 78 | 75 | 7 |
Check a single pivot result against the underlying rows before checking the grand total. Monday’s required hours are 15 plus 14; its shortfall is three plus zero. This is more revealing than accepting a familiar-looking final number.
SUM measures hours. COUNT measures populated records, which would answer how many staffing entries exist. An unexpected count often points to the wrong aggregation setting or values stored as text. Confirm both the summary operation and the source types before changing formulas to make the report look plausible.
Google’s pivot-table help explains source-range selection and refresh behavior. The pivot refreshes when its source cells change. A new row outside that source range remains excluded. Treat source coverage as something to verify.
Audit the answer by changing the workbook
Original verification: We checked the baseline formulas and the pivot in native Google Sheets, then changed inputs and restored the original data. These checks validate this practice workbook. They do not reproduce TestGorilla’s private grader or prove what an employer will accept.
Use the following checks on your own copy. Change one condition at a time so you can explain which dependency moved and why.
| Change | Expected evidence | What it catches |
|---|---|---|
| Replace B2 with Engineering | E2 and its dependent results expose the missing lookup | Unknown role hidden by a default |
| Duplicate Analyst in J3 | Mapping visibly contains conflicting Analyst entries; the first-match lookup is insufficient | Ambiguous lookup source |
| Set K2 to numeric zero | Monday Analyst capacity becomes 0 and shortfall becomes 15 | A legitimate zero mistaken for missing data |
| Clear K2 instead | The required hours/person input is missing; multiplication can still produce 0 | Missing input disguised as a calculated number |
| Add Thu, QA, 1 person, 7 required hours in row 8 | New row capacity 4, shortfall 3; old pivot remains at 78/75/7 | New data outside the pivot source |
| Expand pivot source to A1:H8 | Grand totals become 85 required, 79 capacity, 10 shortfall | Incomplete source coverage |
For the new row, fill E8:H8 using the same formula pattern before expanding the pivot. Adding raw inputs alone is not enough if the calculated columns remain blank. Inspect the new row first, then confirm that the summary incorporates it.
The missing-capacity example is especially useful. In the native check, the cleared lookup value appeared blank while the multiplication produced zero. The simple formulas assume the mapping is complete. If that prerequisite fails, investigate and repair it before interpreting the report. Do not label the workbook correct merely because it contains no obvious error badge.
Restore the mapping and remove the added practice row when returning to the baseline answer. Confirm all three totals return to 78, 75, and seven. A repeatable repair leaves both the calculations and the explanation consistent with the current inputs.
Explain the result and confirm completion
Practise a short explanation that identifies the decision and its limit: “The workbook has 78 required hours and 75 available hours. Under the rule that roles cannot substitute for one another, the uncovered requirement is seven hours. Tuesday’s totals balance, but QA remains two hours short. I checked the role mapping, filled formulas, and pivot source before accepting the result.”
If the interviewer allows role transfers, the model needs an additional rule about which people can cover which work. Do not quietly reuse the seven-hour answer under changed assumptions. Ask what transfers are permitted, then update the calculation and checks accordingly.
For the real assessment, distinguish an edited workbook from a submitted answer. Read the displayed instructions for saving, submitting, or moving to the next task. Inspect any permitted answer preview, then check the displayed submission or completion state. Avoid assuming that a browser tab, an autosave badge, or an exported file alone means the employer received your answer.
Five PracHub questions for spreadsheet reasoning
These questions practise related skills rather than reproduce TestGorilla prompts. Explain how each idea transfers to a workbook instead of memorizing a SQL solution as a spreadsheet answer.
| PracHub question | Practice focus |
|---|---|
| How adapt to Google Sheets? | Explain a reliable spreadsheet workflow and its limits. |
| Build SQL pivot with lookups and currency conversion | Preserve lookup meaning before grouped reporting. |
| Design metrics resilient to data quality | Show how incomplete inputs change conclusions. |
| Write conditional aggregation SQL queries | Translate a conditional measure into an explicit rule. |
| Reconcile ledgers with SQL/Python and late events | Reconcile a summary with its underlying records. |
Use How adapt to Google Sheets? to rehearse the final explanation after rebuilding the staffing exercise unaided. Describe one defect you caught, the check that exposed it, and the assumption behind the repaired result.
Comments (0)